. 2024 Mar 11;15(1):2191.
doi: 10.1038/s41467-024-46565-5.

Lipoarabinomannan mediates localized cell wall integrity during division in mycobacteria

Affiliations

Lipoarabinomannan mediates localized cell wall integrity during division in mycobacteria

Ian L Sparks et al. Nat Commun. .

Abstract

The growth and division of mycobacteria, which include clinically relevant pathogens, deviate from that of canonical bacterial models. Despite their Gram-positive ancestry, mycobacteria synthesize and elongate a diderm envelope asymmetrically from the poles, with the old pole elongating more robustly than the new pole. The phosphatidylinositol-anchored lipoglycans lipomannan (LM) and lipoarabinomannan (LAM) are cell envelope components critical for host-pathogen interactions, but their physiological functions in mycobacteria remained elusive. In this work, using biosynthetic mutants of these lipoglycans, we examine their roles in maintaining cell envelope integrity in Mycobacterium smegmatis and Mycobacterium tuberculosis. We find that mutants defective in producing mature LAM fail to maintain rod cell shape specifically at the new pole and para-septal regions whereas a mutant that produces a larger LAM becomes multi-septated. Therefore, LAM plays critical and distinct roles at subcellular locations associated with division in mycobacteria, including maintenance of local cell wall integrity and septal placement.


Conflict of interest statement

The authors declare no competing interests.

Figures
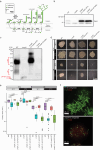
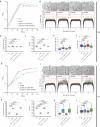
Fig. 1
Fig. 1. Medium-dependent growth defects of ∆mptA.
a Proposed pathway for PIM, LM, and LAM biosynthesis. Bold text, enzymes. Ara-T, arabinosyltransferase; Man-T, mannosyltransferase. Cartoon made with BioRender. b Anti-MptA immunoblot of cell lysates prepared from WT, ∆mptA, ∆mptA L5::mptA (WT), and ∆mptA L5::mptA (D129A) cells. Blot is representative of two independent experiments with similar results. c Lipoglycans extracted from WT, ∆mptA, ∆mptA L5::mptA (WT), and ∆mptA L5::mptA (D129A) cells, visualized by glycan staining. Gel is representative of two independent experiments with similar results. d Representative example images comparing colony size between WT, ∆mptA, ∆mptA L5::mptA (WT), and ∆mptA L5::mptA (D129A) on Middlebrook 7H10 and LB solid agar media grown at 30 °C or 37 °C. e Quantification of colony area for each condition described in Fig. 1d. n = 8, 22, 14, 53 (7H10 30 °C); 15, 15, 21, 9 (7H10 37 °C); 7, 16, 23, 26 (LB 30 °C); 9, 34, 22, 32 (LB 37 °C) colonies for WT, ∆mptA, ∆mptA L5::mptA (WT), and ∆mptA L5::mptA (D129A), respectively. A box spanning the interquartile range (IQR) is drawn from the first quartile to the third quartile with a horizontal line indicating the median. The whiskers extend from the box to the farthest data point within 1.5x IQR from the box. Dots beyond the whiskers indicate potential outliers. Statistical significance was determined by one-way ANOVA and Tukey post-hoc test. f Cross-sectional imaging of microcolonies from WT and ∆mptA strains stained with SYTO9 (live, green) and propidium iodide (dead, red) grown as micro-aggregates in LB medium. Images are representative of results obtained from three independent experiments with similar results. Source data for panels b, c, and e are provided in the Source Data file. Colony image data for panels d and e are available at https://github.com/IanLairdSparks/Sparks_2023. Raw micro-aggregate data images for panel f can be accessed via 10.5061/dryad.1vhhmgr1w.
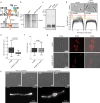
Fig. 2
Fig. 2. Growth and cell morphology of planktonically growing cells.
a, g Growth curves of WT, ∆mptA, ∆mptA L5::mptA (WT), and ∆mptA L5::mptA (D129A) cells grown planktonically in Middlebrook 7H9 (a) or LB (g) medium. OD600, optical density at 600 nm. Error bars represent the standard error of the mean of three biological replicates. b, h Doubling times, determined from optical density growth curves, of WT, ∆mptA, ∆mptA L5::mptA (WT), and ∆mptA L5::mptA (D129A) cells in 7H9 (b) or LB (h) during log-phase growth. The middle line indicates the mean of three biological replicates (indicated with colored squares). The bottom and top lines represent the standard error of the mean. c, i CFU/mL of WT, ∆mptA, ∆mptA L5::mptA (WT), and ∆mptA L5::mptA (D129A) cells in 7H9 (c) or LB (i) at the 24-h timepoint. The middle line indicates the mean of 3 biological replicates (indicated with colored squares). The bottom and top lines represent the standard error of the mean. d, j Phase contrast micrographs and cell width profiles of planktonic WT, ∆mptA, ∆mptA L5::mptA (WT), and ∆mptA L5::mptA (D129A) cells grown in 7H9 (d) and LB (j). Each cell’s length was normalized to the same length with “p” and “m” indicating cell poles and mid-cell, respectively. The percentage values above the dotted colored lines indicate the portion of cells exhibiting maximum cell widths greater than or equal to the corresponding cell width threshold. e, k Boxplots comparing the distribution of maximum cell widths between WT, ∆mptA, ∆mptA L5::mptA (WT), and ∆mptA L5::mptA (D129A) strains grown planktonically in 7H9 (e) or LB (k). n = 100 cells for each strain in panel (e) and n = 92, 94, 100, 100 cells for WT, ∆mptA, ∆mptA L5::mptA (WT), and ∆mptA L5::mptA (D129A), respectively in panel (k). f, l Boxplots comparing the distribution of cell lengths between WT, ∆mptA, ∆mptA L5::mptA (WT), and ∆mptA L5::mptA (D129A) strains grown planktonically in 7H9 (f) or LB (l). The boxplots are drawn as described in Fig. 1. Statistical significance for each experiment was determined by one-way ANOVA and Tukey post-hoc test. n = 174, 162, 111, 136 cells for WT, ∆mptA, ∆mptA L5::mptA (WT), and ∆mptA L5::mptA (D129A) respectively in panel (f). n = 92, 94, 121, 158 cells for WT, ∆mptA, ∆mptA L5::mptA (WT), and ∆mptA L5::mptA (D129A), respectively in panel (l). Source data for each sub-panel are provided in the Source Data file. Microscopy image data for panels df, jl are available at https://github.com/IanLairdSparks/Sparks_2023.
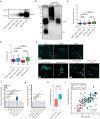
Fig. 3
Fig. 3. Cells deficient in LAM fail to maintain cell shape.
a SDS-PAGE of lipoglycans extracted from WT and various lipoglycan mutants, visualized by glycan staining (WT and mutant lanes are from the same PAGE gel). mptC OE, mptC overexpression strain; embC KD, embC CRISPRi knockdown strain. ATC, anhydrotetracycline. Gel is representative of two independent experiments with similar results. b Phase contrast micrographs and cell width profiles for each strain when grown planktonically in LB medium. Cell width profiles were graphed as described in Fig. 2. “p” and “m” indicate cell poles and mid-cell, respectively. c, d Boxplots comparing the distribution of maximum cell widths (c) and cell lengths (d) among mutant strains. n = 92, 100, 100, 100 (panel c); 92, 201, 119, 102, 187 (panel d) cells for WT, ∆mptC, mptC OE, embC KD -ATC, and embC KD +ATC, respectively. The boxplots are drawn as described in Fig. 1. Statistical significance was determined by one-way ANOVA and Tukey post-hoc test. Source data for each sub-panel are provided in the Source Data file. Microscopy image data for panels bd are available at https://github.com/IanLairdSparks/Sparks_2023.
Fig. 4
Fig. 4. PonA1 rescues the morphological defects of ∆mptA.
a The domain structure of PonA1 and the corresponding cell wall substrates and interacting partners. The C-terminal domain of PonA1 interacts with RipA to suppress the activity of the peptidoglycan hydrolase complex formed by RipA and RpfB. TG, transglycosylase domain; TP, transpeptidase domain; TM, transmembrane domain. Cartoon made with Microsoft PowerPoint. b SDS-PAGE of ∆mptA and ∆mptA L5::ponA1 cell lysates in which PonA1 is stained with the fluorescent penicillin analog bocillin. Gel is representative of two independent experiments with similar results. c SDS-PAGE of lipoglycans extracted from ∆mptA and ∆mptA L5::ponA1, visualized by glycan staining, showing that ponA1 overexpression does not restore LM/LAM biosynthesis. Gel is representative of two independent experiments with similar results. d Phase contrast micrographs and cell width profiles of ∆mptA cells and ∆mptA cells overproducing PonA1 (∆mptA L5::ponA1). Cell width profiles were graphed as described in Fig. 2. “p” and “m” indicate cell poles and mid-cell, respectively. e, f Boxplots comparing the distribution of maximum cell widths (e) and cell lengths (f) between ∆mptA and ∆mptA L5::ponA1. n = 94, 87 cells for ∆mptA and ∆mptA L5::ponA1, respectively. The boxplots are drawn as described in Fig. 1. Statistical significance was determined using the one-tailed student’s T-test. In panel (e), P = 3.58 × 10−13. g Phase contrast and fluorescence micrographs of RADA-labeled ∆mptA and ∆mptA L5::ponA1 cells. Microscope images are representative of two independent experiments with similar results. h Top: phase contrast micrographs of ATC-inducible ripAB CRISPRi knockdown strains constructed in the WT and ∆mptA genetic backgrounds. ripAB KD was induced for 20 h. Bottom: fluorescent micrographs of ATC-inducible ripAB KD strains stained with RADA. ripAB KD was induced for 8 h. Microscope images are representative of two independent experiments with similar results. Source data for panels bare provided in the Source Data file. Microscopy image data for panels dh are available at https://github.com/IanLairdSparks/Sparks_2023.
Fig. 5
Fig. 5. Large LAM biosynthesis results in multiseptated cells.
a Anti-MptA immunoblot of cell lysates prepared from mptA OE (-/+ acetamide), and vector control (-/+ acetamide) cells. Equal protein amount was loaded per lane. Ace, acetamide. Blot is representative of two independent experiments with similar results. b SDS-PAGE of lipoglycans extracted from WT, and the mptA OE strain with and without acetamide, visualized by glycan staining. Gel is representative of two independent experiments with similar results. c, d Boxplots comparing the distribution of maximum cell widths (c) and cell lengths (d) of mptA OE (-/+ acetamide), and vector control (-/+ acetamide) strains. n = 100, 100, 100, 100 (panel c) and 103, 105, 161, 118 cells (panel d) for vector control - acetamide, vector control + acetamide, mptA OE - acetamide, and mptA OE + acetamide, respectively. The boxplots are drawn as described in Fig. 1. Statistical significance was determined by one-way ANOVA and Tukey post-hoc test. e Fluorescence micrographs of HADA-labeled cells. f Septa enumeration for WT and lipoglycan mutant cells grown planktonically in LB. The combined bar height indicates the total percentage of cells with one or more septa. Statistical significance was determined by one-sided chi-square tests, with total non-septated and total septated cell counts as the two categorical variables compared between strains. g Septa enumeration for WT, mptA OE (-/+ acetamide), and vector control (-/+ acetamide) strains grown planktonically in acidic (pH 5.5) LB medium. Statistical significance was determined as described in panel (f). h Comparison between the distribution of septum-to-septum distances observed in multiseptated acetamide-induced mptA OE cells and multiseptated WT L5::ripAB KD cells. n values represent the total number of septum-to-septum distances measured in multiseptated cells of each strain. mptA overexpression and ripAB knockdown were both induced for 8 h. The boxplots are drawn as described in Fig. 1. Statistical significance was determined using the one-tailed student’s T-test. P = 1.41 × 10−8. i Correlation of cell lengths to inter-septal distances, comparing multiseptated acetamide-induced mptA OE cells (red circle) and multiseptated WT L5::ripAB KD cells (blue square). Pearson correlation analysis was conducted to determine the strength of correlation (agnostic to genetic background); septum-to-septum distance and cell length were found to be moderately positively correlated, r(120) = 0.70, P = 2.36 × 10−19. Statistical significance was determined using the two-tailed student’s T-test. Source data for panels ad and fi are provided in the Source Data file. Microscopy image data for panels ci are available at https://github.com/IanLairdSparks/Sparks_2023.
Fig. 6
Fig. 6. CRISPRi knockdown of mptA induces morphological and growth defects in M. tuberculosis.
a Growth delay of M. tuberculosis mptA KD induced with ATC (red square) compared to the uninduced condition (black circle), measured using optical density at 600 nm. The cells were sub-cultured twice with continuous exposure to 100 ng/mL ATC. The first sub-culture (2° culture) was sub-cultured into fresh medium (1:50 dilution) on day 12 (arrow) and incubated for an additional seven days (3° culture). Averages of biological triplicates with error bars representing standard errors of the mean are shown. Statistical significance of growth differences between -ATC and +ATC conditions were determined using the one-tailed student’s T-test. b Anti-MptA immunoblot of M. tuberculosis cell lysates prepared from mptA KD (-/ + ATC) at the end of the second subcultures (3°). *, a non-specific protein, showing equal loading of two samples. Blot is representative of two independent experiments with similar results. c SDS-PAGE of lipoglycans extracted from M. tuberculosis mptA KD second subcultures (3°) with and without ATC, visualized by glycan staining. Gel is representative of two independent experiments with similar results. d Phase contrast micrographs and cell width profiles for M. tuberculosis mptA KD at the end of the first (2°) and second (3°) sub-cultures with and without ATC. Cell width profiles were graphed as described in Fig. 2. “p” and “m” indicate cell poles and mid-cell, respectively. e, f Boxplots comparing the distribution of maximum cell widths (e) and cell lengths (f) between M. tuberculosis mptA KD at the end of the first (2°) and second (3°) sub-cultures with and without ATC. The boxplots are drawn as described in Fig. 1. Statistical significance was determined by one-way ANOVA and Tukey post-hoc test. n = 86, 98, 100, 100 cells for mptA KD - ATC 2°, mptA KD + ATC 2°, mptA KD - ATC 3°, mptA KD + ATC 3°, respectively, in panel e. n = 86, 98, 102, 165 cells for mptA KD - ATC 2°, mptA KD + ATC 2°, mptA KD - ATC 3°, mptA KD + ATC 3°, respectively, in panel f. Source data for each sub-panel are provided in the Source Data file. Microscopy image data for panels df are available at https://github.com/IanLairdSparks/Sparks_2023.

Update of

Similar articles

Cited by

References

    1. Rahlwes KC, Sparks IL, Morita YS. Cell walls and membranes of Actinobacteria. Subcell. Biochem. 2019;92:417–469. doi: 10.1007/978-3-030-18768-2_13. - DOI - PubMed
    1. Batt SM, Minnikin DE, Besra GS. The thick waxy coat of mycobacteria, a protective layer against antibiotics and the host’s immune system. Biochem J. 2020;477:1983–2006. doi: 10.1042/BCJ20200194. - DOI - PMC - PubMed
    1. Dulberger CL, Rubin EJ, Boutte CC. The mycobacterial cell envelope - a moving target. Nat. Rev. Microbiol. 2020;18:47–59. doi: 10.1038/s41579-019-0273-7. - DOI - PubMed
    1. Thanky NR, Young DB, Robertson BD. Unusual features of the cell cycle in mycobacteria: polar-restricted growth and the snapping-model of cell division. Tuberculosis (Edinb.) 2007;87:231–236. doi: 10.1016/j.tube.2006.10.004. - DOI - PubMed
    1. Aldridge BB, et al. Asymmetry and aging of mycobacterial cells lead to variable growth and antibiotic susceptibility. Science. 2012;335:100–104. doi: 10.1126/science.1216166. - DOI - PMC - PubMed

MeSH terms