. 2024 Mar 11;14(1):5885.
doi: 10.1038/s41598-024-55438-2.

Digital pathology with artificial intelligence analysis provides insight to the efficacy of anti-fibrotic compounds in human 3D MASH model

Affiliations

Digital pathology with artificial intelligence analysis provides insight to the efficacy of anti-fibrotic compounds in human 3D MASH model

Radina Kostadinova et al. Sci Rep. .

Abstract

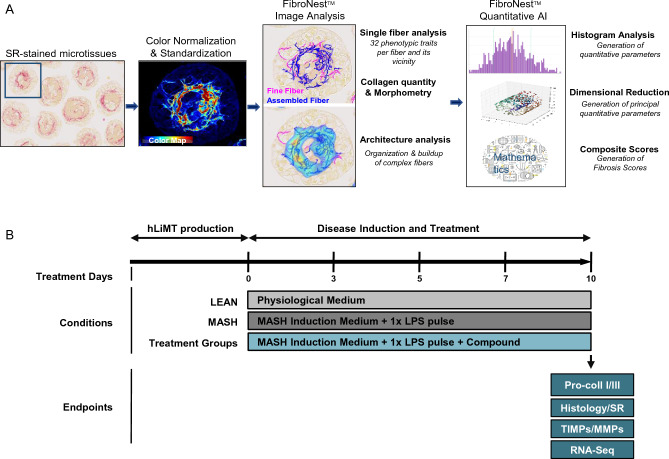
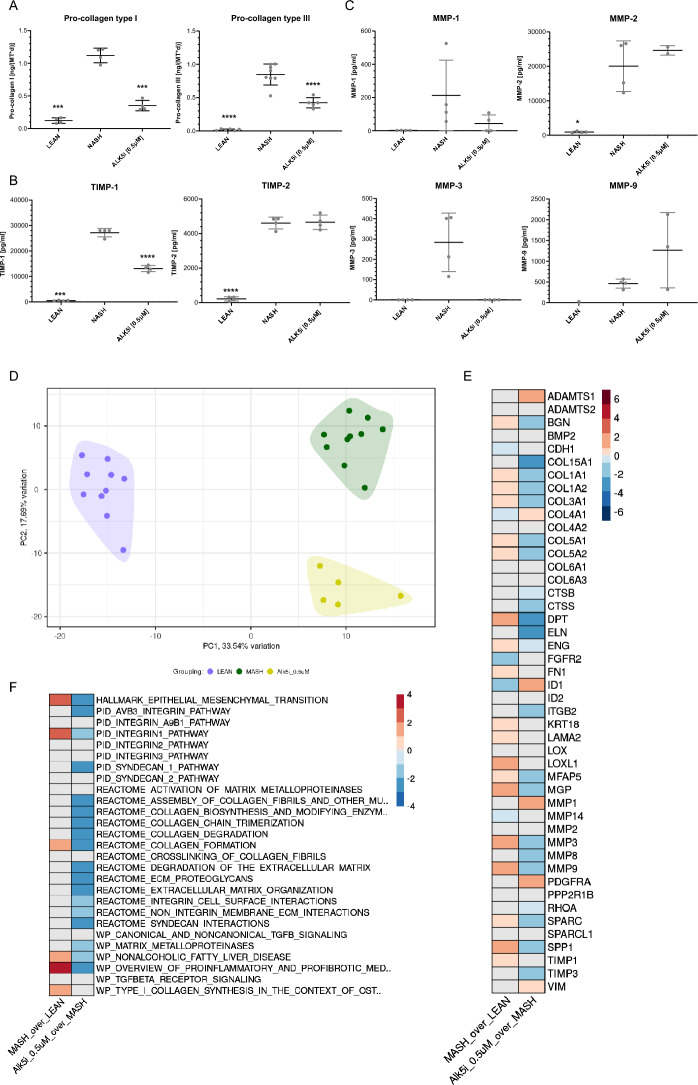
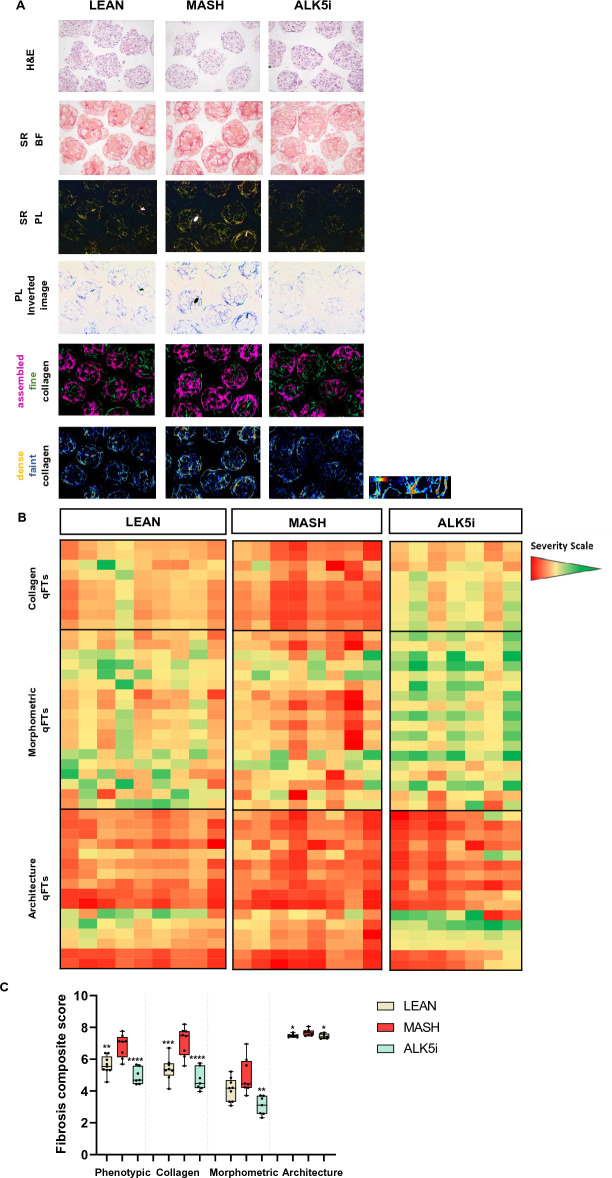
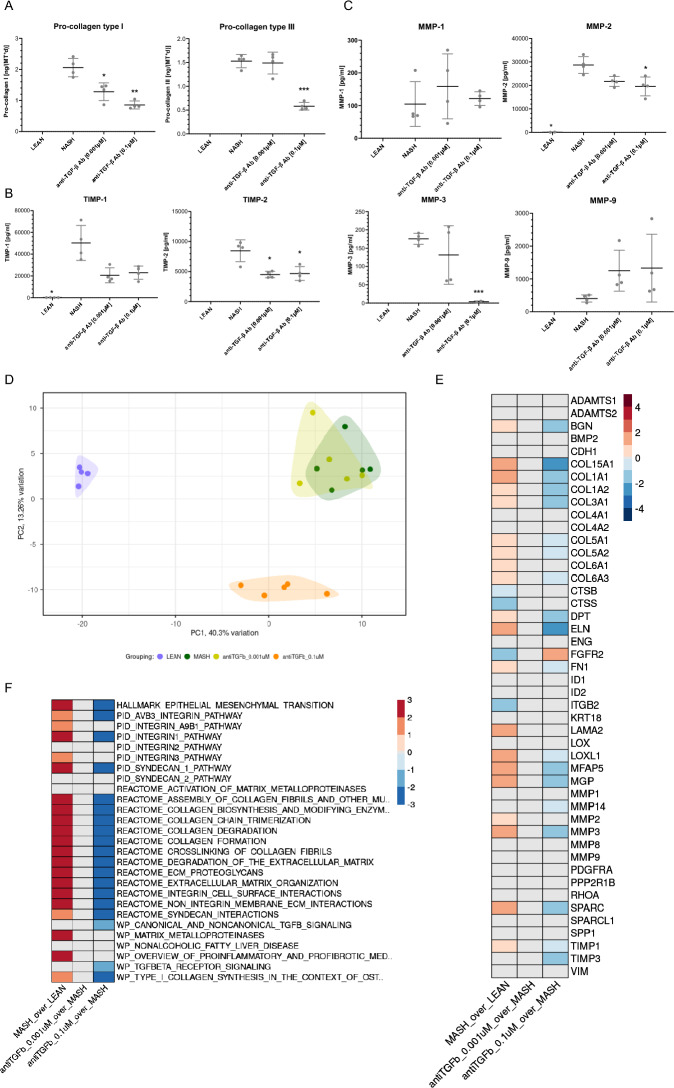
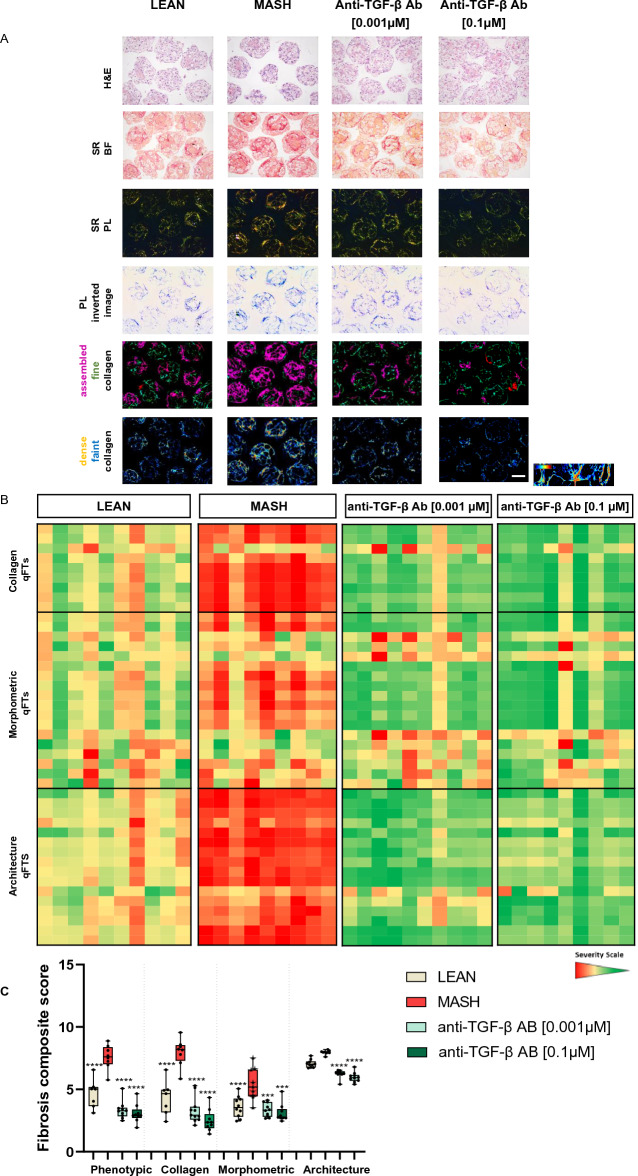
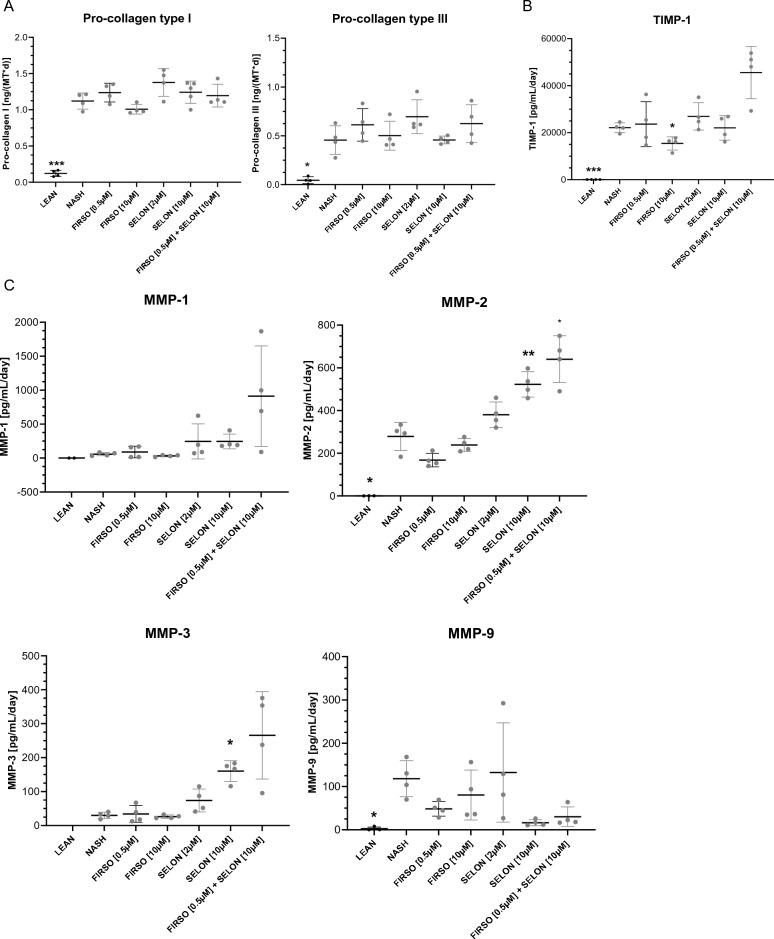
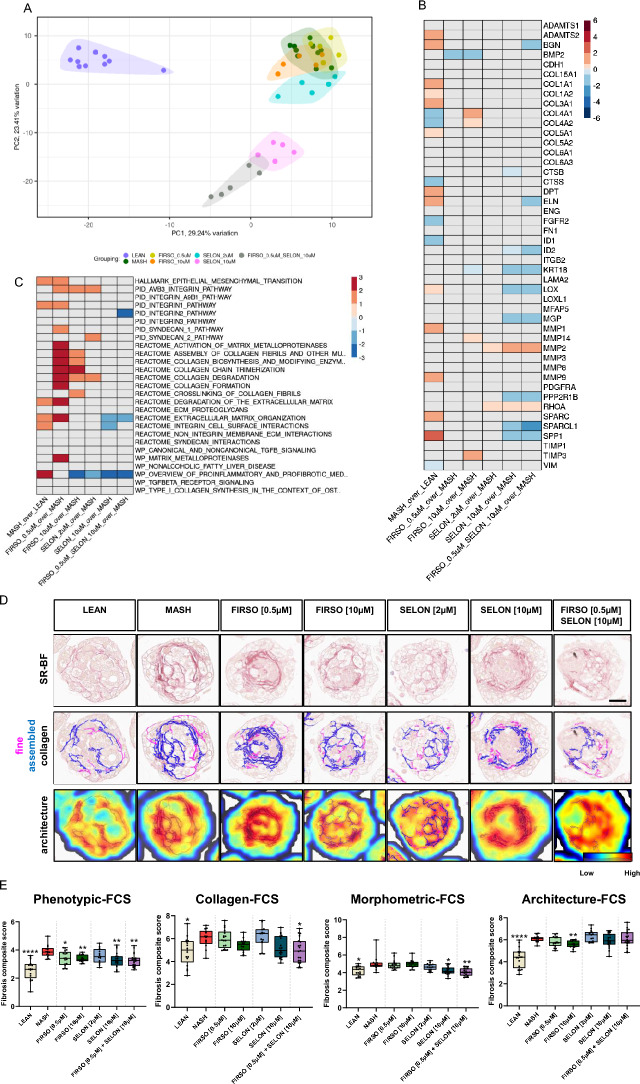
Metabolic dysfunction-associated steatohepatitis (MASH) is a severe liver disease characterized by lipid accumulation, inflammation and fibrosis. The development of MASH therapies has been hindered by the lack of human translational models and limitations of analysis techniques for fibrosis. The MASH three-dimensional (3D) InSight™ human liver microtissue (hLiMT) model recapitulates pathophysiological features of the disease. We established an algorithm for automated phenotypic quantification of fibrosis of Sirius Red stained histology sections of MASH hLiMTs model using a digital pathology quantitative single-fiber artificial intelligence (AI) FibroNest™ image analysis platform. The FibroNest™ algorithm for MASH hLiMTs was validated using anti-fibrotic reference compounds with different therapeutic modalities-ALK5i and anti-TGF-β antibody. The phenotypic quantification of fibrosis demonstrated that both reference compounds decreased the deposition of fibrillated collagens in alignment with effects on the secretion of pro-collagen type I/III, tissue inhibitor of metalloproteinase-1 and matrix metalloproteinase-3 and pro-fibrotic gene expression. In contrast, clinical compounds, Firsocostat and Selonsertib, alone and in combination showed strong anti-fibrotic effects on the deposition of collagen fibers, however less pronounced on the secretion of pro-fibrotic biomarkers. In summary, the phenotypic quantification of fibrosis of MASH hLiMTs combined with secretion of pro-fibrotic biomarkers and transcriptomics represents a promising drug discovery tool for assessing anti-fibrotic compounds.


Conflict of interest statement

All the authors at the time of the contribution are employed by InSphero AG and PharmaNest and have no conflict of interest to declare.

Figures

Figure 1
Figure 1
Overview of FibroNest™ platform workflow for fibrosis quantification and MASH induction method. (A) FibroNest™ quantitative image analysis workflow and method. (B) Scheme for MASH induction in hLiMTs. Disease induction and treatment start at day 0 after the production of the hLiMTs. The three treatment conditions are: LEAN, MASH and MASH in the presence of test compounds. After each medium exchange on days 0, 3, 5 and 7, the compounds and vehicle controls (DMSO or PBS) were applied. FFAs supplementation occurred on each treatment day, while stimulation with LPS took place only once during the 10-day treatment period. Cell culture supernatants and/or microtissues were collected on days 5, 7 and 10. All the end points related to pro-collagen type I/III (pro-coll I/III), Histology/SR, TIMPs/matrix metalloproteinases (MMPs) and RNA sequencing (RNA-Seq) were performed on day 10. All conditions were normalized to 0.2% DMSO or PBS.
Figure 2
Figure 2
ALK5i treatment leads to decreased fibrosis in MASH hLiMTs. (A) Pro-collagen type I and pro-collagen type III, (B) TIMP-1 and TIMP-2 and (C) MMP-1, MMP-2, MMP-3 and MMP-9 in LEAN, MASH and MASH treated with 0.5 µM ALK5i hLiMTs on day 10. Mean ± SD, n = 4 microtissues/group, except for pro-collagen type III, where n = 6 microtissues/group were used. The data points below the lowest standard value were excluded from the data set. *p ≤ 0.05 (one-way ANOVA (analysis of variance), Welch's correction) MASH vs MASH + ALK5i. (D) Principal component analysis (PCA) plot presenting intervention wise grouping of LEAN, MASH and MASH treated with 0.5 µM ALK5i hLiMTs on day 10. (E) Summary heatmap presenting differential expression analysis (DEA) results on day 10 for the selected genes related to fibrosis (Supplementary table 4) in MASH compared to LEAN controls (left column) and in MASH treated with 0.5 µM ALK5i compared to MASH counterparts (right column) hLiMTs. Color scale represents Log2FC values derived from DEA (Wald test, Benjamini–Hochberg correction). Log2FC values associated with false discovery rate (FDR) > 0.01 were overwritten with zero and are depicted in grey. Color scale range was determined based on the spread of the log2FC values for all genes investigated in the study. (F) Summary heatmap presenting gene set enrichment analysis (GSEA) results on day 10 for the selected gene sets related to fibrosis (Supplementary table 5) in MASH compared to LEAN controls (left column) and in MASH treated with 0.5 µM ALK5i compared to MASH counterparts (right column) hLiMTs. Color scale represents normalized enrichment score (NES) values derived from GSEA (Kolmogorov–Smirnov-like statistic + permutation test, Benjamini–Hochberg correction). NES values associated with FDR > 0.05 were overwritten with zero and are depicted in grey. Color scale range was determined based on the spread of the NES values for all gene sets investigated in the study.
Figure 3
Figure 3
ALK5i treatment decreases the deposition of fibrillated collagens in MASH hLiMTs. (A) H&E and SR staining of deposited fibrillated collagens (SR-BF and SR-PL images) and their quantification by FibroNest™ II platform of LEAN, MASH and MASH treated with 0.5 µM ALK5i hLiMTs on day 10. Green is fine collagen; purple is assembled collagen and denotes the highly reticulated collagen; dark yellow and red indicate dense collagen and blue indicates faint collagen. The images were taken with 10 × magnification, scale bar: 100 µm. (B) Heatmap of the extent of fibrosis severity, ranging from green: faint collagen to red: dense collagen. Every column represents a hLiMT sample, and every row represents a different quantitative fibrosis traits (qFTs) that constitute the collagen, morphometric and architecture sub-phenotypes. (C) Ph-FCS, collagen-FCS, morphometric-FCS and architecture-FCS generated by 43 qFTs (Supplementary Table 1). Mean ± SD, n ≥ 7 microtissues/group, *p ≤ 0.05, **p ≤ 0.01, ***p ≤ 0.001, ****p ≤ 0.0001, (one-way ANOVA, Welch's correction), MASH vs LEAN or compound treatment.
Figure 4
Figure 4
Anti-TGF-β Ab treatment leads to decreased fibrosis in MASH hLiMTs. (A) Pro-collagen type I and pro-collagen type III, (B) TIMP-1 and TIMP-2, (C) MMP-1, MMP-2, MMP-3 and MMP-9 in LEAN, MASH and MASH treated with 0.001 µM and 0.1 µM anti-TGF-β Ab hLiMTs on day 10. Mean ± SD, n = 4 microtissues/group, data points below the lowest standard value were excluded from the data set. *p ≤ 0.05 (one-way ANOVA, Welch's correction, MASH vs LEAN and compound treatment. (D) PCA plot presenting intervention wise-grouping of LEAN, MASH and MASH treated with anti-TGF-β Ab (0.001 µM and 0.1 µM) hLiMTs on day 10. (E) Summary heatmap presenting DEA results on day 10 for the selected genes related to fibrosis (Supplementary Table 4) in MASH hLiMTs compared to LEAN controls (column 1) and in MASH hLiMTs treated with anti-TGF-β Ab (0.001 µM and 0.1 µM) compared to MASH counterparts (column 2 and 3). Color scale represents Log2FC values derived from DEA (Wald test, Benjamini–Hochberg correction). Log2FC values associated with FDR > 0.01 were overwritten with zero and are depicted in grey. Color scale range was determined based on the spread of the log2FC values for all genes investigated in the study. (F) Summary heatmap presenting GSEA results on day 10 for the selected gene sets related to fibrosis (Supplementary table 5) in MASH hLiMTs compared to LEAN controls (column 1) and in MASH hLiMTs treated with anti-TGF-β Ab (0.001 µM and 0.1 µM) compared to MASH counterparts (column 2 and 3). Color scale represents NES values derived from GSEA (Kolmogorov–Smirnov-like statistic + permutation test, Benjamini–Hochberg correction). NES values associated with FDR > 0.05 were overwritten with zero and are depicted in grey. Color scale range was determined based on the spread of the NES values for all gene sets investigated in the study.
Figure 5
Figure 5
Anti-TGF-β Ab treatment decreases the deposition of fibrillated collagens in MASH hLiMTs. (A) H&E and SR staining of deposited fibrillated collagens (SR-BF and SR-PL images) and their quantification by FibroNest™ II platform of LEAN, MASH and MASH treated with 0.001 µM or 0.1 µM anti-TGF-β Ab hLiMTs on day 10. Green and purple are fine and assembled collagen, respectively. Blue and yellow/red are faint and dense collagen, respectively. The images are taken with 10 × magnification, scale bar: 100 µm. (B) Heatmap of the extent of fibrosis severity, ranging from green: faint and fine collagen to red: dense and complex collagen. Every column represents a hLiMT sample, and every row is a different quantitative fibrosis traits (qFTs) that contribute to the collagen, morphometric and architecture sub-phenotypes. (C) Ph-FCS, collagen-FCS, morphometric-FCS and architecture-FCS generated by 43 qFTs (Supplementary table 2). Mean ± SD, n ≥ 8 microtissues/group, *p ≤ 0.05, **p ≤ 0.01, ***p ≤ 0.001, ****p ≤ 0.0001, (one-way ANOVA, Welch's correction), MASH vs LEAN or compound treatment.
Figure 6
Figure 6
Firsocostat and Selonsertib change the secretion of pro-fibrotic markers. (A) Pro-collagen type I and pro-collagen type III (B) TIMP-1, (C) MMP-1, MMP-2, MMP-3 and MMP-9 in LEAN, MASH and MASH treated with 0.5 µM and 10 µM Firsocostat (FIRSO), 2 µM and 10 µM Selonsertib (SELON), 0.5 μM FIRSO with 10 μM SELON hLiMTs on day 10. Mean ± SD, n = 4 microtissues/group, data points below the lowest standard value were excluded from the data set. *p ≤ 0.05, **p ≤ 0.01, ***p ≤ 0.001, ****p ≤ 0.0001, (one-way ANOVA, Welch's correction), MASH vs LEAN or compound treatment.
Figure 7
Figure 7
Firsocostat and Selonsertib decrease the fibrotic gene expression levels and the deposition of the fibrillated collagens. (A) PCA plot presenting intervention-wise-grouping of LEAN, MASH and MASH treated with FIRSO, SELON and FIRSO with SELON hLiMTs on day 10. (B) Summary heatmap presenting DEA results on day 10 for the selected genes related to fibrosis (Supplementary table 4) in MASH hLiMTs compared to LEAN controls (column 1) and in MASH hLiMTs treated with FIRSO, SELON and FIRSO with SELON compared to MASH counterparts (column 2–6). Color scale represents Log2FC values derived from DEA (Wald test, Benjamini–Hochberg correction). Log2FC values associated with FDR > 0.01 were overwritten with zero and are depicted in grey. Color scale range was determined based on the spread of the log2FC values for all genes investigated in the study. (C) Summary heatmap presenting GSEA results on day 10 for the selected gene sets related to fibrosis (Supplementary table 5) in MASH hLiMTs compared to LEAN controls (column 1) and in MASH hLiMTs treated with FIRSO, SELON and FIRSO with SELON compared to MASH counterparts (column 2–6). Color scale represents NES values derived from GSEA (Kolmogorov–Smirnov-like statistic + permutation test, Benjamini–Hochberg correction). NES values associated with FDR > 0.05 were overwritten with zero and are depicted in grey. Color scale range was determined based on the spread of the NES values for all gene sets investigated in the study. (D) SR-BF images and their quantification by FibroNest™ III image platform of LEAN, MASH and MASH treated with FIRSO, SELON and FIRSO with SELON hLiMTs on day 10. Purple is fine collagen fibers and blue is assembled and highly reticulated collagen fibers. The scan images are taken with 40 × magnification, scale bar: 50 µm. (E) Ph-FCS, collagen-FCS, morphometric-FCS and architecture-FCS generated by 206 qFTs. Mean ± SD, n ≥ 11 microtissues/group, *p ≤ 0.05, **p ≤ 0.01, ****p ≤ 0.0001, (one-way ANOVA, Welch's correction), MASH vs LEAN or compound treatment.

Similar articles

Cited by

References

    1. Fraile JM, Palliyil S, Barelle C, Porter AJ, Kovaleva M. Non-alcoholic steatohepatitis (NASH)—A review of a crowded clinical landscape, driven by a complex disease. Drug Des. Devel. Ther. 2021;15:3997–4009. doi: 10.2147/DDDT.S315724. - DOI - PMC - PubMed
    1. Tilg H, Moschen AR. Evolution of inflammation in nonalcoholic fatty liver disease: The multiple parallel hits hypothesis. Hepatology. 2010;52(5):1836–1846. doi: 10.1002/hep.24001. - DOI - PubMed
    1. Cho HJ, et al. Bioengineered multicellular liver microtissues for modeling advanced hepatic fibrosis driven through non-alcoholic fatty liver disease. Small. 2021;17(14):e2007425. doi: 10.1002/smll.202007425. - DOI - PMC - PubMed
    1. Marchesini G, Marzocchi R. Metabolic syndrome and NASH. Clin. Liver Dis. 2007;11(1):105–117. doi: 10.1016/j.cld.2007.02.013. - DOI - PubMed
    1. Kovalic AJ, Banerjee P, Tran QT, Singal AK, Satapathy SK. Genetic and epigenetic culprits in the pathogenesis of nonalcoholic fatty liver disease. J. Clin. Exp. Hepatol. 2018;8(4):390–402. doi: 10.1016/j.jceh.2018.04.001. - DOI - PMC - PubMed