. 2024 Mar 12;14(1):5952.
doi: 10.1038/s41598-024-56319-4.

Application of machine learning algorithms for accurate determination of bilirubin level on in vitro engineered tissue phantom images

Affiliations

Application of machine learning algorithms for accurate determination of bilirubin level on in vitro engineered tissue phantom images

Yijia Yuan et al. Sci Rep. .

Abstract

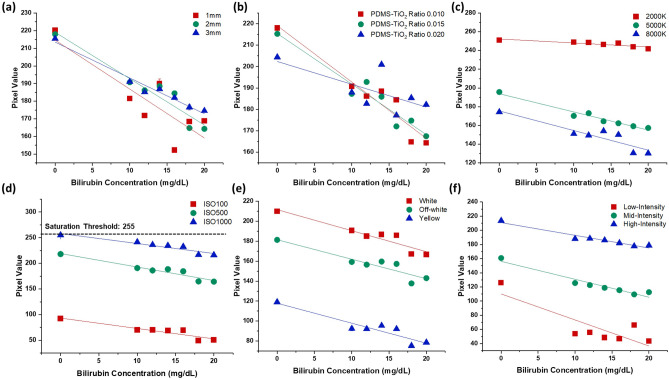
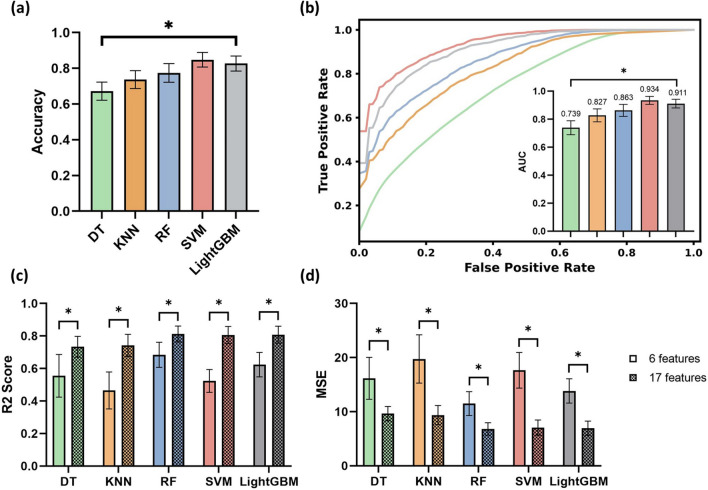
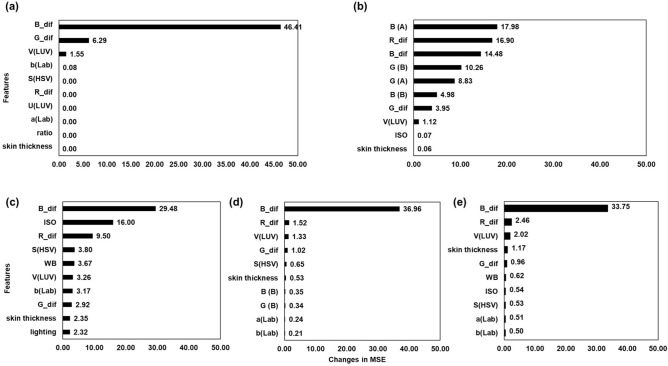
Neonatal Jaundice is a common occurrence in neonates. High excess bilirubin would lead to hyperbilirubinemia, leading to irreversible adverse damage such as kernicterus. Therefore, it is necessary and important to monitor neonates' bilirubin levels in real-time for immediate intervention. However, current screening protocols have their inherent limitations, necessitating more convenient measurements. In this proof-of-concept study, we evaluated the feasibility of using machine learning for the screening of hyperbilirubinemia in neonates from smartphone-acquired photographs. Different machine learning models were compared and evaluated to gain a better understanding of feature selection and model performance in bilirubin determination. An in vitro study was conducted with a bilirubin-containing tissue phantom to identify potential biological and environmental confounding factors. The findings of this study present a systematic characterization of the confounding effect of various factors through separate parametric tests. These tests uncover potential techniques in image pre-processing, highlighting important biological features (light scattering property and skin thickness) and external features (ISO, lighting conditions and white balance), which together contribute to robust model approaches for accurately determining bilirubin concentrations. By obtaining an accuracy of 0.848 in classification and 0.812 in regression, these findings indicate strong potential in aiding in the design of clinical studies using patient-derived images.


Conflict of interest statement

The authors declare no competing interests.

Figures

Figure 1
Figure 1
Spectral characterization of bilirubin solutions with different concentrations. (a) Spectral characterization of bilirubin solution at different days. Red curve represents the freshly made bilirubin. A peak shift towards left has been observed for stored bilirubin due to conversion of bilirubin to biliverdin. (b) Scatter plot of absorbance of bilirubin solution in different colour wavelengths; Statistical differences (P < 0.01) in both correlation and sensitivity were observed among all three wavelengths.
Figure 2
Figure 2
Parametric study of important biological and external features. (a) Scatter plot of the pixel value of bilirubin concentrations in PMDS-TiO2 tissue phantom samples with different thicknesses; A statistically significant difference (P < 0.05 in 1 mm, P < 0.001 in 2 mm and P < 0.001 in 3 mm) was observed in the sensitivity slope but not in correlation among different thicknesses. (b) Scatter plot of the pixel value of bilirubin concentrations in samples with different light scattering ratios (PDMS to TiO2 ratio); Significant statistical difference was observed in both correlation and sensitivity between 0.01 and 0.02 PDMS-TiO2 ratio (P < 0.005), as well as between 0.015 and 0.02 PDMS-TiO2 ratio (P < 0.005). (c) Scatter plot of the pixel value of bilirubin concentrations in samples with different WB. Significant statistical difference was observed in both correlation and sensitivity among 2000 K (P < 0.05), 5000 K (P < 0.005) and 8000 K (P < 0.01). (d) Scatter plot of the pixel value of bilirubin concentrations in samples with different ISOs; ISO200 and ISO500 (P < 0.05), ISO200 and ISO700 (P < 0.05), as well as ISO500 and ISO700 (P < 0.05) datasets are statistically different from each other in correlation. At the 0.05 significance level, a significant statistical difference was also observed in sensitivity between the ISO200 and ISO500 datasets (P < 0.05), as well as between the ISO200 and ISO700 datasets (P < 0.05). (e) Scatter plot of the pixel value of bilirubin concentrations in samples with different illumination tones; A significant statistical difference was observed in correlation among all channels (P < 0.05). (f) Scatter plot of the pixel value of bilirubin concentrations in sample images with different light intensities; Different light intensities have demonstrated a considerable statistical significance in both sensitivity and correlation (P < 0.05).
Figure 3
Figure 3
Linear regression and evaluation of important feature channels from colour spaces—RGB, CMYK, L*a*b*, HSV, YCbCr and LUV. (a) Scatter plot of pixel values of bilirubin concentrations of PDMS-TiO2 tissue phantom samples in the RGB channels respectively; Significant statistical difference in correlation was observed between the B and R channel (P < 0.05), as well as between the B and G channel (P < 0.005). (b) Scatter plot of pixel values of bilirubin concentrations of samples in the CMY(K) channels respectively; A significant statistical difference in both correlation and sensitivity was observed among all channels (P < 0.05). (c) Scatter plot of pixel values of bilirubin concentrations of samples in the CIELAB channels respectively. A statistically significant correlation (P < 0.05) was observed in correlation among all channels. Sensitivity also demonstrated a significant statistical difference between the L channel and the a* channel, as well as between the L channel and the b* channel (P < 0.05). (d) Scatter plot of pixel values of bilirubin concentrations of samples in the HSV channels respectively. A significant statistical difference in both sensitivity and correlation was observed among all channels (P < 0.05). (e) Scatter plot of pixel values of bilirubin concentrations of samples in the YCbCr channels respectively. A significant statistical difference (P < 0.05) was observed in both correlation and sensitivity among all different channels. (f) Scatter plot of pixel values of bilirubin concentrations of samples in the LUV channels respectively. A significant statistical difference (P < 0.05) was observed in both correlation and sensitivity among all different channels.
Figure 4
Figure 4
Model performances. (a) Accuracy performance among DT, KNN, RF, SVM and LightGBM models in the classification task; A significant statistical difference in accuracy was observed among models (P < 0.05). All models demonstrated a significant statistical difference in pairwise comparison except for the comparison between SVM and LightGBM model (P > 0.05). (b) ROC performance of the five different models. The inlet graph shows the AUC performance, which represents the capability of the model to distinguish between the tissue phantom images with normal bilirubin levels and those images with abnormal bilirubin concentrations. The AUC demonstrated a significant statistical difference among all models (P < 0.05). (c) R2 value among different models in the regression task with a different number of features as training labels. A significant statistical difference (P < 0.05) was observed in R2 between 6 and 17 features among all models. Five models are statistically different from each other except the RF, SVM and LightGBM in pairwise comparison. (d) MSE value among different models in the regression task with a different number of features as training labels. A significant statistical difference (P < 0.05) was observed in MSE between 6 and 17 features among all models. Asterisk (*) indicates P < 0.05.
Figure 5
Figure 5
Top 10 important features in different models. (a) Top 10 features in the DT model. The difference in the blue channel pixel value between the two ROI regions outperformed other features in the DT model. (b) Top 10 features in the KNN model. The ROI blue channel pixel value demonstrated the highest importance. (c) Top 10 features in the SVR model. The difference in the blue channel pixel value also showed the highest importance. (d) Top 10 features in the RF. A similar observation of the most determining feature was observed. (e) Top 10 features in the LightGBM. The difference in the blue channel pixel value between the two ROI regions was the highest determining factor of the model performance in the LightGBM model.
Figure 6
Figure 6
Overall PDMS tissue phantom image collection overview. (a) Preparation procedures of bilirubin solutions with different concentrations via serial dilution. (b) PDMS-TiO2 tissue phantom design to mimic the bilirubin deposition on the skin tissue in humans. (c) Fabricated PDMS-TiO2 tissue phantom samples and corresponding PDMS-TiO2 tissue phantom image collection environment set-up.
Figure 7
Figure 7
Graphical summary of data extraction process. (Left to right) Images are first obtained using a mobile phone camera and WB-corrected. Two regions of interest (ROI)—(A) bilirubin-containing and (B) bilirubin-free regions—are then isolated from the images of the tissue phantom. From these, 11 colour space features are derived and tabulated with 6 parameter features and used as inputs for the ML models.

Similar articles

Cited by

References

    1. Ullah S, Rahman K, Hedayati M. Hyperbilirubinemia in neonates: Types, causes, clinical examinations, preventive measures and treatments: A narrative review article. Iran. J. Public Health. 2016;45:558–568. - PMC - PubMed
    1. Frank JE. Diagnosis and management of G6PD deficiency. Am. Fam. Phys. 2005;72:1277–1282. - PubMed
    1. El-Beshbishi SN, Shattuck KE, Mohammad AA, Petersen JR. Hyperbilirubinemia and transcutaneous bilirubinometry. Clin. Chem. 2009;55:1280–1287. doi: 10.1373/clinchem.2008.121889. - DOI - PubMed
    1. Muchowski KE. Evaluation and treatment of neonatal hyperbilirubinemia. Am Fam Phys. 2014;89:873–878. - PubMed
    1. Maisels MJ, et al. Hyperbilirubinemia in the newborn infant≥ 35 weeks’ gestation: an update with clarifications. Pediatrics. 2009;124:1193–1198. doi: 10.1542/peds.2009-0329. - DOI - PubMed