

Sociobiome - Individual and neighborhood socioeconomic status influence the gut microbiome in a multi-ethnic population in the US
- PMID: 38467678
- PMCID: PMC10928180
- DOI: 10.1038/s41522-024-00491-y
Sociobiome - Individual and neighborhood socioeconomic status influence the gut microbiome in a multi-ethnic population in the US
Abstract
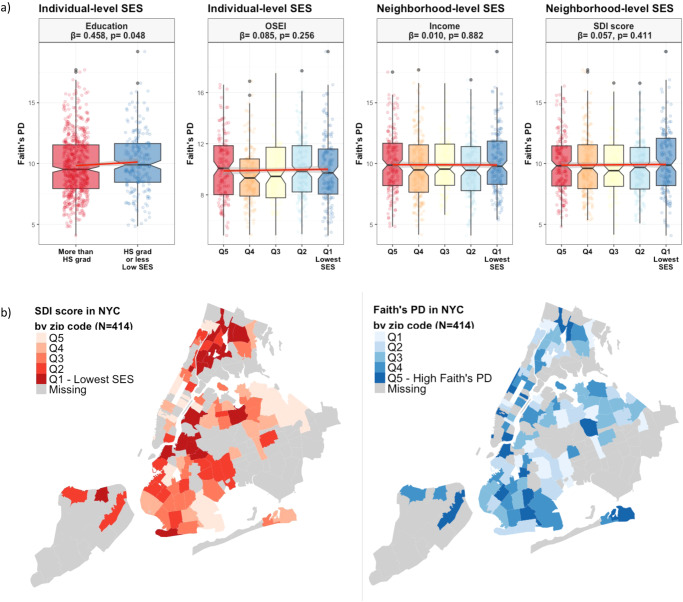
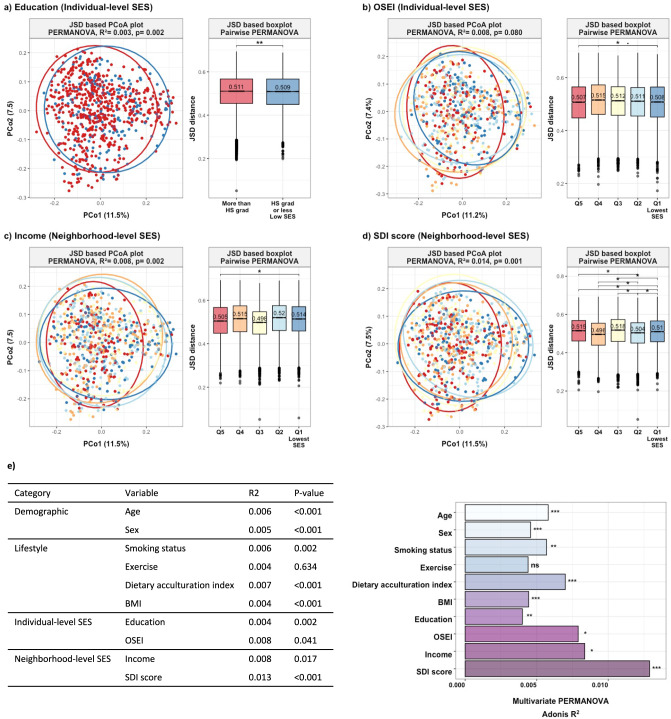
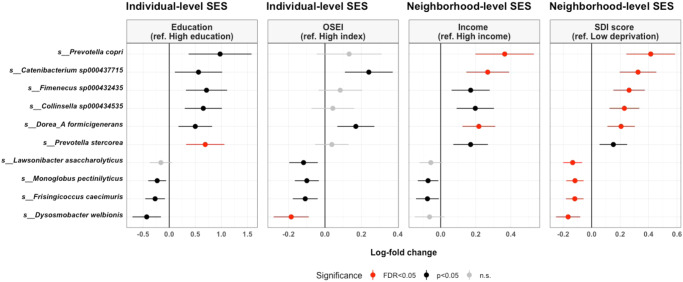
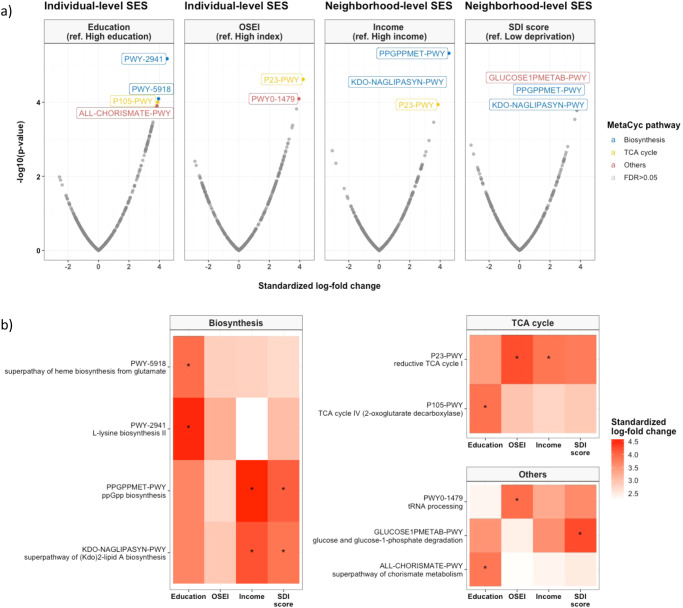
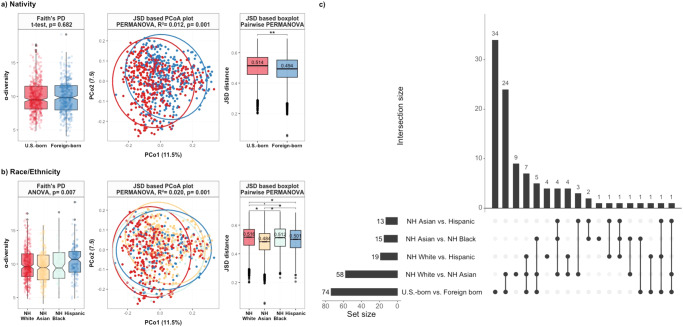
Lower socioeconomic status (SES) is related to increased incidence and mortality due to chronic diseases in adults. Association between SES variables and gut microbiome variation has been observed in adults at the population level, suggesting that biological mechanisms may underlie the SES associations; however, there is a need for larger studies that consider individual- and neighborhood-level measures of SES in racially diverse populations. In 825 participants from a multi-ethnic cohort, we investigated how SES shapes the gut microbiome. We determined the relationship of a range of individual- and neighborhood-level SES indicators with the gut microbiome. Individual education level and occupation were self-reported by questionnaire. Geocoding was applied to link participants' addresses with neighborhood census tract socioeconomic indicators, including average income and social deprivation in the census tract. Gut microbiome was measured using 16SV4 region rRNA gene sequencing of stool samples. We compared α-diversity, β-diversity, and taxonomic and functional pathway abundance by SES. Lower SES was significantly associated with greater α-diversity and compositional differences among groups, as measured by β-diversity. Several taxa related to low SES were identified, especially an increasing abundance of Prevotella copri and Catenibacterium sp000437715, and decreasing abundance of Dysosmobacter welbionis in terms of their high log-fold change differences. In addition, nativity and race/ethnicity have emerged as ecosocial factors that also influence the gut microbiota. Together, these results showed that lower SES was strongly associated with compositional and taxonomic measures of the gut microbiome, and may contribute to shaping the gut microbiota.
© 2024. The Author(s).
Conflict of interest statement
The authors declare no competing interests.
Figures
Update of
-
Sociobiome - Individual and neighborhood socioeconomic status influence the gut microbiome in a multi-ethnic population in the US.Res Sq [Preprint]. 2023 Apr 19:rs.3.rs-2733916. doi: 10.21203/rs.3.rs-2733916/v1. Res Sq. 2023. Update in: NPJ Biofilms Microbiomes. 2024 Mar 11;10(1):19. doi: 10.1038/s41522-024-00491-y. PMID: 37131763 Free PMC article. Updated. Preprint.
Similar articles
-
Sociobiome - Individual and neighborhood socioeconomic status influence the gut microbiome in a multi-ethnic population in the US.Res Sq [Preprint]. 2023 Apr 19:rs.3.rs-2733916. doi: 10.21203/rs.3.rs-2733916/v1. Res Sq. 2023. Update in: NPJ Biofilms Microbiomes. 2024 Mar 11;10(1):19. doi: 10.1038/s41522-024-00491-y. PMID: 37131763 Free PMC article. Updated. Preprint.
-
Associations between Diet, the Gut Microbiome, and Short-Chain Fatty Acid Production among Older Caribbean Latino Adults.J Acad Nutr Diet. 2020 Dec;120(12):2047-2060.e6. doi: 10.1016/j.jand.2020.04.018. Epub 2020 Aug 12. J Acad Nutr Diet. 2020. PMID: 32798072
-
Socioeconomic Status and the Gut Microbiome: A TwinsUK Cohort Study.Microorganisms. 2019 Jan 11;7(1):17. doi: 10.3390/microorganisms7010017. Microorganisms. 2019. PMID: 30641975 Free PMC article.
-
Lower Neighborhood Socioeconomic Status Associated with Reduced Diversity of the Colonic Microbiota in Healthy Adults.PLoS One. 2016 Feb 9;11(2):e0148952. doi: 10.1371/journal.pone.0148952. eCollection 2016. PLoS One. 2016. PMID: 26859894 Free PMC article.
-
Neighborhood socioeconomic status is associated with low diversity gut microbiomes and multi-drug resistant microorganism colonization.NPJ Biofilms Microbiomes. 2023 Aug 28;9(1):61. doi: 10.1038/s41522-023-00430-3. NPJ Biofilms Microbiomes. 2023. PMID: 37640705 Free PMC article.
Cited by
-
Sociobiome signals by high income for increased mobile genetic elements in the gut microbiome of Chinese individuals.Front Microbiol. 2025 May 26;16:1596101. doi: 10.3389/fmicb.2025.1596101. eCollection 2025. Front Microbiol. 2025. PMID: 40491838 Free PMC article.
-
Gut Microbiota: Association with Fiber Intake, Ultra-Processed Food Consumption, Sex, Body Mass Index, and Socioeconomic Status in Medical Students.Nutrients. 2024 Dec 9;16(23):4241. doi: 10.3390/nu16234241. Nutrients. 2024. PMID: 39683634 Free PMC article.
-
Getting to the Heart of the Matter: Exploring the Intersection of Cardiovascular Disease, Sex and Race and How Exercise, and Gut Microbiota Influence these Relationships.Rev Cardiovasc Med. 2025 Feb 20;26(2):26430. doi: 10.31083/RCM26430. eCollection 2025 Feb. Rev Cardiovasc Med. 2025. PMID: 40026503 Free PMC article. Review.
-
The Legalome: Microbiology, Omics and Criminal Justice.Microb Biotechnol. 2025 Mar;18(3):e70129. doi: 10.1111/1751-7915.70129. Microb Biotechnol. 2025. PMID: 40072296 Free PMC article.
-
Analyzing human gut microbiome data from global populations: challenges and resources.Trends Microbiol. 2025 Jun 6:S0966-842X(25)00155-6. doi: 10.1016/j.tim.2025.05.008. Online ahead of print. Trends Microbiol. 2025. PMID: 40483188 Review.
References
MeSH terms
Grants and funding
LinkOut - more resources
Full Text Sources
