

Demographic, health, physical activity, and workplace factors are associated with lower healthy working life expectancy and life expectancy at age 50
- PMID: 38467680
- PMCID: PMC10928117
- DOI: 10.1038/s41598-024-53095-z
Demographic, health, physical activity, and workplace factors are associated with lower healthy working life expectancy and life expectancy at age 50
Abstract
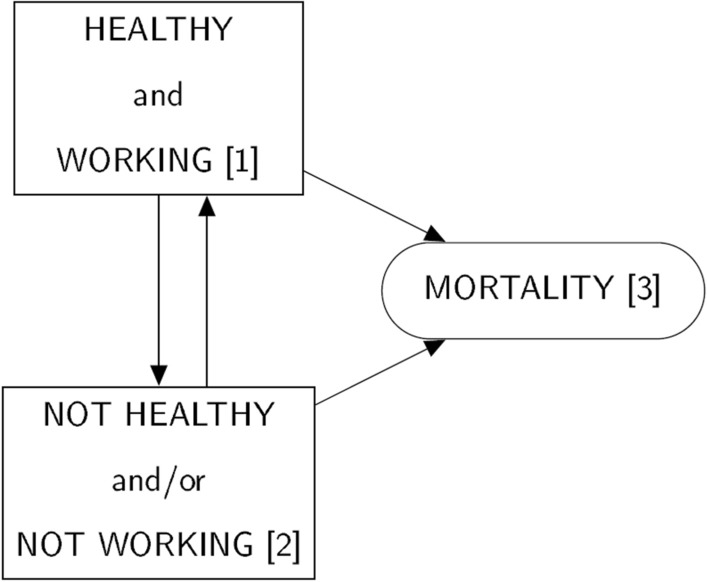
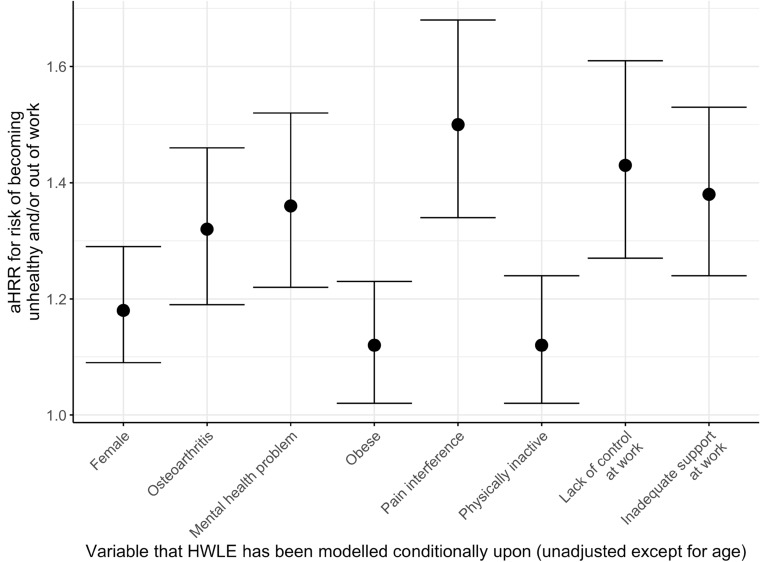
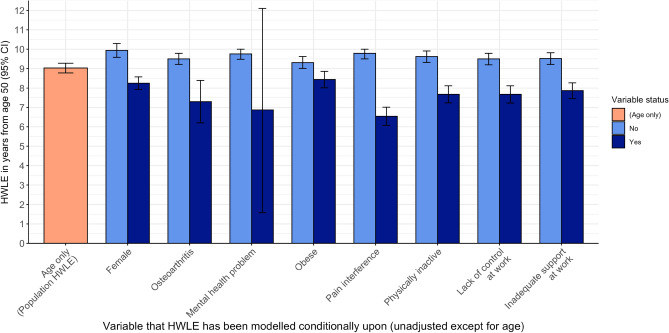
Although retirement ages are rising in the United Kingdom and other countries, the average number of years people in England can expect to spend both healthy and work from age 50 (Healthy Working Life Expectancy; HWLE) is less than the number of years to the State Pension age. This study aimed to estimate HWLE with the presence and absence of selected health, socio-demographic, physical activity, and workplace factors relevant to stakeholders focusing on improving work participation. Data from 11,540 adults in the English Longitudinal Study of Ageing were analysed using a continuous time 3-state multi-state model. Age-adjusted hazard rate ratios (aHRR) were estimated for transitions between health and work states associated with individual and combinations of health, socio-demographic, and workplace factors. HWLE from age 50 was 3.3 years fewer on average for people with pain interference (6.54 years with 95% confidence interval [6.07, 7.01]) compared to those without (9.79 [9.50, 10.08]). Osteoarthritis and mental health problems were associated with 2.2 and 2.9 fewer healthy working years respectively (HWLE for people without osteoarthritis: 9.50 years [9.22, 9.79]; HWLE with osteoarthritis: 7.29 years [6.20, 8.39]; HWLE without mental health problems: 9.76 years [9.48, 10.05]; HWLE with mental health problems: 6.87 years [1.58, 12.15]). Obesity and physical inactivity were associated with 0.9 and 2.0 fewer healthy working years respectively (HWLE without obesity: 9.31 years [9.01, 9.62]; HWLE with obesity: 8.44 years [8.02, 8.86]; HWLE without physical inactivity: 9.62 years [9.32, 9.91]; HWLE with physical inactivity: 7.67 years [7.23, 8.12]). Workers without autonomy at work or with inadequate support at work were expected to lose 1.8 and 1.7 years respectively in work with good health from age 50 (HWLE for workers with autonomy: 9.50 years [9.20, 9.79]; HWLE for workers lacking autonomy: 7.67 years [7.22, 8.12]; HWLE for workers with support: 9.52 years [9.22, 9.82]; HWLE for workers with inadequate support: 7.86 years [7.22, 8.12]). This study identified demographic, health, physical activity, and workplace factors associated with lower HWLE and life expectancy at age 50. Identifying the extent of the impact on healthy working life highlights these factors as targets and the potential to mitigate against premature work exit is encouraging to policy-makers seeking to extend working life as well as people with musculoskeletal and mental health conditions and their employers. The HWLE gaps suggest that interventions are needed to promote the health, wellbeing and work outcomes of subpopulations with long-term health conditions.
© 2024. The Author(s).
Conflict of interest statement
The authors declare no competing interests.
Figures
Similar articles
-
Healthy working life expectancy at age 50 for people with and without osteoarthritis in local and national English populations.Sci Rep. 2022 Feb 14;12(1):2408. doi: 10.1038/s41598-022-06490-3. Sci Rep. 2022. PMID: 35165378 Free PMC article.
-
Projections of healthy working life expectancy in England to the year 2035.Nat Aging. 2022 Jan;2(1):13-18. doi: 10.1038/s43587-021-00161-0. Epub 2022 Jan 20. Nat Aging. 2022. PMID: 37118357
-
Trends of healthy and unhealthy working life expectancy in Germany between 2001 and 2020 at ages 50 and 60: a question of educational level?J Epidemiol Community Health. 2023 Jul;77(7):430-439. doi: 10.1136/jech-2023-220345. Epub 2023 May 16. J Epidemiol Community Health. 2023. PMID: 37193584 Free PMC article.
-
Socioeconomic differences in working life expectancy: a scoping review.BMC Public Health. 2024 Mar 7;24(1):735. doi: 10.1186/s12889-024-18229-y. BMC Public Health. 2024. PMID: 38454363 Free PMC article.
-
Work hazards and workers' mental health: an investigation based on the fifth European Working Conditions Survey.Med Lav. 2019 Apr 19;110(2):115-129. doi: 10.23749/mdl.v110i2.7640. Med Lav. 2019. PMID: 30990473 Free PMC article. Review.
Cited by
-
Oestrogen replacement combined with resistance exercise in older women with knee osteoarthritis: a randomised, double-blind, placebo-controlled clinical trial.Age Ageing. 2025 Aug 1;54(8):afaf224. doi: 10.1093/ageing/afaf224. Age Ageing. 2025. PMID: 40794913 Free PMC article. Clinical Trial.
-
Mapping dynamic working life patterns and the impact of occupational exposures: a scoping review.BMC Public Health. 2025 Jul 3;25(1):2322. doi: 10.1186/s12889-025-23487-5. BMC Public Health. 2025. PMID: 40611048 Free PMC article.
-
Association of multimorbidity with working life expectancy among adults aged 50 years and older: Findings from two prospective cohort studies.J Multimorb Comorb. 2025 Apr 15;15:26335565251331187. doi: 10.1177/26335565251331187. eCollection 2025 Jan-Dec. J Multimorb Comorb. 2025. PMID: 40292303 Free PMC article.
References
-
- Department for Work and Pensions. State Pension Age Review: Final Report. https://www.gov.uk/government/publications/state-pension-age-review-fina... (2017).
-
- Black, C. Working for a Healthier Tomorrow: Dame Carol Black’s Review of the Health Of Britain’s Working Age Population (The Stationery Office, 2008).
-
- Waddell G, Kim Burton A. Is Work Good for Your Health and Well-being? Springer; 2006.
-
- Loisel P, Anema JR. Handbook of Work Disability. Springer; 2013.
-
- OECD. Pensions at a Glance 2023. 236. https://www.oecd-ilibrary.org/finance-and-investment/pensions-at-a-glanc... (2023).
MeSH terms
Grants and funding
LinkOut - more resources
Full Text Sources
Medical
