. 2024 Mar 11;14(1):5886.
doi: 10.1038/s41598-024-56428-0.

Single-cell RNA sequencing reveals critical modulators of extracellular matrix of penile cavernous cells in erectile dysfunction

Affiliations

Single-cell RNA sequencing reveals critical modulators of extracellular matrix of penile cavernous cells in erectile dysfunction

Chao Luo et al. Sci Rep. .

Abstract

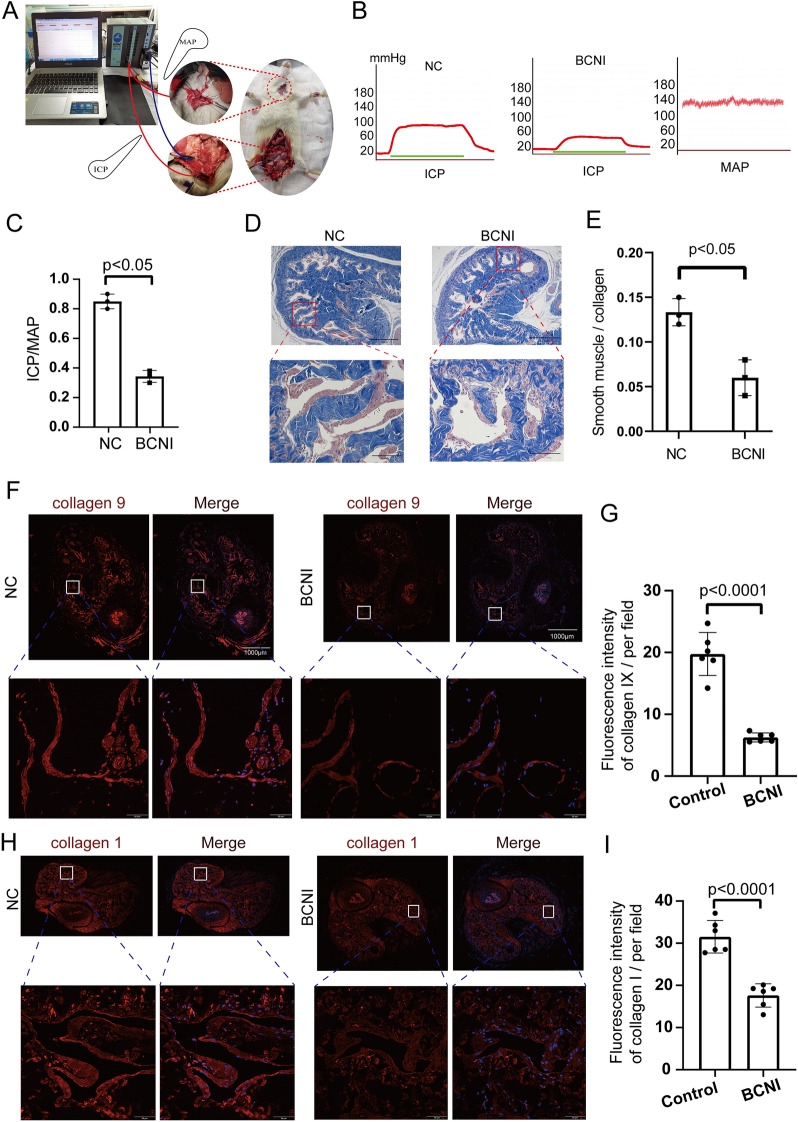
Erectile dysfunction (ED) is a common and difficult to treat disease, and has a high incidence rate worldwide. As a marker of vascular disease, ED usually occurs in cardiovascular disease, 2-5 years prior to cardiovascular disease events. The extracellular matrix (ECM) network plays a crucial role in maintaining cardiac homeostasis, not only by providing structural support, but also by promoting force transmission, and by transducing key signals to intracardiac cells. However, the relationship between ECM and ED remains unclear. To help fill this gap, we profiled single-cell RNA-seq (scRNA-seq) to obtain transcriptome maps of 82,554 cavernous single cells from ED and non-ED samples. Cellular composition of cavernous tissues was explored by uniform manifold approximation and projection. Pseudo-time cell trajectory combined with gene enrichment analysis were performed to unveil the molecular pathways of cell fate determination. The relationship between cavernous cells and the ECM, and the changes in related genes were elucidated. The CellChat identified ligand-receptor pairs (e.g., PTN-SDC2, PTN-NCL, and MDK-SDC2) among the major cell types in the cavernous tissue microenvironment. Differential analysis revealed that the cell type-specific transcriptomic changes in ED are related to ECM and extracellular structure organization, external encapsulating structure organization, and regulation of vasculature development. Trajectory analysis predicted the underlying target genes to modulate ECM (e.g., COL3A1, MDK, MMP2, and POSTN). Together, this study highlights potential cell-cell interactions and the main regulatory factors of ECM, and reveals that genes may represent potential marker features of ED progression.

Keywords: Erectile dysfunction; Extracellular matrix; Microenvironment; Modulator; Single-cell sequencing.


Conflict of interest statement

The authors declare no competing interests.

Figures

Figure 1
Figure 1
Schematic representation of the workflow used in this study.
Figure 2
Figure 2
ED progression differentially affects the cell-type composition of the corpus cavernosum. (A) UMAP plot showing nine well-converged datasets, with six ED samples and three non-ED samples, and (B) depicting the nine major cell types separating from the corpus cavernosum, including ECs, Schwann cells, FBs, SMCs, ECs lymphocytes, monocytes, neutrophils, T cells and regulated T cells. (C) Each cell type exists in a different proportion of cells in separate data collections. (D) Heatmap showing the top ten most enriched genes of each cell type, and GO analysing of these genes, the red cluster denotes FBs, the yellow denotes ECs, the light green denotes Schwann cells, the green denotes monocytes, and the aquamarine denotes neutrophils. (E) Expression levels of representative marker genes in different in FBs, ECs and SMCs.
Figure 3
Figure 3
The Disrupted Subpopulation Heterogeneity of fibroblast Contributes to ECM alteration in ED. (A) UMAP plots showing the distributions of FBs subpopulations (FBs1–FBs11) in ED and NC corpus cavernosum samples. (BD) The FBs subpopulation associated with the organization of ECM functions was reduced in ED. (B) UMAP plot showing the distribution of t he ED-associated FBs subpopulations. (C) Heatmap showing the expression levels of the top enriched genes in the ED-down-regulated FBs subpopulation (adjusted P < 0.05, log2 fold change ≥ 0.5). Down: down-regulated subpopulation; Up: up-regulated subpopulation. (D) GO pathway analysis of the transcriptomic signature of the ED-down-regulated FBs subpopulation. (E) The developmental trajectory of FBs in each cluster inferred by Monocle2, each point corresponds to a single cell. From left to right, representing different states, different times and different groups. (F) Heatmap showing that the differentially expressed genes (rows) along the pseudo-time (columns) is clustered hierarchically into four profiles. The representative gene functions and pathways of each profile were shown. (G) Dot plot represents the differential expression of ECM-related genes filtering from ECM organization pathways. (H) Veen graph intersected the down-regulated genes and ECM-related pathways-related genes. (I) The PPI network of ECM-related in FBs of the corpus cavernosum between ED and non-ED. (J) The scatter plot of gene expression of different types of cells along the pseudo-time trajectory of different hub genes.
Figure 4
Figure 4
The Disrupted Subpopulation Heterogeneity of smooth muscle cells Contributes to ECM alteration in ED. (A) UMAP plots showing the distributions of FBs subpopulations (SMCs1–SMCs9) in ED and NC corpus cavernosum samples. (BD) The SMCs subpopulation associated with the organization of ECM functions was reduced in ED. (B) UMAP plot showing the distribution of the ED-associated SMCs subpopulations. (C) Heatmap showing the expression levels of the top enriched genes in the ED-down-regulated FBs subpopulation (adjusted P < 0.05, log2 fold change ≥ 0.5). Down: down-regulated subpopulation; Up: up-regulated subpopulation. (D) GO pathway analysis of the transcriptomic signature of the ED-down-regulated SMCs subpopulation. (E) The developmental trajectory of SMCs in each cluster inferred by Monocle2, each point corresponds to a single cell. From left to right, representing different states, different times and different groups. (F) Heatmap showing that the differentially expressed genes (rows) along the pseudo-time (columns) is clustered hierarchically into four profiles. The representative gene functions and pathways of each profile were shown. (G) Dot plot represents the differential expression of ECM-related genes filtering from ECM organization pathways. (H) Venn diagram intersected the down-regulated genes and ECM-related pathways-related genes. (I) The PPI network of ECM-related genes in SMCs of the corpus cavernosum between ED and non-ED. (J) The scatter plot of gene expression of different types of cells along the pseudo-time trajectory of different hub genes.
Figure 5
Figure 5
The Disrupted Subpopulation Heterogeneity of endothelial cells Contributes to ECs alteration in ED. (A) UMAP plots showing the distributions of ECs subpopulations (ECs1–ECs12) in ED and NC corpus cavernosum samples. (BD) The ECs subpopulation associated with endothelial cell morphogenesis was reduced in ED. (B) UMAP plot showing the distribution of the ED-associated ECs subpopulations. (C) Heatmap showing the expression levels of the top enriched genes in the ED-down-regulated ECs subpopulation (adjusted P < 0.05, log2 fold change ≥ 0.5). Down: down-regulated subpopulation; Up: up-regulated subpopulation. (D) GO pathway analysis of the transcriptomic signature of the ED-down-regulated ECs subpopulation. (E) The PPI network of the top enriched genes. (F) The developmental trajectory of ECs in each cluster inferred by Monocle2, each point corresponds to a single cell. From left to right, representing different states, different times and different groups. (G) Heatmap showing that the differentially expressed genes (rows) along the pseudo-time (columns) is clustered hierarchically into four profiles. The representative gene functions and pathways of each profile were shown.
Figure 6
Figure 6
Intracellular analysis ligands sourced from FBs and mainly signal pathways in ED samples. (A) Net plot showing the interaction number and strength. (B) Network plot showing the specific communicating pathways and their strength. (C, D, E) Heatmap showing the communication interaction of PTN, MK and FGF pathways in ED. The communication probability of a signaling pathway was computed by summarizing the probabilities of its associated ligand–receptor pairs. The darker the color, the greater the communication probability between the two cell types. (F) Chord diagram showing the cell–cell communication interaction of PTN, MK and FGF pathways in ED.
Figure 7
Figure 7
Intracellular analysis ligands sourced from FBs and mainly signal pathways in non-ED samples. (A) Net plot showing the interaction number and strength. (B) Network plot showing the specific communicating pathways and their strength. (C, D, E) Heatmap showing the communication interaction of PTN, MK and FGF pathways in non-ED. The communication probability of a signaling pathway was computed by summarizing the probabilities of its associated ligand–receptor pairs. The darker the color, the greater the communication probability between the two cell types. (F) Chord diagram showing the cell–cell communication interaction of PTN, MK and FGF pathways in non-ED.
Figure 8
Figure 8
Constructing an erectile dysfunction model in SD rats with bilateral cavernous nerve injury (BCNI) and ECM-related protein expression level expression of cavernous tissue in rats with BCNI. (A, B) The representative ICP and MAP of each experimental group were recorded under the following conditions: model: low voltage, method: continuous single stimulation, frequency: 20 Hz, intensity: 5 V. The stimulus interval indicated by the solid bar. Erectile function, as determined in vivo by electrical stimulation of the cavernous nerve of the rats in Sham group and BCNI group. (C) The erectile function of each group is presented as the maximal ICP/MAP ratio in the bar graph. (D) Masson staining of cavernous tissue sections performed Smooth muscle/Collagen ratio in the Sham group and BCNI group. (E) The ratio was quantified in the bar graph. (4 × magnification, upper row; 20 × magnification, lower row). Lower rows represent enhanced magnification of white rectangle boxes in upper rows. (FI) Immunofluorescence staining of cavernous tissue sections performed with anti- collagen 1, anti-collagen 9 antibody in the Sham group and BCNI group (10 × whole tissue cross-sectional scan, upper row; 40 × magnification, lower row). Lower rows represent enhanced magnification of red rectangle boxes in upper rows. And staining intensity was quantified and presented as fluorescence intensity. Values are mean ± SD (n = 6 per group). #p < 0.05 compared with the BCNI group; *p < 0.05 compared with the Sham group.
Figure 9
Figure 9
Identification of key genes with BCNI rat model by RT-PCR. The expression of COL3A1, TGFBI, MMP2, POSTN, PTN, and MDK. (ns, No significancy, *p < 0.05, **p < 0.01, ***p < 0.001).

Similar articles

Cited by

References

    1. Sánchez-Cruz JJ, Cabrera-León A, Martín-Morales A, Fernández A, Burgos R, Rejas J. Male erectile dysfunction and health-related quality of life. Eur. Urol. 2003;44(2):245–253. doi: 10.1016/S0302-2838(03)00215-X. - DOI - PubMed
    1. Altabas V, Altabas K. DPP-4 inhibition improves a sexual condition? Med. Hypotheses. 2015;85(2):124–126. doi: 10.1016/j.mehy.2015.04.011. - DOI - PubMed
    1. Van de Sande B, Lee JS, Mutasa-Gottgens E, et al. Applications of single-cell RNA sequencing in drug discovery and development. Nat. Rev. Drug Discov. 2023;22(6):496–520. doi: 10.1038/s41573-023-00688-4. - DOI - PMC - PubMed
    1. Fang D, Tan XH, Song WP, et al. Single-cell RNA sequencing of human corpus cavernosum reveals cellular heterogeneity landscapes in erectile dysfunction. Front. Endocrinol. 2022;13:874915. doi: 10.3389/fendo.2022.874915. - DOI - PMC - PubMed
    1. Zhao L, Han S, Su H, et al. Single-cell transcriptome atlas of the human corpus cavernosum. Nat. Commun. 2022;13(1):4302. doi: 10.1038/s41467-022-31950-9. - DOI - PMC - PubMed