

Global multi-hazard risk assessment in a changing climate
- PMID: 38467707
- PMCID: PMC11636830
- DOI: 10.1038/s41598-024-55775-2
Global multi-hazard risk assessment in a changing climate
Abstract
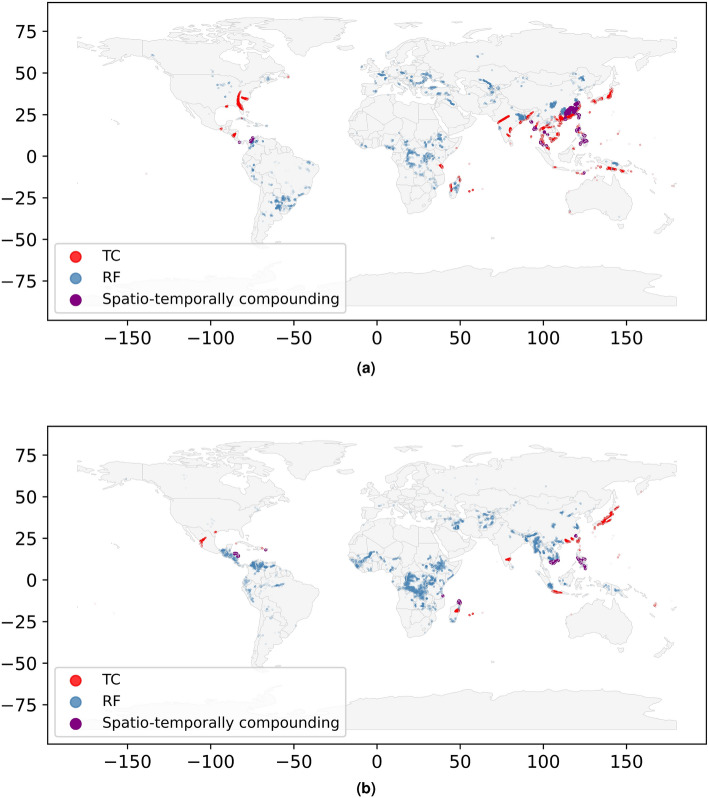
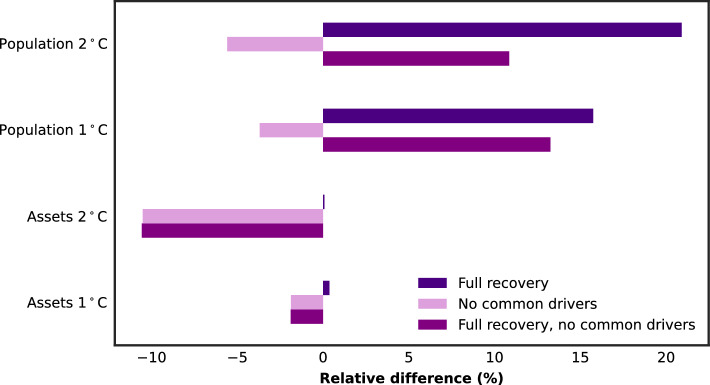
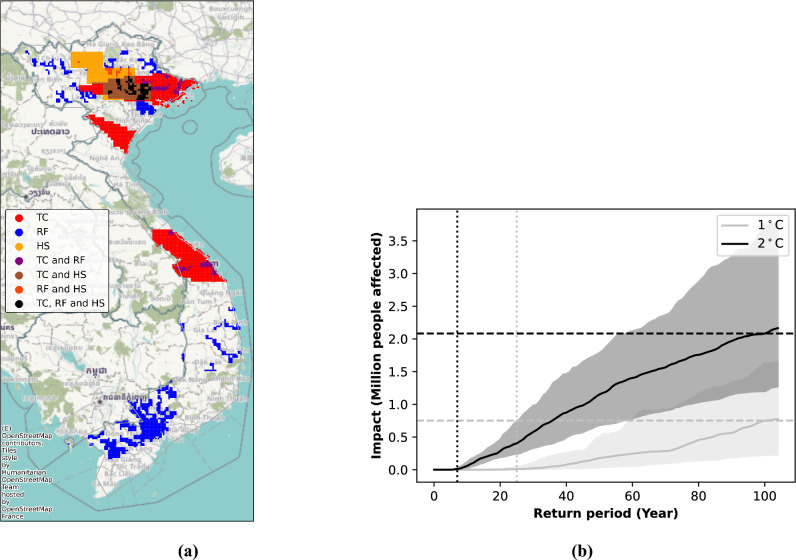
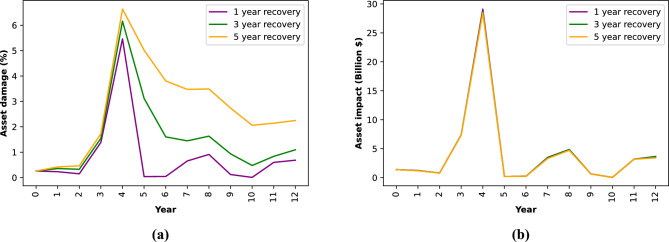
Natural hazards pose significant risks to people and assets in many regions of the world. Quantifying associated risks is crucial for many applications such as adaptation option appraisal and insurance pricing. However, traditional risk assessment approaches have focused on the impacts of single hazards, ignoring the effects of multi-hazard risks and potentially leading to underestimations or overestimations of risks. In this work, we present a framework for modelling multi-hazard risks globally in a consistent way, considering hazards, exposures, vulnerabilities, and assumptions on recovery. We illustrate the approach using river floods and tropical cyclones impacting people and physical assets on a global scale in a changing climate. To ensure physical consistency, we combine single hazard models that were driven by the same climate model realizations. Our results show that incorporating common physical drivers and recovery considerably alters the multi-hazard risk. We finally demonstrate how our framework can accommodate more than two hazards and integrate diverse assumptions about recovery processes based on a national case study. This framework is implemented in the open-source climate risk assessment platform CLIMADA and can be applied to various hazards and exposures, providing a more comprehensive approach to risk management than conventional methods.
© 2024. The Author(s).
Conflict of interest statement
The authors declare no competing interests.
Figures


References
-
- IPCC. Climate Change 2022: Impacts, Adaptation, and Vulnerability. Contribution of Working Group II to the Sixth Assessment Report of the Intergovernmental Panel on Climate Change (2022).
-
- Ward, P. J. et al. Review article: Natural hazard risk assessments at the global scale. Nat. Hazards Earth Syst. Sci.20, 1069–1096. 10.5194/nhess-20-1069-2020 (2020) (Publisher: Copernicus GmbH). - DOI
-
- Zschau, J. Where are we with multihazards, multirisks assessment capacities? Tech. Rep. (2017).
-
- Fleming, K. et al. Harmonizing and comparing single-type natural hazard risk estimations. Annals of geophysics=Annali di geofisica. 10.4401/ag-6987 (2016).
-
- Ward, P. J. et al. Invited perspectives: A research agenda towards disaster risk management pathways in multi-(hazard-)risk assessment. Nat. Hazards Earth Syst. Sci.22, 1487–1497. 10.5194/nhess-22-1487-2022 (2022). - DOI
Grants and funding
LinkOut - more resources
Full Text Sources
