

Comparing body composition between the sweet-liking phenotypes: experimental data, systematic review and individual participant data meta-analysis
- PMID: 38467727
- PMCID: PMC11129949
- DOI: 10.1038/s41366-024-01494-7
Comparing body composition between the sweet-liking phenotypes: experimental data, systematic review and individual participant data meta-analysis
Abstract
Background: Legislation aimed at reducing sugar intake assumes that sweet-liking drives overconsumption. However, evidence that a greater liking for sweet taste is associated with unhealthier body size is mixed and complicated by relatively small samples, an overreliance on body mass index (BMI) and lack of classification using sweet-liking phenotypes.
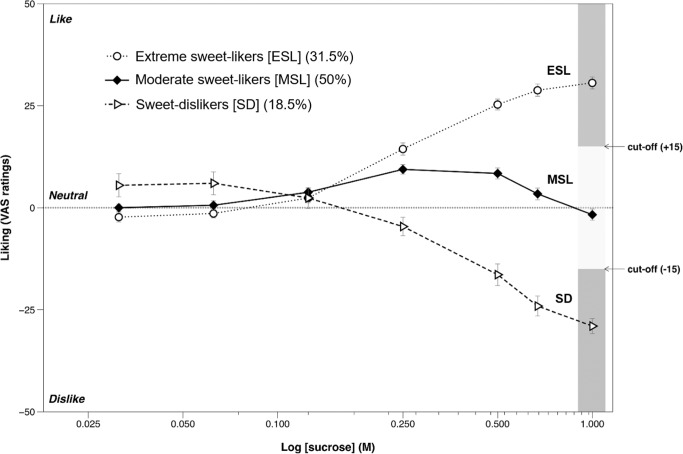
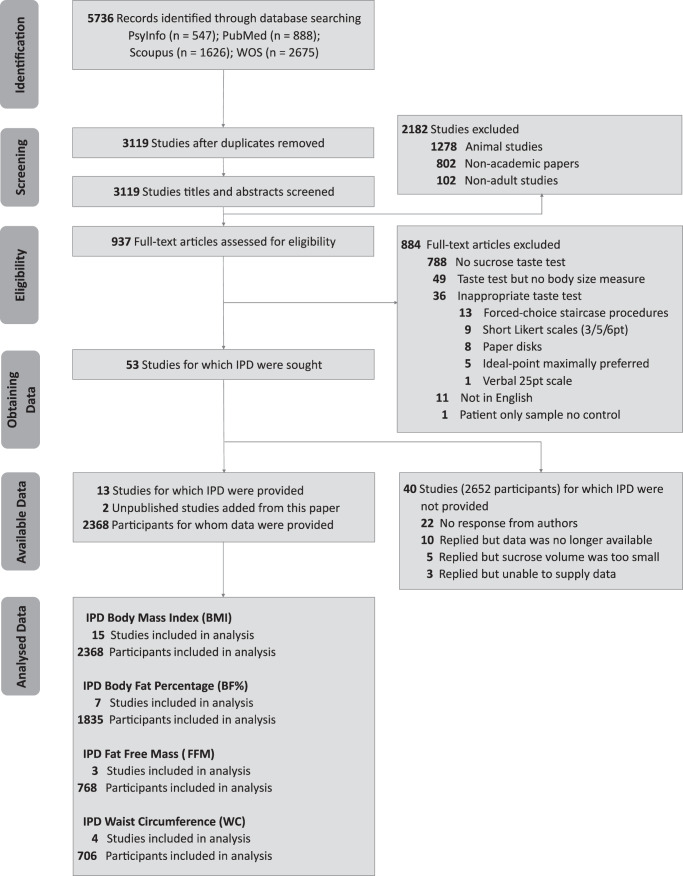
Methods: We first examined body size data in two larger samples with sweet-liking phenotyping: extreme sweet-likers, moderate sweet-likers and sweet-dislikers. Adults (18-34yrs), attended a two-session lab-based experiment involving phenotyping for sweet-liking status and a bioelectrical impedance body composition measurement (Experiment One: N = 200; Experiment Two: N = 314). Secondly, we conducted an individual participant data (IPD) meta-analysis: systematic searches across four databases identified 5736 potential articles. Of these, 53 papers met our search criteria: a taste assessment that measured liking using sucrose (>13.7% w/v), which allowed sweet-liking phenotyping and included either BMI, body fat percentage (BF%), fat-free mass (FFM) or waist-circumference.
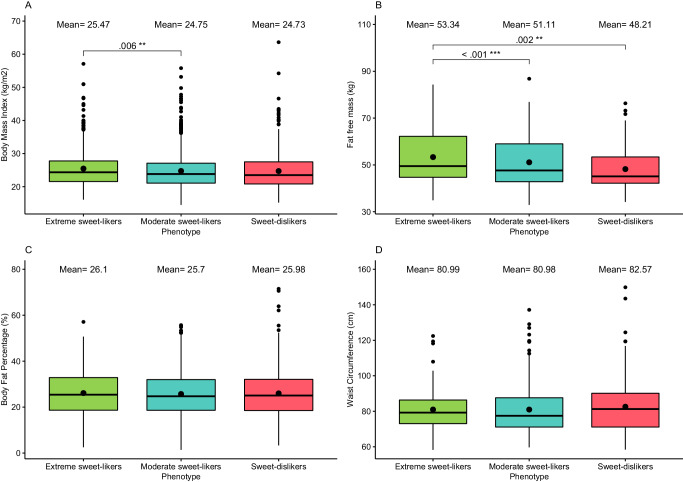
Results: A significant effect of sweet-liking phenotype on FFM was found in both Experiment One and Two, with extreme sweet-likers having significantly higher FFM than sweet-dislikers. In Experiment One, sweet-dislikers had a significantly higher BF% than extreme sweet-likers and moderate sweet-likers. However, as these data are from one research group in a young, predominantly westernised population, and the results did not perfectly replicate, we conducted the IPD meta-analyses to further clarify the findings. Robust one-stage IPD meta-analyses of 15 studies controlling for sex revealed no significant differences in BF% (n = 1836) or waist-circumference (n = 706). For BMI (n = 2368), moderate sweet-likers had slightly lower BMI than extreme sweet-likers, who had the highest overall BMI. Most interestingly, for FFM (n = 768), moderate sweet-likers and sweet-dislikers showed significantly lower FFM than extreme sweet-likers.
Conclusion: The higher BMI often seen in sweet-likers may be due to a larger FFM and questions the simple model where sweet liking alone is a risk factor for obesity.
© 2024. The Author(s).
Conflict of interest statement
The work from Experiment One and Two presented in this paper was funded by grant RPG-2018–068 from the Leverhulme Trust, UK: R.A. was supported by a PhD studentship through the Leverhulme Doctoral Scholarship Programme in Sensation, Perception and Awareness. The funding sources had no role in the design, analysis or writing of the article.
Figures
Similar articles
-
Systemic pharmacological treatments for chronic plaque psoriasis: a network meta-analysis.Cochrane Database Syst Rev. 2021 Apr 19;4(4):CD011535. doi: 10.1002/14651858.CD011535.pub4. Cochrane Database Syst Rev. 2021. Update in: Cochrane Database Syst Rev. 2022 May 23;5:CD011535. doi: 10.1002/14651858.CD011535.pub5. PMID: 33871055 Free PMC article. Updated.
-
Systemic pharmacological treatments for chronic plaque psoriasis: a network meta-analysis.Cochrane Database Syst Rev. 2017 Dec 22;12(12):CD011535. doi: 10.1002/14651858.CD011535.pub2. Cochrane Database Syst Rev. 2017. Update in: Cochrane Database Syst Rev. 2020 Jan 9;1:CD011535. doi: 10.1002/14651858.CD011535.pub3. PMID: 29271481 Free PMC article. Updated.
-
Drugs for preventing postoperative nausea and vomiting in adults after general anaesthesia: a network meta-analysis.Cochrane Database Syst Rev. 2020 Oct 19;10(10):CD012859. doi: 10.1002/14651858.CD012859.pub2. Cochrane Database Syst Rev. 2020. PMID: 33075160 Free PMC article.
-
Signs and symptoms to determine if a patient presenting in primary care or hospital outpatient settings has COVID-19.Cochrane Database Syst Rev. 2022 May 20;5(5):CD013665. doi: 10.1002/14651858.CD013665.pub3. Cochrane Database Syst Rev. 2022. PMID: 35593186 Free PMC article.
-
Sertindole for schizophrenia.Cochrane Database Syst Rev. 2005 Jul 20;2005(3):CD001715. doi: 10.1002/14651858.CD001715.pub2. Cochrane Database Syst Rev. 2005. PMID: 16034864 Free PMC article.
Cited by
-
Clinical Assessment of Altered Eating Behaviors in People with Obesity Using the EBA-O Questionnaire.Nutrients. 2025 Mar 30;17(7):1209. doi: 10.3390/nu17071209. Nutrients. 2025. PMID: 40218967 Free PMC article.
-
Patterns of sensory and hedonic responses for salty and umami tastes and their impact on food familiarity, consumption, and nutritional status: A gender-based analysis from a large population sample.Curr Res Food Sci. 2025 Jan 6;10:100970. doi: 10.1016/j.crfs.2025.100970. eCollection 2025. Curr Res Food Sci. 2025. PMID: 39876976 Free PMC article.
References
-
- Bentham J, Di Cesare M. Obesity: a long-term global challenge. International Handbook of the Demography of Obesity: Springer; 2022. 15-37.
-
- England PH Health matters: obesity and the food environment. London, UK: Public Health England; 2017.
Publication types
MeSH terms
LinkOut - more resources
Full Text Sources
Miscellaneous
