. 2024 Apr;56(4):686-696.
doi: 10.1038/s41588-024-01678-x. Epub 2024 Mar 11.

Enhancer-promoter interactions become more instructive in the transition from cell-fate specification to tissue differentiation

Affiliations

Enhancer-promoter interactions become more instructive in the transition from cell-fate specification to tissue differentiation

Tim Pollex et al. Nat Genet. 2024 Apr.

Abstract

To regulate expression, enhancers must come in proximity to their target gene. However, the relationship between the timing of enhancer-promoter (E-P) proximity and activity remains unclear, with examples of uncoupled, anticorrelated and correlated interactions. To assess this, we selected 600 characterized enhancers or promoters with tissue-specific activity in Drosophila embryos and performed Capture-C in FACS-purified myogenic or neurogenic cells during specification and tissue differentiation. This enabled direct comparison between E-P proximity and activity transitioning from OFF-to-ON and ON-to-OFF states across developmental conditions. This showed remarkably similar E-P topologies between specified muscle and neuronal cells, which are uncoupled from activity. During tissue differentiation, many new distal interactions emerge where changes in E-P proximity reflect changes in activity. The mode of E-P regulation therefore appears to change as embryogenesis proceeds, from largely permissive topologies during cell-fate specification to more instructive regulation during terminal tissue differentiation, when E-P proximity is coupled to activation.


Conflict of interest statement

The authors declare no competing financial interests.

Figures
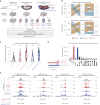
Fig. 1
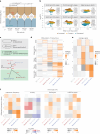
Fig. 1. Quantifying E–P interactions across tissues and developmental time.
a, Experimental overview, myogenic (Mef2+) and neuronal (Elav+) cells were isolated (>95% purity) from tightly staged embryos at 6-8 h and 10-12 h and used for Capture-C and ChIP–seq (H3K27ac, CTCF, BEAF-32, Su(Hw)) in biological replicates. Gray = WE 2–3 h, red = myogenic mesoderm (myo 6–8 h, muscle 10–12 h), blue = nervous system (neuro 6–8 h, neurons 10–12 h). NM/NN (Mef2 and Elav cells). b, Alluvial plots showing the dynamic activity of the E–P baits in muscle and/or neuronal tissues (or both tissues). The number of E–Ps with activation (OFF–ON, brown) or deactivation (ON–OFF, blue) between conditions is indicated by the thickness of the lines. c, Violin plot/boxplot of the number of high-confidence interactions (CHiCAGO score ≥5 and DHS overlap) per bait at the indicated developmental time/tissue (colors as in a). Total number of high-confidence interactions for all baits indicated above. Boxplot: center = median; upper and lower bounds = interquartile range; whiskers = minimum and maximum. d, UpSet plot showing high-confidence E–P interactions in the five conditions. Unique interactions for each condition are indicated by colored bars (as in a). The 15 most frequent combinations are shown. e, Normalized Capture-C counts at three selected developmentally regulated genes (promoter baits) and one selected enhancer bait, highlighted in light pink. Gene names and genomic regions are indicated above; tissue and stage are indicated on the left (colors as in a) and the activity of each element in each condition (ON-to-OFF, etc.) is also indicated. Arrowheads indicate regions of interest with significantly differential interaction counts between tissues/stages.
Fig. 2
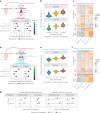
Fig. 2. E–P proximity is tightly linked to activity during tissue differentiation but not during specification.
a, Violin plot/boxplot showing changes in interaction frequencies (log2(FC)) of significant interacting regions for E/Ps (all E/P baits) changing in their activity between conditions (OFF–OFF, OFF–ON, ON–OFF and ON–ON). Number (n) of interacting fragments (CHiCAGO score ≥5) is indicated below. P value (above) from a nonparametric Wilcoxon test (two-sided) shows a significant concordant trend for increased or decreased interaction frequencies for E/P baits going from OFF–ON or ON–OFF. Boxplot, center = median; upper and lower bounds = interquartile range; whiskers = minimum and maximum. b, Scatter plot showing log2(FC) of interacting frequencies between conditions, with significantly increased (brown), decreased (turquoise) or invariant (yellow) interactions between the two conditions highlighted (numbers indicated). The majority of differential interactions are in comparisons involving 10–12 h tissues. c, Top, schematic representation of embryos at the relevant stages. Bottom, dendrogram displaying the distance (indicated by branch length) between the five developmental conditions based on their E/P interaction frequencies for all differential interactions (from b). Myoblasts and neuronal cells are closer to each other at 6–8 h than to their 10–12 h tissue counterparts (muscle or neurons). The two tissues are more divergent in their E–P interactions at 10–12 h (indicated by the long branch length). d, K-means clustering (k = 6) of all significant differential E/P interactions (from b), which increase (orange) or decrease (gray) relative to the sample average. Most differential interactions are higher at 10–12 h—clusters 2, 5 and 6 in the nervous system and clusters 3 and 4 in muscle. e, Average differential interaction frequency within respective clusters from d. Blue dotted outlines highlight conditions with high average interaction frequency in the respective clusters, for example, myo 6–8 h and neuro 6–8 h are outlined for cluster ‘Early’ in d and e. f, Comparison of average relative E/P interaction frequency per cluster (left, same as e) to E/P (bait) activity, shown as enrichment of in vivo annotated activity/expression (log(OR)), average DHS and H3K27ac ChIP–seq signal (log2(FC)) within each cluster in that condition. OR, odds ratio.
Fig. 3
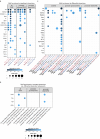
Fig. 3. Dynamic E–P interactions are linked to dynamic regulatory features.
a,d, Enrichment of tissue/stage-matched DHS (a) or H3K27ac peaks (d) in proximity to the ‘other end’ of all significant interactions (schematic, top). Bottom, frequency of DHS within 500 bp of the ‘other end’ in the respective condition, for all significant (filled circle) or nonsignificant (empty circle) interactions. DHS are more frequently at the ‘other end’ of interactions at 10–12 h, compared to 6–8 h (a). Color shade (filled circles) indicates P value (two-sided Fisher’s exact test). Enrichments for E or P baits are shown separately. b,e, Violin plots/boxplots showing quantitative changes in DHS signal (b) or H3K27ac ChIP–seq signal (e). The direction of change in DHS signal correlates with direction of change in interaction frequency (b). The direction of H3K27ac change correlates with changes in interaction frequency, especially at 10–12 h (e). log2(FC) at ‘other ends’ (<500 bp) of E/P Capture-C baits with decreased (turquoise), constant (yellow) or increased (brown) interactions across the same conditions (tissue or time). Boxplot, center = median; upper and lower bounds = interquartile range; whiskers = minimum and maximum. c,f, Relative DHS (c) or H3K27ac (f) quantitative signal at the ‘other end’ of differential interactions in six clusters in Fig. 2d. Higher DHS signal (c) and H3K27ac (f) signal mirror higher E/P interaction frequency in the respective clusters/conditions (blue dotted outline highlights relevant conditions for each cluster). g, E/P baits interact with enhancers or promoters (at the ‘other end’) that are active in the same tissue (either neuro or myo/muscle). Baits active in both tissues were excluded. X axis = enrichment (log2(OR)) of features active in the two tissues. Positive log2(OR) (red dot) indicates enrichment in E/P baits with neuro activity (relative to muscle), and negative value (blue dot) indicates enrichment in muscle activity (relative to neuro). Whiskers = 95% confidence interval. Left, enrichments for nondifferential E/P interactions. Right, enrichments for differential E/P interactions. E/P baits (both differential and constant) active in one tissue preferentially interact with genomic features active in the same tissue (x axis cut at −4/4, respectively).
Fig. 4
Fig. 4. Insulator binding at loop anchors cannot explain E–P loops.
a, UpSet plot of significant insulator ChIP–seq peaks across all conditions. b, Heatmaps of quantitative ChIP–seq signal for BEAF-32, CTCF and Su(Hw) in the indicated condition (above), ±1 kb around peak centers (0). Peaks were clustered based on the binding of BEAF-32, CTCF or Su(Hw) alone, or combined: B&C = BEAF-32 and CTCF; B&S = BEAF-32 and Su(Hw); C&S = CTCF and Su(Hw); B&C&S = all three factors. c, Enrichment analysis of all insulator peaks in proximity to significantly interacting regions. The frequency of insulator peaks in proximity (<500 bp) to the ‘other end’ of significant (filled circle) and nonsignificant (empty circles) interactions in the respective samples. Color shade of filled circles denotes the P value (two-sided Fisher’s exact test). Data for the enhancer and promoter baits are shown separately. CTCF and Su(Hw) are enriched at the ‘other end(s)’ of both E/P interactions, whereas BEAF-32 is more enriched at interacting regions of promoter baits. d, Violin plots/boxplots showing quantitative changes in insulator binding (log2(FC) of ChIP–seq signal) at ‘other end(s)’ (<500 bp) of Capture-C E/P baits with decreased (turquoise), constant (yellow) or increased (brown) interactions, across the matched conditions (tissue/time). Changes in E/P interactions are globally not correlated with changes in insulator binding. Boxplot, center = median; upper and lower bounds = interquartile range; whiskers = minimum and maximum.
Fig. 5
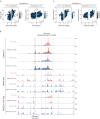
Fig. 5. Concordant changes in E/P interactions and chromatin features reveal functional E–P pairs.
a, Top, normalized Capture-C, DNase-seq and H3K27ac ChIP–seq signal at the Olig family (Oli) locus in four conditions. Vertical light pink bar indicates the bait (Oli promoter), and gray bars indicate the position of interacting regions tested for enhancer activity. Bottom, reciprocal Capture-C from the neuro 1 (Oli 1) enhancer (bait = vertical light pink bar). Normalized Capture-C counts in four different conditions. Significant interactions between neuro 1 and the Oli promoter and other elements are indicated by gray bars. b, Double FISH of embryos for four transgenes testing enhancer activity of genomic regions Oli 1–4 at the indicated stages. Yellow indicates reporter RNA (lacZ) and magenta indicates Oli RNA. Regions Oli 1–3 function as enhancers overlapping part of Oli expression at 10–12 h. Scale bars = 50 µm.
Extended Data Fig. 1
Extended Data Fig. 1. Properties of high-confidence E/P interactions.
(a) Clustering of interaction frequencies at all high-confidence E/P interactions only called in one condition (colored bars in Fig. 1d), showing increase (orange) or decrease (gray) relative to the sample average. The majority of unique interactions have the highest interaction frequency in the condition (tissue/time point) where they were called significant (Fig. 1d) compared to all others. (b,c) Violin plots/boxplots of the number of high-confidence interactions (CHiCAGO score ≥5 and DHS overlap) per bait at the indicated developmental time/tissue for E/P baits active (b) or inactive (c) in the indicated condition. Number of interactions for active (b) or inactive (c) baits, as well as the total number of high-confidence interactions for all baits indicated above. Number of baits active (b) or inactive (c) is indicated below the plot. (d) Violin plots/boxplots displaying the distribution of genomic distances between the bait and ‘other end’ for all high-confidence interactions (CHiCAGO score ≥5, DHS overlap) identified in the 5 conditions. (e) P(s) plot displaying the probability of observing interactions at a given distance/separation between the bait and ‘other end’. Over developmental time there are fewer proximal interactions (<10 kb) and more distal interactions (>10 kb). In the identification of differential interactions (DESeq2 analysis; Methods), a normalization process was applied to account for these differences in the P(s) curves. (f) Bar chart depicting the fraction of high-confidence interactions per bait (y-axis) crossing TAD boundaries (x-axis, up to ≥10 boundaries) based on boundary annotation from whole embryos from ref. . (g) Violin plots/boxplots displaying the fraction of intra-TAD high-confidence interactions per baits in the 5 conditions. TAD annotation was based on ref. . For boxplots in b, c, d, g: center = median, upper and lower bounds = interquartile range, whiskers = minimum and maximum).
Extended Data Fig. 2
Extended Data Fig. 2. Differential E/P interactions are highly correlated with differential DHS, but not vice versa.
(a) 2D density plot displaying DNase-seq (DHS) signal at the ‘other end’ with respect to interaction frequency at differential E/P interactions (left panel, DHS to interaction) or changes in interaction frequency with respect to changes in DNase-seq signal at differential DHS (right panel, Interaction to DHS). Increase or decrease of interaction frequency at differential E/P interactions is generally correlated with a concordant change in DHS (left panel). Changes in DHS signal (at differential DHS regions) are less correlated with changes in interaction frequencies (right panel). (b) Example locus showing coordinated and non-coordinated changes: normalized Capture-C counts at the zfh1 promoter bait (highlighted in light pink) have a high-confidence interaction (leftmost rectangle) in both muscle and neurons at 10-12 h. Below, DNase-seq and H3K27ac ChIP–seq signal in matched conditions. The differential stage-specific E/P interaction overlaps a stage-specific DHS (left rectangle (black dashed outline)) in both conditions—and is an example of concordant changes in differential DHS and chromatin interactions. Other highly tissue-specific DHS or H3K27ac peaks (middle, blue dashed rectangle), which are in-between the bait (red bar) and the 10-12 h differential interaction, do not show a comparable increase in interaction frequency. Although these regions (middle blue dashed rectangle) are part of the zfh1 regulatory landscape, the increase in, for example, DHS signal between Myo 6-8 h and Neuro 6-8 h is not mirrored by a concordant increase in interaction frequency. Other highly tissue- and/or stage-specific DHS and H3K27ac peaks to the right of the zfh1 bait (right, green dashed rectangle) show very low interaction frequency and are not part of the zfh1 regulatory landscape, again demonstrating that high DHS signal in the same tissue/time point is not necessarily linked to high E/P interaction frequency. (c) Similar to (a) for H3K27ac ChIP–seq signal, showing a general correlation between changes of interaction frequency and the underlying H3K27ac signal, while the reverse (changes in H3K27ac compared to interaction frequency) is less correlated.
Extended Data Fig. 3
Extended Data Fig. 3. Motif enrichment at E/P loops—instructive tissue-specific loops are enriched in motifs for tissue-specific transcription factors.
(a) Identification of potential factors involved in the formation of E/P loops. Tissue- and stage-matched DHS (from ref. ) were divided into two groups, a test set in proximity (<500 bp) to all significant interactions and a control set (composed of a non-overlapping DHS set that is in proximity (<500 bp) to non-significant interactions). Enrichment of Drosophila melanogaster transcription factor motifs (from CIS-BP) in the test DHS relative to control DHS (Methods). Plot shows motifs enriched in the indicated sample using an adjusted p-value cutoff of 1 × 104. (b) Motif enrichment comparing constant interactions to differential interactions (using DHS underlying differential interactions as the background set for enrichment calculation). Plots show motifs enriched in the indicated sample using an adjusted p-value cutoff of 1 × 10−4. All four factors have multiple PWMs, which are variants on TAATTA sequence, suggesting that this enrichment likely comes from the same factor. (c) Motif enrichment at differential interactions. DHS were divided into three groups based on their proximity (<500 bp) to increased, decreased or “other” (non-increased and non-decreased) E/P interacting regions characterized in the same tissue/time condition. Enrichment of Drosophila transcription factor motifs (from CIS-BP) in either the increased or decreased DHS, relative to other DHS in the same condition, was carried out using the AME tool (doi: 10.1186/1471-2105-11-165). In (a), (b) and (c) for the background, only DHS >10 kb and <250 kb from the bait were considered, and enrichments for all, promoter proximal and promoter distal DHS (≥500 bp) are shown separately. p-values in (a), (b) and (c) were calculated using a one-sided Fisher exact test.
Extended Data Fig. 4
Extended Data Fig. 4. Differential Capture-C interactions at the Toll-7 locus represent functional enhancer elements.
(a) Upper: normalized Capture-C signal at the Toll-7 locus in 4 conditions. Vertical light pink bar = bait (Toll-7 promoter), gray bars (zoom-in) = position of interacting regions tested for enhancer activity. Genomic location of BAC probes used for DNA FISH (blue, magenta rectangles) and genomic regions tested in transgenic enhancer assays (labeled 1-4) are shown below. Lower: zoom-in showing DNase-seq (DHS), H3K27ac and insulator ChIP signal in the 4 tested elements Toll-7 1-4 and Toll-7 gene. Differential interaction between Toll-7 promoter and CR44506 at 10-12 h in neurons is accompanied by differential CTCF binding in neurons at 10-12 h (black arrowhead). Muscle-specific Toll-7 promoter and Toll-74 coincide with adjacent muscle-specific CTCF binding (red arrow). Perhaps differential insulator binding plays a role in differential E/P interactions at this locus. (b) Double fluorescence in situ hybridization of transgenic embryos testing Toll-7 1-4 for enhancer activity. Yellow = reporter (lacZ), magenta = Toll-7 RNA. Toll-7 2-4 have sporadic enhancer activity in a small subset of cells (scale bars = 50 µm). (c) Immunofluorescence (IF)-DNA FISH: above, IF signal of Elav expression in the ventral nerve cord (false-colored in cyan, DAPI in gray) of stage 16 embryo (lateral view, single optical section, scale bar = 50 µm). Below, DNA FISH (yellow = Toll-7, magenta = CR44506, BAC probes position indicated in (a). Zoom-in of Elav+ (lower left) or Elav− (lower right) region (maximum projection from deconvolved image stacks, scale bars = 2 µm). 3D distance between Toll-7-CR44506 was measured in neuronal (Elav+) and adjacent non-neuronal (Elav−) tissue within the same embryos. (d) Violin plot/boxplot of DNA FISH distance between Toll-7 and CR44506 in neuronal (blue = Elav+) and non-neuronal (gray = Elav−) tissue. Dashed line = 250 nm. Percentage with distances <250 nm, number (n) of nuclei measured indicated underneath. The two loci are significantly closer in neuronal compared to non-neuronal cells at 10-12 h and 16-18 h. P-values from Kolmogorov-Smirnov test (two-sided). Boxplot: center = median, upper/lower bounds = first/third quartiles, whiskers = lowest/highest at min/max 1.5 interquartile range, dots = outliers plotted individually.
Extended Data Fig. 5
Extended Data Fig. 5. Tissue-specific promoter interacting regions are often enhancers active in that tissue.
(a) Upper: normalized Capture-C, DNase-seq and H3K27ac ChIP–seq signal at the lame duck (lmd) locus in 4 different conditions. Vertical red bar = lmd promoter (bait), gray bars = tested interacting region (lmd 1) in transgenic embryos. Lower: RNA in situ hybridization in transgenic embryos for the reporter gene (yellow, lacZ) and the lmd gene (magenta) at the indicated stages, for lmd 1. (be) As in (a) for Delta (Dl) interacting regions (b), roundabout 3 (robo3) region (c), huckebein (hkb) region (d) and vesicular acetylcholine transporter (VAChT) region (e) (scale bars = 50 µm). Five of the tested regions (5/19) either had enhancer activity that did not match the interacting gene’s expression (VAChT (e), Oli 4 (Fig. 5)), or did not match the tissue-specific interactions (Dl 2, (b)), or had no enhancer activity (Dop1R1, Toll-7 1 (Extended Data Fig. 4b)) (Supplementary Table 1). For example, the interacting region with the VAChT promoter (e) had enhancer activity in the central nervous system, but curiously only in cells adjacent to the gene’s expression. The Dl 2 interacting region (b) has activity overlapping the Dl gene’s expression in the endoderm and visceral muscle, but this does not match the predominantly neuronal-specific interaction between the Dl 2 enhancer and the Dl promoter at 10-12 h (b). Some interacting elements might be bystander interactions in a gene dense and/or very compact locus (that is, cases where the enhancer’s activity does not match the interacting gene’s expression) or might serve a different regulatory function (that is, cases where the element does not function as an enhancer at all for example Toll-7 1).

References

    1. Tolhuis B, Palstra RJ, Splinter E, Grosveld F, de Laat W. Looping and interaction between hypersensitive sites in the active β-globin locus. Mol. Cell. 2002;10:1453–1465. doi: 10.1016/S1097-2765(02)00781-5. - DOI - PubMed
    1. Palstra RJ, et al. The β-globin nuclear compartment in development and erythroid differentiation. Nat. Genet. 2003;35:190–194. doi: 10.1038/ng1244. - DOI - PubMed
    1. Vernimmen D, De Gobbi M, Sloane-Stanley JA, Wood WG, Higgs DR. Long-range chromosomal interactions regulate the timing of the transition between poised and active gene expression. EMBO J. 2007;26:2041–2051. doi: 10.1038/sj.emboj.7601654. - DOI - PMC - PubMed
    1. Bharadwaj R, et al. Conserved higher-order chromatin regulates NMDA receptor gene expression and cognition. Neuron. 2014;84:997–1008. doi: 10.1016/j.neuron.2014.10.032. - DOI - PMC - PubMed
    1. Caputo L, et al. The Isl1/Ldb1 complex orchestrates genome-wide chromatin organization to instruct differentiation of multipotent cardiac progenitors. Cell Stem Cell. 2015;17:287–299. doi: 10.1016/j.stem.2015.08.007. - DOI - PMC - PubMed

MeSH terms

LinkOut - more resources