. 2024 Mar;10(3):494-511.
doi: 10.1038/s41477-024-01637-8. Epub 2024 Mar 11.

Rapid alkalinization factor 22 has a structural and signalling role in root hair cell wall assembly

Affiliations

Rapid alkalinization factor 22 has a structural and signalling role in root hair cell wall assembly

Sébastjen Schoenaers et al. Nat Plants. 2024 Mar.

Erratum in

Abstract

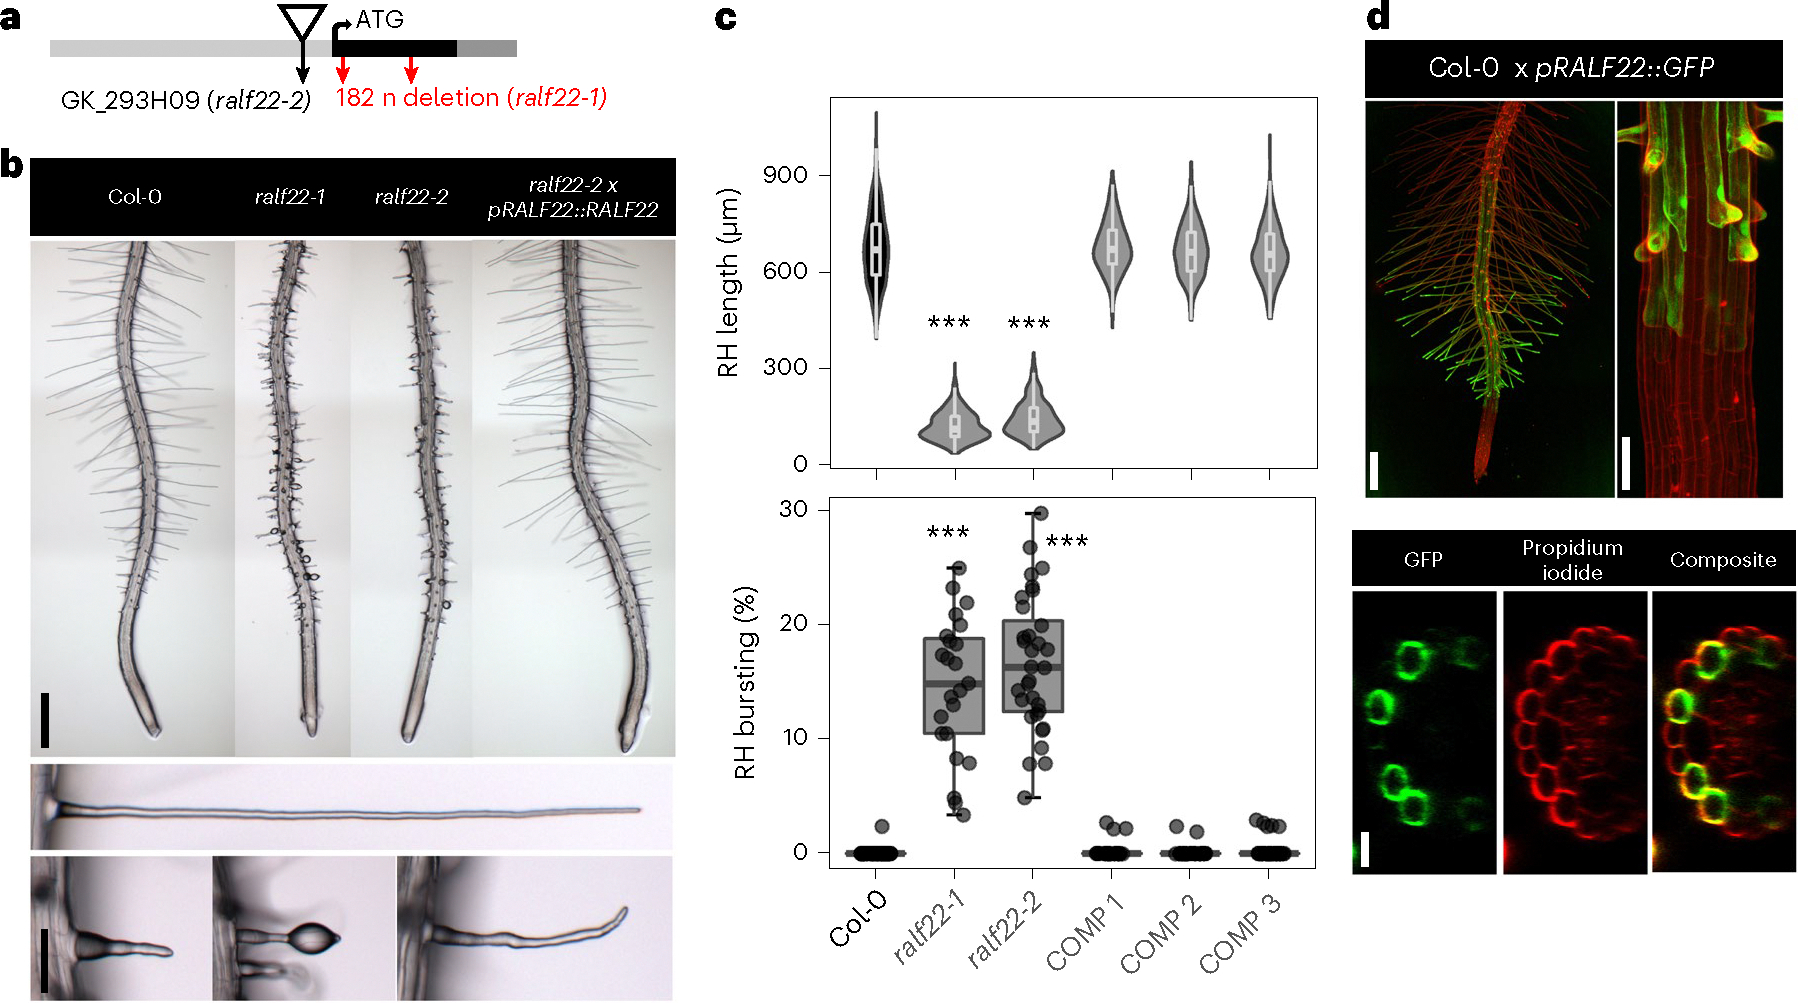
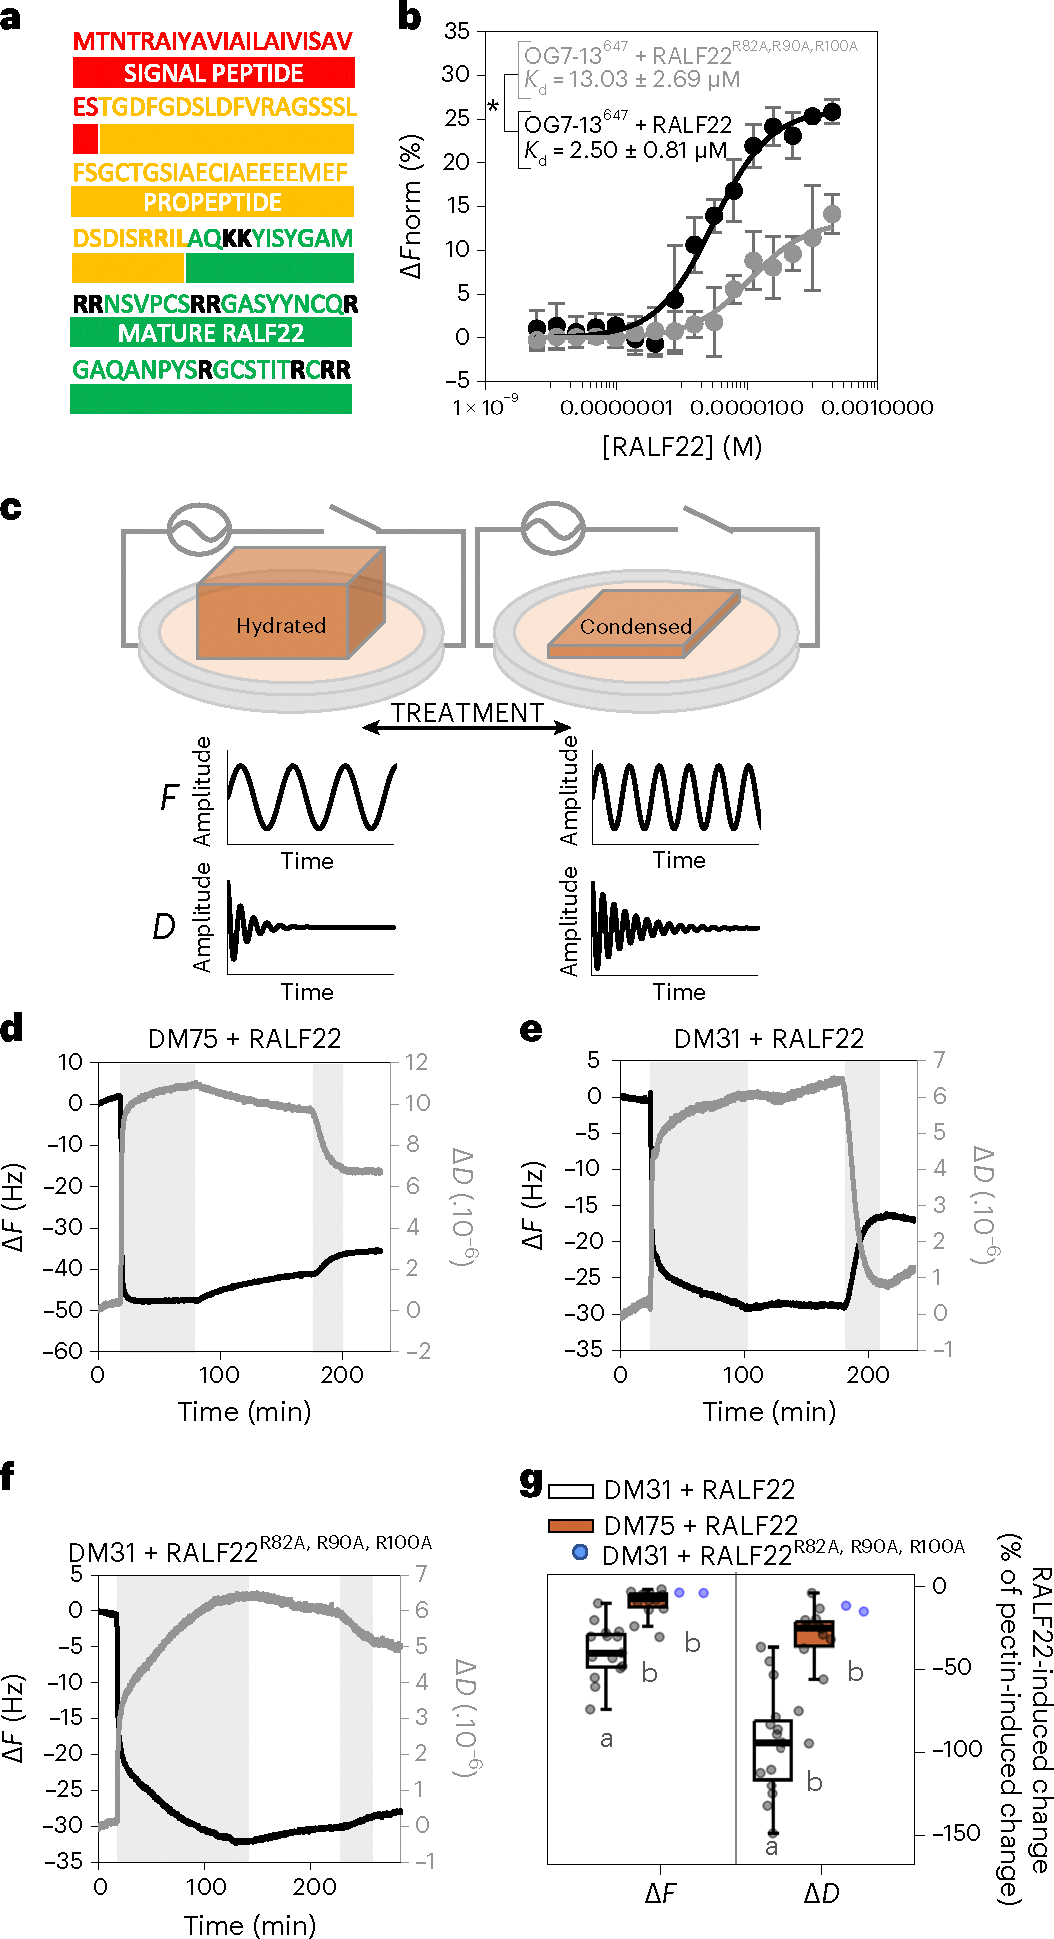
Pressurized cells with strong walls make up the hydrostatic skeleton of plants. Assembly and expansion of such stressed walls depend on a family of secreted RAPID ALKALINIZATION FACTOR (RALF) peptides, which bind both a membrane receptor complex and wall-localized LEUCINE-RICH REPEAT EXTENSIN (LRXs) in a mutually exclusive way. Here we show that, in root hairs, the RALF22 peptide has a dual structural and signalling role in cell expansion. Together with LRX1, it directs the compaction of charged pectin polymers at the root hair tip into periodic circumferential rings. Free RALF22 induces the formation of a complex with LORELEI-LIKE-GPI-ANCHORED PROTEIN 1 and FERONIA, triggering adaptive cellular responses. These findings show how a peptide simultaneously functions as a structural component organizing cell wall architecture and as a feedback signalling molecule that regulates this process depending on its interaction partners. This mechanism may also underlie wall assembly and expansion in other plant cell types.


Conflict of interest statement

Competing interests

The authors declare no competing interests.

Figures

Fig. 1 |
Fig. 1 |. RALF22 regulates RH growth.
a, A scheme of the RALF22 genomic sequence showing the T-DNA insertion site of GabiKat line GK_293H03 (ralf22–2) and the 182 nucleotide (n)-long deletion in ralf22–1. b, Representative 6-day-old roots of Col-0, ralf22–1(−/−), ralf22–2(−/−) and ralf22–2 × pRALF22::RALF22 (COMP) seedlings (scale bar, 500 μm). Close-ups of RHs showing the short, bulged and burst (Supplementary Video 1) RALF22 loss-of-function phenotype (scale bar, 100 μm). c, Violin plot and box plot showing the RH length and percentage of RH bursting, respectively, for all genotypes (n ≥ 5 plates per genotype, each plate contained ≥10 roots, 10 RHs were measured per root, ***P < 0.001; for corresponding P values, see Supplementary Table 1). Three independent complementation lines (ralf22–2 × pRALF22::RALF22) are shown. The box plots represent the median (centre line), 25% and 75% percentiles (limits) and minimum/maximum values (whiskers). The dots indicate individual roots. d, Representative confocal maximal projections and transverse optical sections of 6-day-old Col-0 seedlings expressing GFP under the control of the RALF22 promoter (Col-0 × pRALF22::GFP). RALF22 is transcribed in trichoblast cells throughout RH growth (scale bars: 100 μm (top left), 50 μm (top right) and 25 μm (bottom)).
Fig. 2 |
Fig. 2 |. RALF22 binds to FER to regulate RH growth.
a, A model of mature RALF22 showing the conserved YISY domain (sticks) required for LLG binding. b, MST results showing the binding affinity between fluorescently labelled recombinant LLG1 and RALF22 (n = 7) or RALF22Y75A,Y78A (n = 3). c, The binding affinity between the FER ectodomain (FERecd) and fluorescently labelled LLG1 pre-incubated with RALF22 (n = 3 independent experiments) or RALF22Y75A,Y78A (n = 3). MST values are represented as the average normalized change in fluorescence (ΔFnorm, %) ± s.e.m. (for corresponding P values, see Supplementary Table 1). d, A homology model of the LLG2–RALF22–FERecd complex. The N-terminal (N-ter) region of RALF22 was docked into the LLG2 structure (PDB: 6A5E). FERecd was superimposed on the basis of the crystal structure. The YISY motif is highlighted in sticks. e,f, Time lapse imaging of Col-0 (e) and fer-4 (f) RHs being treated with 5 μM RALF22 (Supplementary Video 2). The kymographs and corresponding plots depict changes in the growth rate, [Ca2+]cyt (cytosolic GCaMP3 fluorescence intensity), pHext (extracellular FITC–110 kDa dextran/TRITC–20 kDa dextran fluorescence intensity ratio) and migration of fluorescent FITC–110 kDa dextran and TRITC–20 kDa dextran into the CW (a proxy for altered CW physico-chemistry) during 4 min of growth followed by treatment with RALF22. The response of the RH to RALF22 was monitored for 6 min. Kymographs were generated along the horizontal lines depicted in the insets. gj, Quantification of the growth rate (g), [Ca2+]cyt (h), pHext (i) and FITC or TRITC fluorescence in the CW (j) before, upon and after treatment with RALF22 in Col-0 (n = 9 RHs) and fer-4 (n = 8 RHs) RHs. Col-0 RHs were also treated with a mock solution (−RALF22, n = 7 RHs). The box plots represent the median (centre line), 25% and 75% percentiles (limits) and minimum/maximum values (whiskers). The dots indicate individual RHs. Different letters represent statistical significance (α = 0.05; for corresponding P values, see Supplementary Table 1).
Fig. 3 |
Fig. 3 |. RALF22 binds and compacts demethylesterified HG.
a, Mature RALF22 is a positively charged protein. In bold are the amino acids that are positively charged at pH 7.0. b, MST affinity plots showing that RALF22 interacts with OG7–13647, an Alexa Fluor647-labelled 7–13-mer-long fully demethylesterified oligogalacturonide (n = 3 independent experiments). Mutating three cationic arginines on the RALF22 (RALF22R82A,R90A,R100A) surface leads to a 5.2-fold reduction in affinity (n = 3 independent experiments) (for corresponding P values, see Supplementary Table 1). c, An illustration of the QCM-D working principle. An alternating current is applied to a quartz surface that holds the pectin gel. The frequency of the lateral quartz oscillation (F) is inversely correlated with the mass of the pectin layer. The time it takes for the lateral oscillation to dissipate (D) when the current is interrupted positively correlates with the rigidity of the pectin layer. df, Representative ΔF and ΔD QCM-D traces for a pectin layer with a DM of 75% (d) or 31% (e) treated with 1 μg ml−1 RALF22 or DM31 pectin treated with 1 μg ml−1 RALF22R82A,R90A, R100A (f). The grey zones highlight the intervals during which pectin or RALF were applied (Supplementary Fig. 4a,b). g, Quantification of the percentage change in ΔF and ΔD upon RALF treatment for the conditions presented in df (DM75 + RALF22, n = 14; DM31 + RALF22, n = 15 independent experiments and DM31 + RALF22R82A,R90A,R100A, n = 2 independent experiments). The box plots represent the median (centre line), 25% and 75% percentiles (limits) and minimum/maximum values (whiskers). The dots indicate individual experiments. Different letters represent statistical significance (α = 0.05; for corresponding P values, see Supplementary Table 1).
Fig. 4 |
Fig. 4 |. RALF22 forms circumferential rings in the RH CW, which illustrate anisotropic wall expansion.
a, Representative images of 6-day-old Col-0, ralf22–2 and ralf22–2 × pRALF22::mCherry-RALF22mature (mCherry–RALF22) roots (scale bar, 500 μm) and RHs (scale bar, 100 μm). b, Quantification of the RH length and percentage of RH bursting for each genotype (n ≥ 5 plates per genotype, each plate contained ≥10 roots, for the RH length 10 RHs were measured per root, ***P < 0.001; for corresponding P values, see Supplementary Table 1). The box plots represent the median (centre line), 25% and 75% percentiles (limits) and minimum/maximum values (whiskers). The dots indicate individual roots. c, A representative longitudinal optical section of a growing (left) and a mature (right) ralf22–2 × pRALF22::mCherry-RALF22mature RH (scale bar, 8 μm). ROIs showing the presence of mCherry–RALF22mature microdomains in the RH CW (scale bar, 2 μm). d, A maximal projection kymograph corresponding to the CW of a 10 min time lapse acquisition of a growing ralf22–2 × pRALF22::mCherry-RALF22mature RH. Vertical red lines represent mCherry–RALF22mature microdomains that remained stationary in the CW throughout the acquisition. The longitudinal fluorescence pattern for quantification of the mCherry–RALF22mature microdomain spacing (Supplementary Fig. 5) was extracted along the yellow dotted line. e, A maximal projection kymograph of the RH tip CW after removal of the dome’s concave shape. The red lines represent stationary mCherry–RALF22mature microdomains, which arise at the very apex and move towards the shank as the tip grows forward. f, Representative snapshots of a growing ralf22–2 × pRALF22::mCherry-RALF22mature RH before, upon and after photobleaching of mCherry–RALF22mature in ROIs in the CW of the expanding dome, below the tip and in the shank (scale bar, 5 μm). Graphs showing mCherry fluorescence recovery at the apex only. g, A representative timeseries showing that RH growth rate and apical mCherry–RALF22mature fluorescence oscillate in anti-phase. h, Frontal and lateral high-resolution z-projections of mCherry–RALF22mature organization in the RH CW, illustrating the formation of regularly spaced mCherry–RALF22mature rings (scale bar, 2 μm). i, Representative high-resolution longitudinal optical section of a representative growing RH (scale bar, 5 μm) showing mCherry–RALF22mature microdomains in the tip and the shank (scale bar, 4 μm). Comparative analysis of mCherry–RALF22mature microdomain spacing in the tip (n = 12 RHs) versus the shank (n = 15 RHs). The graph corresponds to the data depicted in Supplementary Fig. 5f–j. The dots indicate individual RHs and the asterisks depict statistical significance (**P < 0.01; for corresponding P values, see Supplementary Table 1).
Fig. 5 |
Fig. 5 |. RALF22 binds to LRX1, and the RALF22–LRX1 complex in the RH CW compacts demethylesterified HG.
a, The lrx1–1/2–1 and ralf22–2 phenotypes are indistinguishable (Supplementary Video 5). Representative pictures (scale bar, 500 μm) and close-ups (scale bar, 100 μm) of 6-day-old seedlings are shown. b, The quantification of the RH length and percentage of RH bursting of Col-0, ralf22–2 and lrx1–1/2–1 seedlings (n ≥ 5 plates per genotype, each plate contained ≥10 roots, 10 RHs were measured per root, ***P < 0.001; for corresponding P values, see Supplementary Table 1). The box plots represent the median (centre line), 25% and 75% percentiles (limits) and minimum/maximum values (whiskers). The dots indicate individual roots. c, Structural superimposition of the LRX2 (PDB: 6QXP; grey) and LRX1 AlphaFold2 model (orange) (top left). Root mean square deviation of 0.15 Å; comparing 342 pairs of corresponding Cα atoms between the two proteins. Full molecular docking model of RALF22 (green) with LRX2LRR (PDB: 6QXP; grey) (bottom left). Enlarged view of the peptide-docking models showing RALF22 (green) in the LRX2LRR and LRX1LRR (AlphaFold2 model) binding pockets (middle and right). The three exposed arginines (R82, R90 and R100) required for pectin binding are depicted as sticks. d, Size-exclusion chromatography (SEC) of LRX1LRR–RALF22 (pH 5.0 and 2.0) and LRX2LRR–RALF22 (pH 5.0) purified from insect cells, showing that the complex does not dissociate at pH 2. e, Sodium dodecyl-sulfate (SDS) protein gels of the fractions corresponding to the SEC elution peaks for LRX1LRR–RALF22 (pH 5.0 and 2.0) and LRX2LRR–RALF22 (pH 5.0). f, A thermoshift assay of LRX8LRR–RALF4 (control), LRX1LRR–RALF22 and LRX2LRR–RALF22. LRX1LRR–RALF22 was subjected to pH 5.0 and pH 2.0. Low pH does not affect the thermostability of the complex. g, Representative longitudinal optical sections of the lrx1–1 × pLRX1::cMyc-LRX1 × pRALF22::mCherry-RALF22mature CW in which LRX1 was labelled with a green fluorescent anti-cMyc antibody (scale bar, 5 μm). The dots represent cMyc–LRX1 (green) and mCherry–RALF22mature microdomains (red). Composite images and magnifications (scale bar, 1 μm) show colocalization (yellow) between LRX1 (green) and RALF22 (red) in the same stretch of the RH CW. The colocalization is expected to be incomplete (for example, ROI1) given the presence of endogenous RALF22 and LRX2. h, Representative lateral z-projections of cMyc–LRX1 (green) and mCherry–RALF22mature (red) organization in the same stretch of the RH CW. Colocalization is shown in yellow (scale bar, 5 μm). ik, QCM-D experiments: representative ΔF and ΔD traces of DM75 (i) and DM31 (j) treated with 10 μg ml−1 of LRX1LRR–RALF22. k, Quantification of the percentage change in ΔF and ΔD (relative to the pectin-induced change) upon LRX1LRR–RALF22 treatment for the conditions presented in i and j (DM31 + LRX1LRR–RALF22, n = 11 independent experiments and DM75 + LRX1LRR–RALF22, n = 6 independent experiments). The dots indicate individual experiments and the asterisks represent statistical significance (***P < 0.001; for corresponding P values, see Supplementary Table 1).
Fig. 6 |
Fig. 6 |. (LRX1−)RALF22–HG interaction regulates the organization of the pectic RH CW.
ad, Representative images showing the colocalization of PAM1 (>30 galacturonic acid long stretches of block-wise demethylesterified HG) and mCherry–RALF22mature in the RH tip and shank. Longitudinal optical sections of a PAM1- (green) and mCherry–RALF22mature-labelled RH (scale bar, 10 μm), which was fixed while growing. Yellow indicates colocalization in the composite image (a). Close-ups of the RH tip presented in a showing that PAM1 and mCherry–RALF22mature colocalize along the growing dome (scale bar, 2.5 μm) (b). Representative longitudinal optical sections of the shank CW and ROIs showing the presence of overlapping microdomains of demethylesterified HG (PAM1, green) and mCherry–RALF22mature (red) (scale bar, 1 μm) (c). Lateral z-projections of the RH shank CW showing the formation of colocalized PAM1 and mCherry–RALF22mature circumferential rings (scale bar, 5 μm) (d). e, Representative longitudinal optical sections of ralf22–2 RHs labelled with PAM1 (demethylesterified HG), 2F4 (Ca2+-cross-linked demethylesterified HG) and LM20 (methylesterified HG) (scale bar, 10 μm). The asterisks indicate expelled intracellular debris as a result of cell bursting. f, Quantification of the labelling intensities for the PAM1 (ncol-0 = 12 RHs and nralf22–2 = 16 RHs), 2F4 (ncol-0 = 8 RHs and nralf22–2 = 9 RHs) and LM20 epitopes (ncol-0 = 19 RHs and nralf22–2 = 9 RHs) in the ralf22–2 and Col-0 RH CW and the ratio between between tip and shank methylesterified HG abundance (LM20, lower graphs). The box plots represent the median (centre line), 25% and 75% percentiles (limits) and minimum/maximum values (whiskers). The dots indicate individual RHs and the asterisks represent statistical significance (**P < 0.01 and ***P < 0.001; for corresponding P values, see Supplementary Table 1). g, Representative longitudinal optical sections of the tip and shank CW of a surviving PAM1 (green)-labelled lrx1–1/2–1 RH expressing mCherry–RALF22mature (red). Yellow indicates colocalization in the composite frame (scale bar, 5 μm). h, Quantification of the PAM1 (green) and mCherry–RALF22mature (red) CW labelling intensities in the tip and shank of lrx1–1/2–1 × pRALF22::mCherry-RALF22mature (n = 8) and complemented ralf22–2 × pRALF22::mCherry-RALF22mature RHs (n = 14) (top box plots) alongside the tip/shank labelling ratio (lower box plots). The dots indicate individual RHs. Different letters and asterisks represent statistical significance (***P < 0.001; NS indicates P > 0.05; for corresponding P values, see Supplementary Table 1). i, Lateral z-projections of the PAM1-labelled lrx1–1/2–1 × pRALF22::mCherry-RALF22mature RH shank CW showing the fragmented pattern of demethylesterified HG and RALF22 organization (scale bar, 5 μm).
Fig. 7 |
Fig. 7 |. Model of the dual structural and signalling role of RALF22 in the periodic assembly of the RH CW.
a, RALF22, LRX1–RALF22 and methylesterified HG are secreted at the growing RH tip. RALF22 forms a ternary complex with LLG1 and FER, thereby regulating its own secretion and inducing downstream cytosolic calcium signalling and alkalinization of the apical CW. In the CW, PMEs, which have a high pH optimum, catalyse HG demethylesterification, generating anionic HG through the formation of stretches of negatively charged carboxyl groups. RALF22 and LRX1–RALF22 electrostatically interact with poly-anionic demethylesterified HG. This induces HG dewatering and compaction, and the self-assembly of the HG matrix into (LRX1−)RALF22–HG microdomains. b, These microdomains represent periodic circumferential (LRX1−)RALF22–HG rings that originate in the growing tip and arise as a consequence of oscillatory (LRX1−) RALF22 secretion at the tip and apical pH oscillations that catalyze periodic HG demethylesterification. This temporal periodicity is translated towards the spatial periodicity of (LRX1−)RALF22–HG ring assembly. (LRX1−)RALF22–HG rings illustrate highly anisotropic CW expansion, in which the circumferential strain of the rings greatly surpasses the meridional strain, which is a prerequisite for polar RH growth.

References

    1. Kjellén L & Lindahl U Specificity of glycosaminoglycan–protein interactions. Curr. Opin. Struct. Biol. 50, 101–108 (2018). - PubMed
    1. Haas KT, Wightman R, Peaucelle A & Höfte H The role of pectin phase separation in plant cell wall assembly and growth. Cell Surf. 7, 100054 (2021). - PMC - PubMed
    1. Coen E & Cosgrove DJ The mechanics of plant morphogenesis. Science 379, eade8055 (2023). - PubMed
    1. Wilson LA, Deligey F, Wang T & Cosgrove DJ Saccharide analysis of onion outer epidermal walls. Biotechnol. Biofuels 14, 1–14 (2021). - PMC - PubMed
    1. Levesque-Tremblay G, Pelloux J, Braybrook SA & Müller K Tuning of pectin methylesterification: consequences for cell wall biomechanics and development. Planta 242, 791–811 (2015). - PubMed

Publication types

MeSH terms

LinkOut - more resources