. 2024 May;130(8):1402-1413.
doi: 10.1038/s41416-024-02649-z. Epub 2024 Mar 11.

Inhibition of the AURKA/YAP1 axis is a promising therapeutic option for overcoming cetuximab resistance in colorectal cancer stem cells

Affiliations

Inhibition of the AURKA/YAP1 axis is a promising therapeutic option for overcoming cetuximab resistance in colorectal cancer stem cells

Anxo Rio-Vilariño et al. Br J Cancer. 2024 May.

Erratum in

Abstract

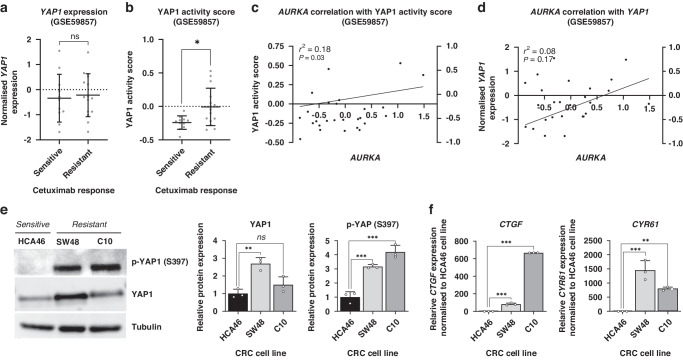
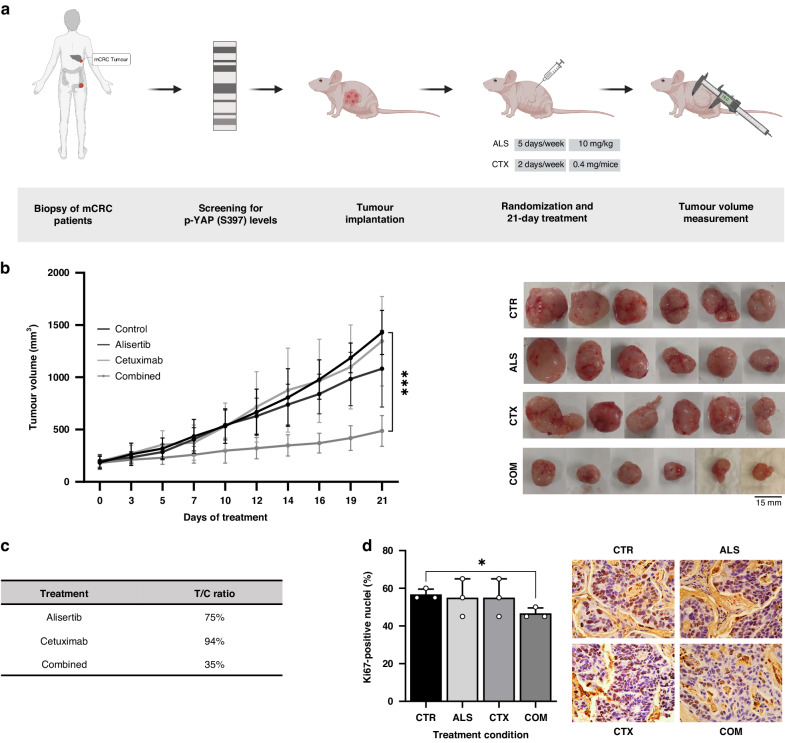
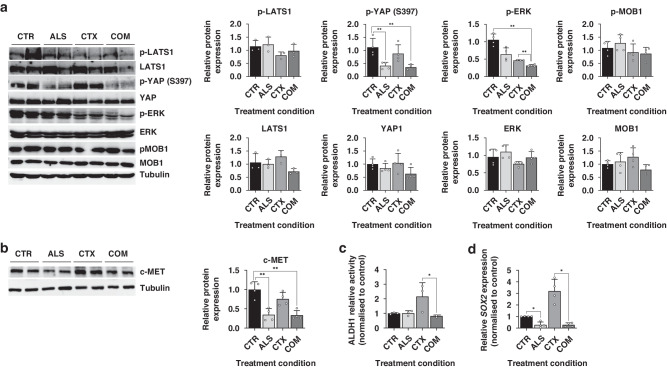
Background: Primary resistance to anti-EGFR therapies affects 40% of metastatic colorectal cancer patients harbouring wild-type RAS/RAF. YAP1 activation is associated with this resistance, prompting an investigation into AURKA's role in mediating YAP1 phosphorylation at Ser397, as observed in breast cancer.

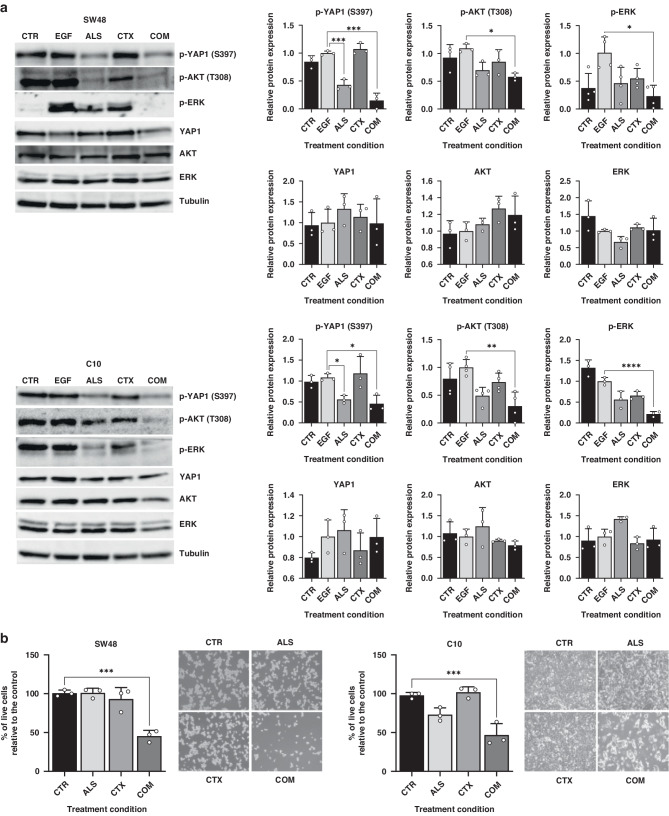
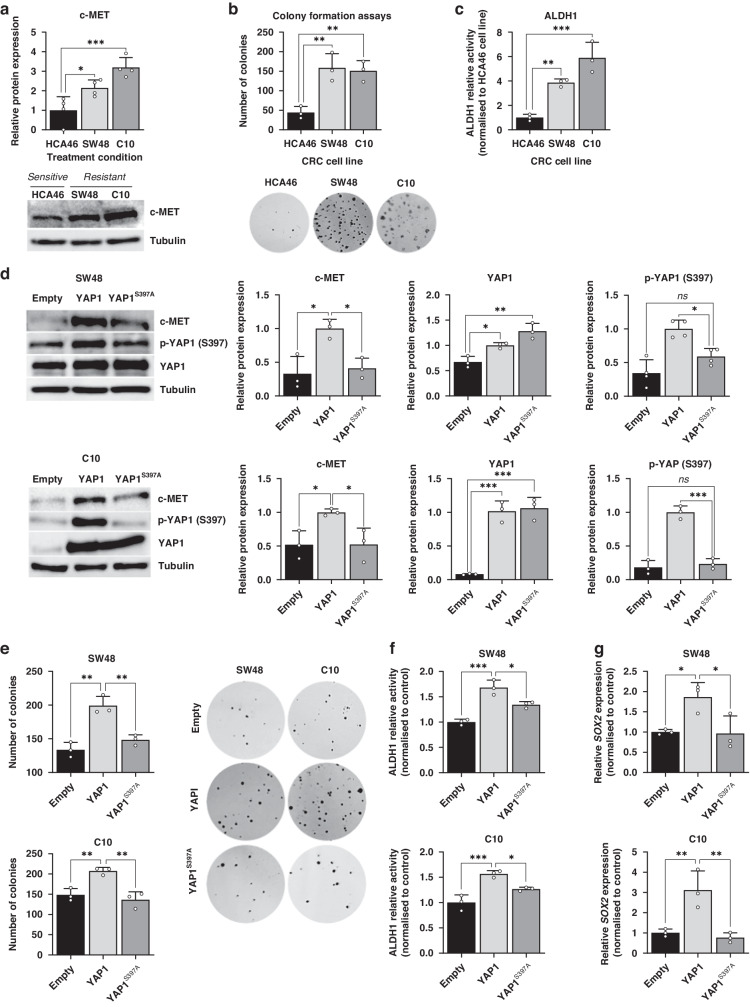
Methods: We used transcriptomic analysis along with in vitro and in vivo models of RAS/RAF wild-type CRC to study YAP1 Ser397 phosphorylation as a potential biomarker for cetuximab resistance. We assessed cetuximab efficacy using CCK8 proliferation assays and cell cycle analysis. Additionally, we examined the effects of AURKA inhibition with alisertib and created a dominant-negative YAP1 Ser397 mutant to assess its impact on cancer stem cell features.

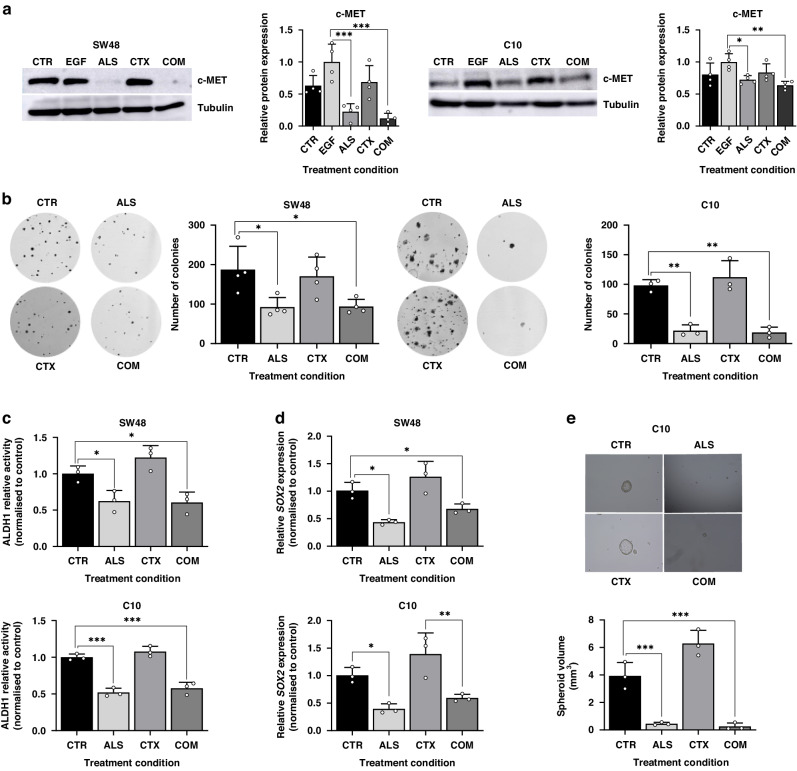
Results: The RAS/RAF wild-type CRC models exhibiting primary resistance to cetuximab prominently displayed elevated YAP1 phosphorylation at Ser397 primarily mediated by AURKA. AURKA-induced YAP1 phosphorylation was identified as a key trigger for cancer stem cell reprogramming. Consequently, we found that AURKA inhibition had the capacity to effectively restore cetuximab sensitivity and concurrently suppress the cancer stem cell phenotype.

Conclusions: AURKA inhibition holds promise as a therapeutic approach to overcome cetuximab resistance in RAS/RAF wild-type colorectal cancer, offering a potential means to counter the development of cancer stem cell phenotypes associated with cetuximab resistance.


Conflict of interest statement

The authors declare no competing interests.

Figures

Fig. 1
Fig. 1. YAP1 activity correlates with Ser397 phosphorylation during primary resistance to cetuximab in CRC cell lines.
a Plot representing the distribution of YAP1 expression in CRC cell lines sensitive to cetuximab compared to the resistant ones ns=non-significant *p < 0.05, two-tailed t-Student’s test. b Plot depicting the distribution of YAP1 activity score in cetuximab-sensitive CRC cell lines compared to the resistant ones. c Correlation analysis between AURKA expression and YAP1 activity score. d Correlation analysis between AURKA and YAP1 expression levels. e Western blot illustrating the basal levels of total amount and phosphorylated YAP1 (Ser397) in CRC cell lines HCA46, SW48 and C10. Tubulin was used as a loading control. Results are plotted as the average ± SD of all the biological replicates and were normalised to the HCA46 cell line (n = 3). ns=non-significant, **p < 0.01, ***p < 0.001, one-way ANOVA. f Gene expression levels of CTGF and CYR61 in CRC cell lines HCA46, SW48 and C10 (n = 3). ns=non-significant, **p < 0.01, ***p < 0.001, one-way ANOVA.
Fig. 2
Fig. 2. AURKA inhibitor alisertib disrupts YAP1 Ser397 phosphorylation and overcomes cetuximab resistance.
a Western blots showing the total and phosphorylated forms of YAP1, AKT and ERK after cetuximab and/or alisertib treatment. Cells were stimulated with 40 ng/mL EGF after both treatments to induce ERK and AKT phosphorylation. Tubulin was used as loading control. Results are plotted as the average ± SD of all the biological replicates and were normalised to the EGF condition (n = 3, n = 4 for p-ERK in SW48 cell line).ns=non-significant, **p < 0.01, ***p < 0.001, one-way ANOVA. b Proliferation levels of SW48 and C10 cell lines treated with cetuximab and alisertib, either alone or in combination, relative to control (n = 3). ns=non-significant, **p < 0.01, ***p < 0.001, one-way ANOVA. CTR Control, ALS Alisertib, CTX Cetuximab, COM Combined.
Fig. 3
Fig. 3. YAP1 exerts specific regulation over c-MET and CSC features through Ser397 phosphorylation.
a Western blot illustrating c-MET levels in the HCA46, SW48 and C10 cell lines. Tubulin was used as a loading control. Results are plotted as the average ± SD of all the biological replicates and were normalized to the HCA46 cell line (n = 3). b Colony formation assay of CRC cell lines HCA46, SW48 and C10.Results are plotted as the average ± SD of all the biological replicates. **p < 0.01 (n = 3), one-way ANOVA. c ALDH1 relative activity in CRC cell lines HCA46, SW48 and C10. Results were normalized to the cetuximab-sensitive HCA46 cell line. Results are plotted as the average ± SD of all the biological replicates. **p < 0.01, ***p < 0.001, one-way ANOVA. d Western blot illustrating c-MET expression in SW48 and C10 cell line transduced with YAP1 and YAP1S397A plasmids, along with the empty vector. Results were normalized to the YAP1-trasduced cell lines. e Colony formation assay of SW48 and C10 cell line transduced with YAP1 and YAP1S397A plasmids, along with the empty vector. Results are plotted as the average ± SD of all the biological replicates, **p < 0.01 (n = 3), one-way ANOVA. f ALDH1 relative activity in SW48 and C10 cell line transduced with YAP1 and YAP1S397A plasmids, along with the empty vector. Results were normalized to the empty vector condition in each cell line. Results are plotted as the average ± SD of all the biological replicates, *p < 0.05, **p < 0.01 (n = 3), one-way ANOVA. g SOX2 gene expression in SW48 and C10 cell line transduced with YAP1 and YAP1S397A plasmids, along with the empty vector. Results were normalized to the empty vector condition in each cell line. Results are plotted as the average ± SD of all the biological replicates *p < 0.05, **p < 0.01 (n = 3), one-way ANOVA.
Fig. 4
Fig. 4. AURKA inhibition disrupts c-MET and CSC properties.
a Western blot illustrating c-MET levels after treatment with alisertib and/or cetuximab in SW48 and C10 cell lines. Tubulin was used as loading control. Results are plotted as the average ± SD of all the biological replicates and were normalized to the EGF condition. *p < 0.05, **p < 0.01, ***p < 0.001 (n = 3), one-way ANOVA (n = 4). b Colony formation assay following treatment with alisertib and/or cetuximab in SW48 and C10 cell lines. Results are plotted as the average ± SD of all the biological replicates. *p < 0.05, **p < 0.01 (n = 3), one-way ANOVA. c. ALDH1 relative activity after treatment with alisertib and/or cetuximab in SW48 and C10 cell lines. Results were normalized to the control condition for each cell line and are plotted as the average± SD of all the biological replicates (n = 3) **p < 0.01, ***p < 0.001, one-way ANOVA. d SOX2 gene expression after treatment with alisertib and/or cetuximab in SW48 and C10 cell lines. Results were normalized to the control condition in each cell line and are plotted as the average ± SD of all the biological replicates (n = 3). *p < 0.05, **p < 0.01 (n = 3), one-way ANOVA. e. Spheroid size (mm3) ability after treatment with alisertib and/or cetuximab in C10 cell line. Results are plotted as the average ± SD of all the biological replicates *p < 0.05, **p < 0.01 (n = 3), one-way ANOVA. CTR Control, ALS Alisertib, CTX Cetuximab, COM Combined.
Fig. 5
Fig. 5. Alisertib effectively overcomes cetuximab resistance in PDX models with high levles of YAP1 phosphorylation.
a Schematic representation outlining the criteria for selecting the tumor for the PDX model based on Western blot screening of YAP1 Ser397 phosphorylation. The tumor with the highest YAP1 phosphorylation levels was chosen for implantation. Mice were treated with 10 mg/kg/day alisertib five days a week and/or 0.4 mg/mice/day cetuximab twice a week for 21 days. Tumor volume and body weight was measured three times a week. Created with BioRender.com b Tumor volume measurement during 21-day treatment with alisertib and/or cetuximab. Representative images of tumors extrated from each group of mice. Results are plotted as the average ± SD of all the tumor volumes for each condition, ***p < 0.001 (n = 6), two-way ANOVA. c T/C (treated/control) ratio of tumors after the 21-day treatment with alisertib, cetuximab and combination. d Ki67 staining of tumors treated with alisertib, cetuximab, the combination of both or neither. *p < 0.05 (n = 3), Welch and Brown-Forsythe ANOVA. CTR Control, ALS Alisertib, CTX Cetuximab, COM Combined.
Fig. 6
Fig. 6. Alisertib reduces c-MET expression levels and impairs CSC features in vivo.
a Western blot analysis of total (n = 3) and phosphorylated (n = 4) levels of LATS-1, YAP1, ERK and MOB-1 in tumors treated with alisertib and/or cetuximab, normalized to the control. Results are plotted as the average ± SD of all the biological replicates, **p < 0.01, one-way ANOVA. Differences in p-ERK expression were compared by using Welch and Brown-Forsythe ANOVA since residuals did not meet the homoscedasticity criteria of one-way ANOVA. b Analysis of SOX2 expression levels in tumors after treatment with alisertib and/or cetuximab, normalized to non-treated tumors. Results are plotted as the average ± SD of all the biological replicates, *p < 0.05 (n = 4), one-way ANOVA. c Assessment of ALDH1 activity after treatment with alisertib and/or cetuximab, normalized to non-treated tumors. Results are plotted as the average ± SD of all the biological replicates, *p < 0.05 (n = 4), one-way ANOVA. d. Evaluation of the gene expression levels of SOX2 in tumors after being treated with alisertib and/or cetuximab. Results are plotted as the average ± SD of all the biological replicates, *p < 0.05 (n = 4), one-way ANOVA.  CTR Control, ALS Alisertib, CTX Cetuximab, COM Combined.

Comment in

References

    1. Kekelidze M, D’Errico L, Pansini M, Tyndall A, Hohmann J. Colorectal cancer: current imaging methods and future perspectives for the diagnosis, staging and therapeutic response evaluation. World J Gastroenterol. 2013;19:8502–14. doi: 10.3748/wjg.v19.i46.8502. - DOI - PMC - PubMed
    1. Wong SF. Cetuximab: an epidermal growth factor receptor monoclonal antibody for the treatment of colorectal cancer. Clin Ther. 2005;27:684–94. doi: 10.1016/j.clinthera.2005.06.003. - DOI - PubMed
    1. Pitts TM, Kulikowski GN, Tan AC, Murray BW, Arcaroli JJ, Tentler JJ, et al. Association of the epithelial-to-mesenchymal transition phenotype with responsiveness to the p21-activated kinase inhibitor, PF-3758309, in colon cancer models. Front Pharm. 2013;4:35. doi: 10.3389/fphar.2013.00035. - DOI - PMC - PubMed
    1. Paschall AV, Yang D, Lu C, Redd PS, Choi JH, Heaton CM, et al. CD133+CD24lo defines a 5-Fluorouracil-resistant colon cancer stem cell-like phenotype. Oncotarget. 2016;7:78698–712. doi: 10.18632/oncotarget.12168. - DOI - PMC - PubMed
    1. Park SH, Jo MJ, Kim BR, Jeong YA, Na YJ, Kim JL, et al. Sonic hedgehog pathway activation is associated with cetuximab resistance and EPHB3 receptor induction in colorectal cancer. Theranostics. 2019;9:2235–51. doi: 10.7150/thno.30678. - DOI - PMC - PubMed

MeSH terms