. 2024 Apr;43(8):1634-1652.
doi: 10.1038/s44318-024-00069-6. Epub 2024 Mar 11.

P. aeruginosa CtpA protease adopts a novel activation mechanism to initiate the proteolytic process

Affiliations

P. aeruginosa CtpA protease adopts a novel activation mechanism to initiate the proteolytic process

Hao-Chi Hsu et al. EMBO J. 2024 Apr.

Abstract

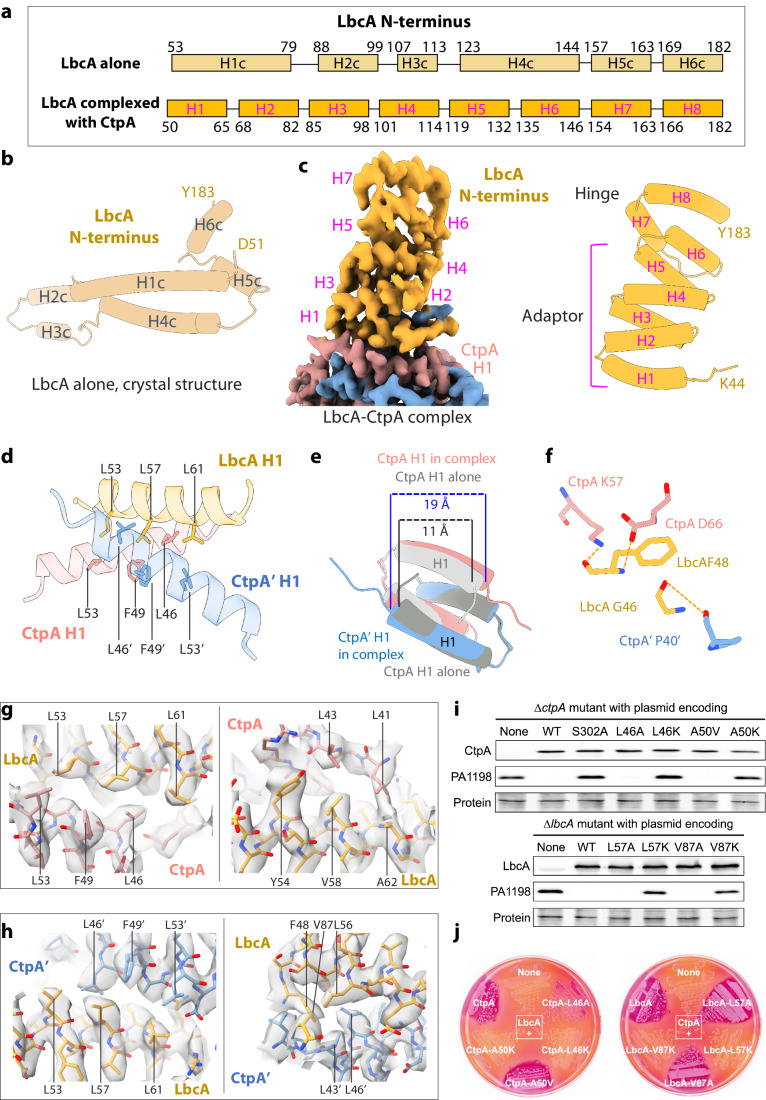
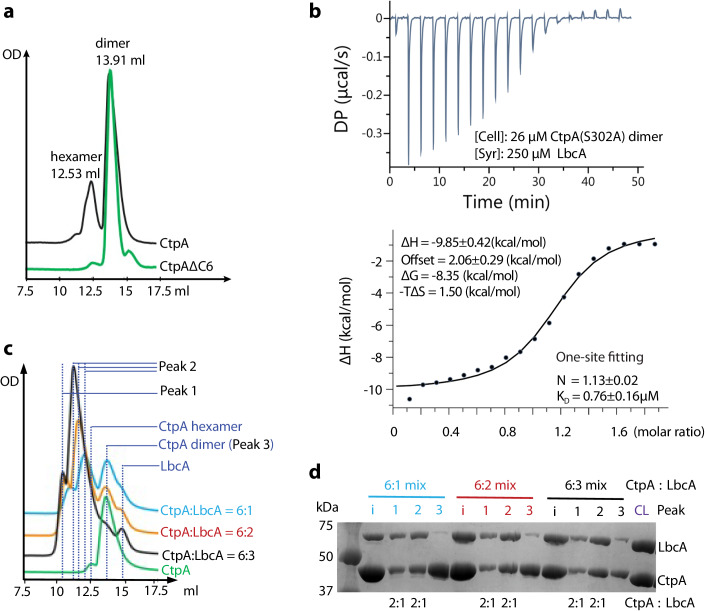
During bacterial cell growth, hydrolases cleave peptide cross-links between strands of the peptidoglycan sacculus to allow new strand insertion. The Pseudomonas aeruginosa carboxyl-terminal processing protease (CTP) CtpA regulates some of these hydrolases by degrading them. CtpA assembles as an inactive hexamer composed of a trimer-of-dimers, but its lipoprotein binding partner LbcA activates CtpA by an unknown mechanism. Here, we report the cryo-EM structures of the CtpA-LbcA complex. LbcA has an N-terminal adaptor domain that binds to CtpA, and a C-terminal superhelical tetratricopeptide repeat domain. One LbcA molecule attaches to each of the three vertices of a CtpA hexamer. LbcA triggers relocation of the CtpA PDZ domain, remodeling of the substrate binding pocket, and realignment of the catalytic residues. Surprisingly, only one CtpA molecule in a CtpA dimer is activated upon LbcA binding. Also, a long loop from one CtpA dimer inserts into a neighboring dimer to facilitate the proteolytic activity. This work has revealed an activation mechanism for a bacterial CTP that is strikingly different from other CTPs that have been characterized structurally.

Keywords: Pseudomonas aeruginosa; Cell Wall; Peptidoglycan Hydrolases; Protease Activation; Protein Complex.


Conflict of interest statement

The authors declare no competing interests.

Figures

Figure 1
Figure 1. Cryo-EM of the CtpA–LbcA complex.
(A) Domain architectures of CtpA and LbcA. (B) SDS-PAGE gel of the purified CtpA–LbcA complex suggesting a 2:1 molar ratio of CtpA and LbcA. (C) Overall EM map of the CtpA–LbcA complex in three orthogonal views—front, side, and back. The dashed red shape marks the region where local refinement was performed to obtain the EM map shown below. (D) Four EM classes in front view revealing that LbcA can bind independently from either front or back to the three CtpA hexamer vertices. Note that LbcA molecules labeled in gray are invisible at the display level but become visible at a lower threshold. (E) Front view of the locally refined EM map consisting of one CtpA dimer, one LbcA adaptor domain, and some residual densities at the CtpA dimer–dimer interface. (F) Front view of the locally refined CtpA–LbcA structure. Source data are available online for this figure.
Figure 2
Figure 2. The hydrophobic interface between CtpA and LbcA.
(A) Comparison of the LbcA N-terminus in the crystal structure of LbcA alone and in the current EM structure in complex with CtpA, showing refolding of this region. (B) The N-terminus of LbcA alone contains six α-helices to form the long extension (PDB ID 7RQF). (C) Left: EM map of the refolded N-terminal adaptor domain of LbcA. Right: Cartoon view of the adaptor domain structure of LbcA complex with CtpA. (D) The LbcA H1 binds between the two H1 at the NDR of the top CtpA dimer. (E) The LbcA H1 binding forces the two CtpA NDR H1 to move apart by 8 Å. (F) Three hydrogen bonds between CtpA H1 and LbcA H1. (G, H) EM map in transparent gray superimposed with the atomic model in sticks showing the hydrophobic interactions between CtpA H1 (pink, G) and CtpA’ H1 (blue, H) with LbcA H1 (orange). (I) Effect of CtpA mutations (top) or LbcA mutations (bottom) on PA1198 substrate degradation in vivo. CtpA, LbcA and PA1198 were detected by immunoblot with polyclonal antisera; loading was monitored by Ponceau S total protein staining of the nitrocellulose membrane used for detection (protein). Data are one representative, but at least three biological replicates of each strain have been analyzed in the laboratory. (J) Bacterial two-hybrid analysis of LbcA–CtpA interactions in E. coli BTH101 grown on MacConkey-maltose agar. On the left, strains contained a plasmid encoding LbcA fused to the C-terminus of Cya-T18 and a second plasmid encoding CtpA fused to the N-terminus of Cya-T25, derivatives with the indicated CtpA mutations, or Cya-T25 only (None). On the right, strains contained a plasmid encoding CtpA fused to the N-terminus of Cya-T25 and a second plasmid encoding LbcA fused to the C-terminus of Cya-T18, derivatives with the indicated LbcA mutations, or Cya-T18 only (None). Data are one representative of two biological replicates. Source data are available online for this figure.
Figure 3
Figure 3. Conformational changes that activate one of the two CtpA.
(A) The front CtpA (salmon) is superimposed with the back CtpA’ (light blue) by aligning their respective protease core domains, revealing drastically different structures. (B, C) Key residues in the CtpA’ such as His-84, Lys-327, and Gln-331 are too far from each other for catalysis, but these residues in CtpA are arranged within catalysis distance. The catalytic residue configuration suggests that the front CtpA is active and the back CtpA’ is inactive. The 5.2 Å distance is due to the S302A mutation. (D) The inactive CtpA’ in the CtpA–LbcA complex resembles CtpA in the CtpA-alone hexamer. (E) Superimposition of the active CtpA with the inactive CtpA in the CtpA-alone hexamer by aligning the core domains. The NDR, PDZ, loop 269–276, and cap in the active CtpA have undergone extensive conformational changes. (F) Cartoon view of the inactive CtpA’ showing an enlarged substrate binding pocket encircled by the H3, cap, core domain, and PDZ. (G) Cartoon view of the active CtpA showing the H3 shifts toward the core domain and pushes the PDZ towards the front. The cap lowers down by 8 Å to narrow down the substrate pocket and bind the substrate peptide. (H) Effect of CtpA mutations on substrate degradation in vivo. CtpA and PA1198 were detected by immunoblot with polyclonal antisera; loading was monitored by Ponceau S total protein staining of the nitrocellulose membrane used for detection (protein). Data are one representative, but at least three biological replicates of each strain have been analyzed in the laboratory. Source data are available online for this figure.
Figure 4
Figure 4. Substrate binding in the active CtpA.
(A) The active CtpA structure in a front and side cartoon view. The bound substrate peptide chain is colored green, and the catalytic mutation S302A is colored red. (B) The EM map of the protease core region. The inactive CtpA’ is in light blue, the active CtpA is in salmon, and the co-purified substrate peptide density is in top view and colored green. (C) A side view of the substrate peptide density superimposed with the seven-alanine atomic model in sticks. (D) The substrate binding with the CtpA substrate tunnel involves multiple backbone H-bonding (dashed cyan lines), resembling that of β-strand interactions. (E) Effect of CtpA mutations on PA1198 substrate degradation in vivo. CtpA and PA1198 were detected by immunoblot with polyclonal antisera; loading was monitored by Ponceau S total protein staining of the nitrocellulose membrane used for detection (protein). Data are one representative, but at least three biological replicates of each strain have been analyzed in the laboratory. Source data are available online for this figure.
Figure 5
Figure 5. The two LbcA conformations of the CtpA–LbcA complex.
(A) Front view of the EM map of the first conformation rendered at a low (left) and high (right) threshold showing the whole LbcA TPR domain. (B) Cartoon front view of the atomic model showing the LbcA TPR is 44 Å above the CtpA in the remote binding mode. (C) Front view of the EM map of the second conformation rendered at a low (left) and high (right) threshold showing the whole LbcA TPR domain. (D) Cartoon front view of the model showing the LbcA TPR is 18 Å above the CtpA in the proximal binding mode. (E) Superimposition of the two conformations by aligning the CtpA dimer region, showing the 22 Å down-shift of the LbcA TPR in the second conformation. (F) Enlarged view of the hinge domain marked by the orange box in (E). The hinge domain rotates 26° to bring the TPR domain down by 22 Å in the second conformation.
Figure 6
Figure 6. Trans regulation between CtpA dimers within the CtpA hexamer.
(A) Front view of the EM map of the threefold symmetric CtpA–LbcA complex. Only the adaptor domain of LbcA is resolved, and the more flexible TPR is averaged out. (B) A side-by-side comparison of the CDR H8 in CtpA-alone hexamer and in LbcA-bound complex, revealing an upward shift of one helical turn by the H8 of the active CtpA, altering the CDR H8–H8 interface. (C) Back view of the 3D EM map of the threefold symmetrical CtpA–LbcA complex. Superimposed on the map are the trans-interacting loops (aa 376–411; TIL) from the three back and inactive CtpA’ (cyan, green, and light blue) shown in cartoons. The red square highlights the TIL loop of the lower left CtpA dimer inserting into a gap between the top CtpA dimer. (D, E) Hydrogen bonding (dashed black lines) and hydrophobic interactions between the active CtpA core (salmon) in one CtpA dimer and the TIL loop from the inactive CtpA’ of the neighboring (lower left) CtpA dimer (cyan). (F) Effect of CtpA TIL loop mutations on substrate degradation in vivo. CtpA and PA1198 were detected by immunoblot with polyclonal antisera; loading was monitored by Ponceau S total protein staining of the nitrocellulose membrane used for detection (protein). Data are one representative, but at least three biological replicates of each strain have been analyzed in the laboratory. (G) Effect of CtpA TIL loop mutations on substrate degradation in vitro. The purified PA1198 served as the substrate for CtpA. Quantification of the relative activity is shown in Appendix Fig. S10. Source data are available online for this figure.
Figure 7
Figure 7. Characterization of the in vitro binding of LbcA to CtpA.
(A) Gel filtration profiles of CtpA and CtpAΔC6 incubated at 30 °C for 15 min. CtpA is eluted primarily as dimers with hexamers as a minor species. (B) Upper panel: ITC by titrating LbcA into CtpA(S302A). Lower panel shows the fitting with the one-site binding mode, showing one LbcA bound to one CtpA dimer. (C) Gel filtration profiles of CtpA mixed at 30 °C for 15 min with an increasing amount of LbcA: with the mixing molar ratios of 6:1, 6:2, and 6:3, respectively. The relatively small peak 1 indicates the formation of a small amount of LbcA3-CtpA6 complex. Note the peak 2 position gradually shifts with increasing amount of LbcA. (D) SDS-PAGE gel of peaks 1, 2, and 3 from gel filtration. Peak 3 is CtpA alone, and peaks 1 and 2 have approximately the same 2:1 molar ratio (CtpA vs LbcA), resembling the 2:1 ratio of purified co-expressed CtpA–LbcA complex that is used as a control (CL). Lanes labeled with i indicate the input mixture as specified at the top (6:1, 6:2, or 6:3 mixtures). Source data are available online for this figure.
Figure 8
Figure 8. A model for the LbcA-substrate dependent activation of CtpA.
(1) The CtpA dimer is in an inactive state before LbcA binding. A substrate associates with membrane-anchored LbcA prior to LbcA binding to the CtpA dimer. C C-terminus. (2) When a substrate-bound LbcA encounters CtpA, the N-terminal adaptor domain of LbcA first attaches to the NDR of CtpA. This interaction leads to shifts of the PDZ and core domains of the CtpA that is on the same side of the bound LbcA. (3) Three LbcA-bound CtpA dimers form a triangular-shaped hexamer via their respective CDR and only one CtpA in a CtpA dimer is activated (red). (4) The substrate approaches the activated CtpA to thread the substrate C-terminus to the substrate binding tunnel by an unknown mechanism. Note the N-terminal linker of two lower LbcAs have been extended to better visualize the CtpA hexamer. The CtpA hexamer is likely held much closer to the outer membrane (three of its known substrates are membrane-attached lipoproteins).

Similar articles

References

    1. Adams PD, Afonine PV, Bunkoczi G, Chen VB, Echols N, Headd JJ, Hung LW, Jain S, Kapral GJ, Grosse Kunstleve RW, et al. The Phenix software for automated determination of macromolecular structures. Methods. 2011;55:94–106. doi: 10.1016/j.ymeth.2011.07.005. - DOI - PMC - PubMed
    1. Anbudurai PR, Mor TS, Ohad I, Shestakov SV, Pakrasi HB. The ctpA gene encodes the C-terminal processing protease for the D1 protein of the photosystem II reaction center complex. Proc Natl Acad Sci USA. 1994;91:8082–8086. doi: 10.1073/pnas.91.17.8082. - DOI - PMC - PubMed
    1. Beebe KD, Shin J, Peng J, Chaudhury C, Khera J, Pei D. Substrate recognition through a PDZ domain in tail-specific protease. Biochemistry. 2000;39:3149–3155. doi: 10.1021/bi992709s. - DOI - PubMed
    1. Blatch GL, Lassle M. The tetratricopeptide repeat: a structural motif mediating protein-protein interactions. Bioessays. 1999;21:932–939. doi: 10.1002/(SICI)1521-1878(199911)21:11<932::AID-BIES5>3.0.CO;2-N. - DOI - PubMed
    1. Borissenko L, Groll M. 20S proteasome and its inhibitors: crystallographic knowledge for drug development. Chem Rev. 2007;107:687–717. doi: 10.1021/cr0502504. - DOI - PubMed

MeSH terms