

Lipidomics reveals new lipid-based lung adenocarcinoma early diagnosis model
- PMID: 38467839
- PMCID: PMC11018865
- DOI: 10.1038/s44321-024-00052-y
Lipidomics reveals new lipid-based lung adenocarcinoma early diagnosis model
Abstract
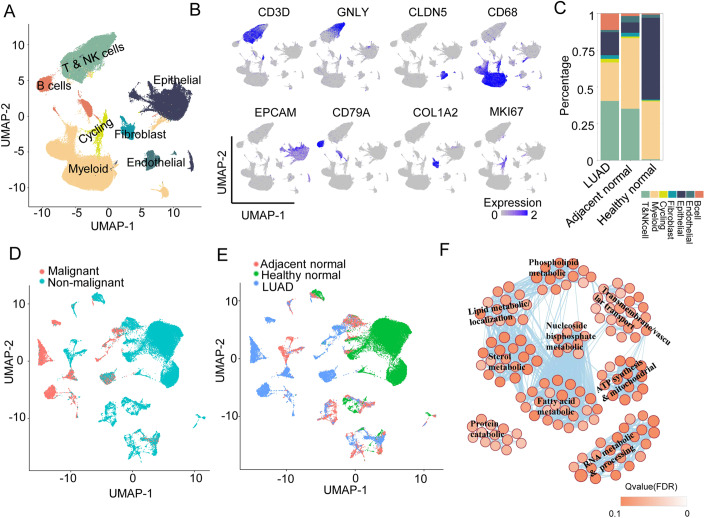
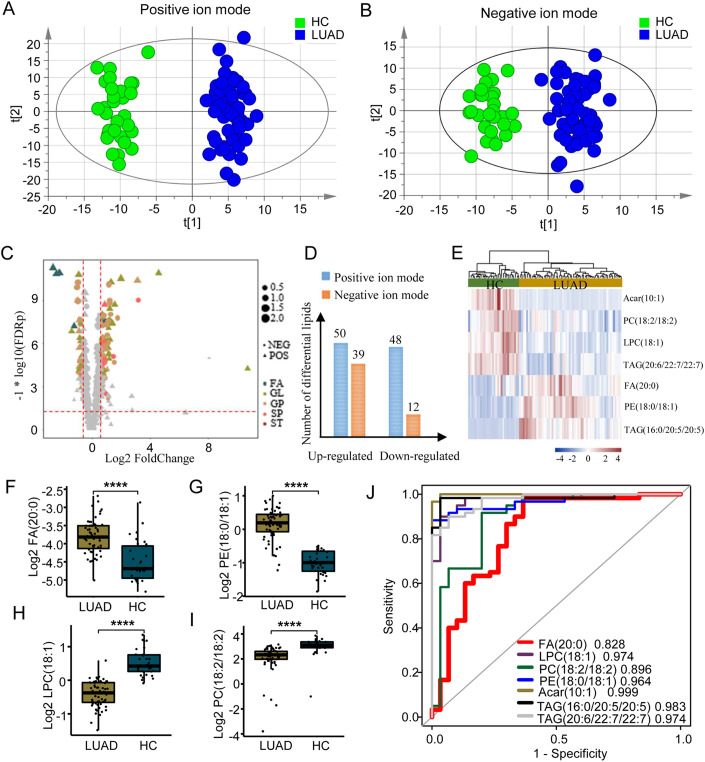
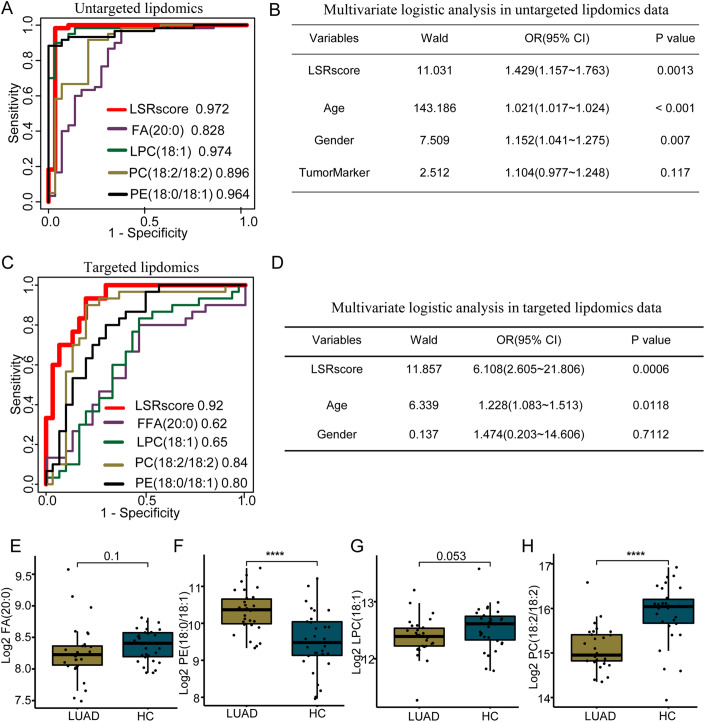
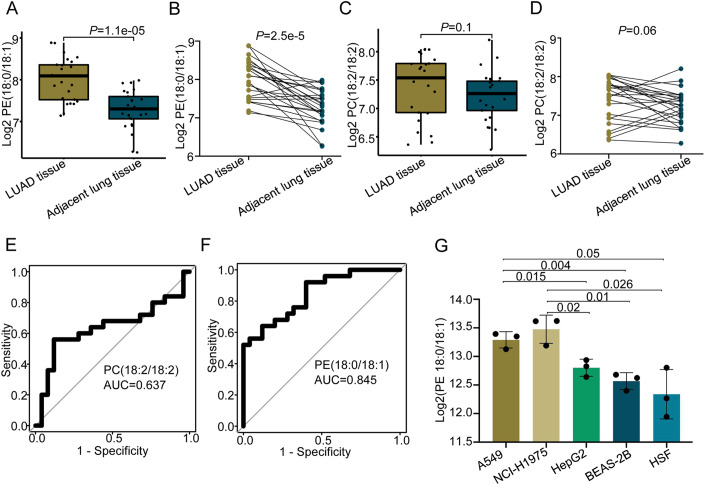
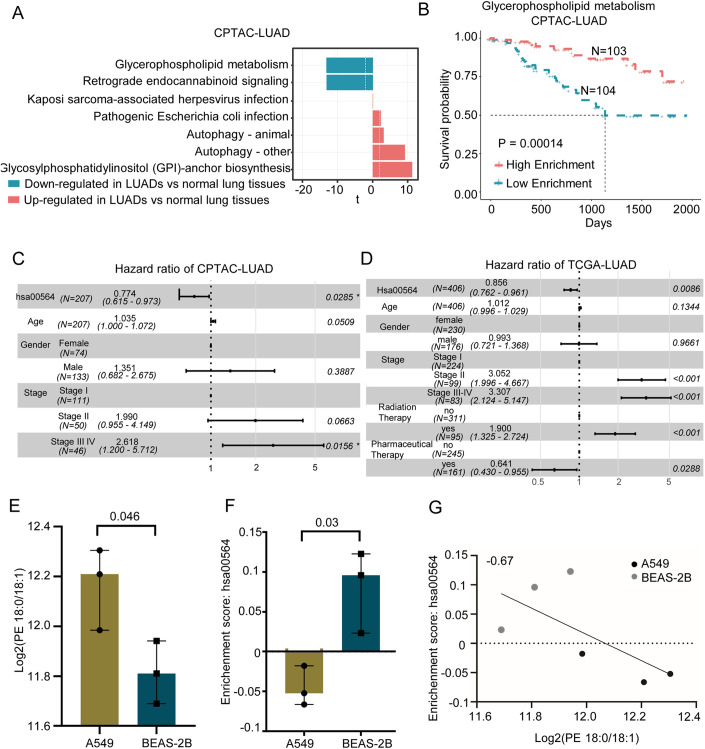
Lung adenocarcinoma (LUAD) continues to pose a significant mortality risk with a lack of dependable biomarkers for early noninvasive cancer detection. Here, we find that aberrant lipid metabolism is significantly enriched in lung cancer cells. Further, we identified four signature lipids highly associated with LUAD and developed a lipid signature-based scoring model (LSRscore). Evaluation of LSRscore in a discovery cohort reveals a robust predictive capability for LUAD (AUC: 0.972), a result further validated in an independent cohort (AUC: 0.92). We highlight one lipid signature biomarker, PE(18:0/18:1), consistently exhibiting altered levels both in cancer tissue and in plasma of LUAD patients, demonstrating significant predictive power for early-stage LUAD. Transcriptome analysis reveals an association between increased PE(18:0/18:1) levels and dysregulated glycerophospholipid metabolism, which consistently displays strong prognostic value across two LUAD cohorts. The combined utility of LSRscore and PE(18:0/18:1) holds promise for early-stage diagnosis and prognosis of LUAD.
Keywords: Cancer Early Diagnosis Model; LSRscore; LUAD; Lipid Metabolism; Lipidomics.
© 2024. The Author(s).
Conflict of interest statement
The authors declare no competing interests.
Figures
Similar articles
-
Lipid metabolism gene-wide profile and survival signature of lung adenocarcinoma.Lipids Health Dis. 2020 Oct 13;19(1):222. doi: 10.1186/s12944-020-01390-9. Lipids Health Dis. 2020. PMID: 33050938 Free PMC article.
-
Transcriptomic landscape based on annotated clinical features reveals PLPP2 involvement in lipid raft-mediated proliferation signature of early-stage lung adenocarcinoma.J Exp Clin Cancer Res. 2023 Nov 23;42(1):315. doi: 10.1186/s13046-023-02877-w. J Exp Clin Cancer Res. 2023. PMID: 37996944 Free PMC article.
-
Development and validation of a robust immune-related prognostic signature in early-stage lung adenocarcinoma.J Transl Med. 2020 Oct 7;18(1):380. doi: 10.1186/s12967-020-02545-z. J Transl Med. 2020. PMID: 33028329 Free PMC article.
-
Clinical Significance and Immunometabolism Landscapes of a Novel Recurrence-Associated Lipid Metabolism Signature In Early-Stage Lung Adenocarcinoma: A Comprehensive Analysis.Front Immunol. 2022 Feb 10;13:783495. doi: 10.3389/fimmu.2022.783495. eCollection 2022. Front Immunol. 2022. PMID: 35222371 Free PMC article.
-
Comprehensive analysis of a novel signature incorporating lipid metabolism and immune-related genes for assessing prognosis and immune landscape in lung adenocarcinoma.Front Immunol. 2022 Aug 25;13:950001. doi: 10.3389/fimmu.2022.950001. eCollection 2022. Front Immunol. 2022. PMID: 36091041 Free PMC article.
Cited by
-
Associations between lipids and lung cancer subtypes.Discov Oncol. 2025 May 2;16(1):656. doi: 10.1007/s12672-025-02450-1. Discov Oncol. 2025. PMID: 40314895 Free PMC article.
-
A global lipid map of severe fever with thrombocytopenia syndrome virus infection reveals glycerophospholipids as novel prognosis biomarkers.mBio. 2024 Dec 11;15(12):e0262824. doi: 10.1128/mbio.02628-24. Epub 2024 Nov 13. mBio. 2024. PMID: 39535228 Free PMC article.
-
DCUN1D5 is a prognostic biomarker and correlated immune infiltrates and glycolysis in lung adenocarcinoma.Sci Rep. 2025 Jan 2;15(1):403. doi: 10.1038/s41598-024-84539-1. Sci Rep. 2025. PMID: 39747313 Free PMC article.
-
Glycolipid Metabolic Disorders, Metainflammation, Oxidative Stress, and Cardiovascular Diseases: Unraveling Pathways.Biology (Basel). 2024 Jul 12;13(7):519. doi: 10.3390/biology13070519. Biology (Basel). 2024. PMID: 39056712 Free PMC article. Review.
-
Is Lipid Metabolism of Value in Cancer Research and Treatment? Part I- Lipid Metabolism in Cancer.Metabolites. 2024 May 29;14(6):312. doi: 10.3390/metabo14060312. Metabolites. 2024. PMID: 38921447 Free PMC article. Review.
References
-
- Bischoff P, Trinks A, Obermayer B, Pett JP, Wiederspahn J, Uhlitz F, Liang X, Lehmann A, Jurmeister P, Elsner A, et al. Single-cell RNA sequencing reveals distinct tumor microenvironmental patterns in lung adenocarcinoma. Oncogene. 2021;40:6748–6758. doi: 10.1038/s41388-021-02054-3. - DOI - PMC - PubMed
MeSH terms
Substances
Grants and funding
- ZLRK202333/Beijing hospital Authority Clinical Medicine Development Special Funding Support
- J.Z./Fundamental Research Funds for the General Universities
- 82202336/National Natural Science Foundation of China
- 2021A1515110619/Guangdong Basic and Applied Basic Research Foundation
- PKU2023LCXQ001/Clinical Medicine Plus X-Young Scholars Project of Peking Universities
LinkOut - more resources
Full Text Sources
Medical
