. 2024 Mar 11;147(1):52.
doi: 10.1007/s00401-024-02706-0.

Comprehensive proteomics of CSF, plasma, and urine identify DDC and other biomarkers of early Parkinson's disease

Affiliations

Comprehensive proteomics of CSF, plasma, and urine identify DDC and other biomarkers of early Parkinson's disease

Jarod Rutledge et al. Acta Neuropathol. .

Abstract

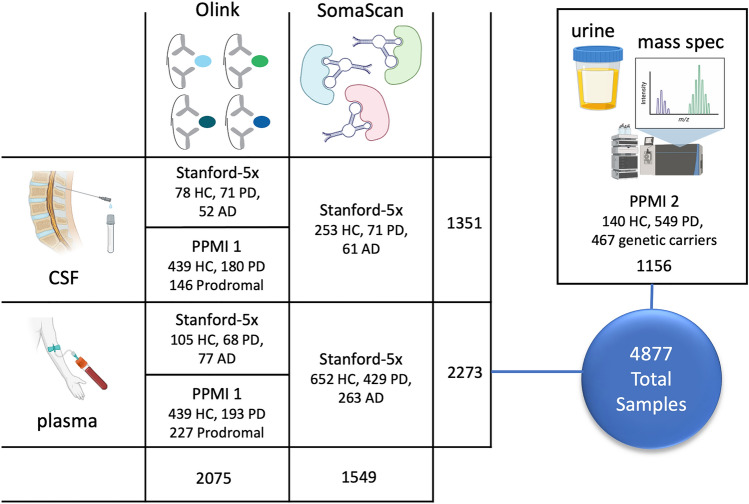
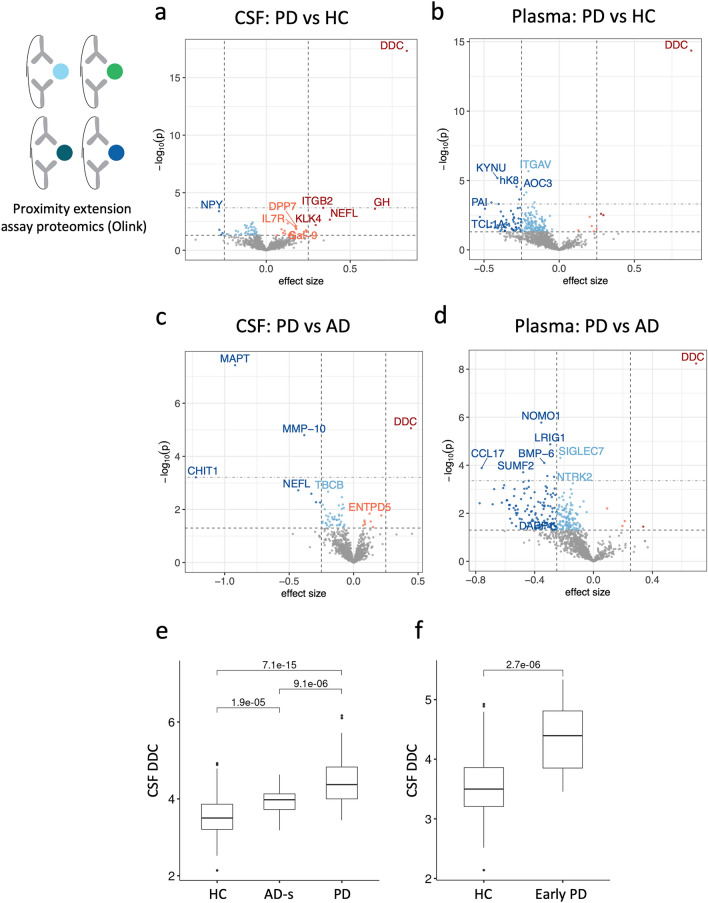
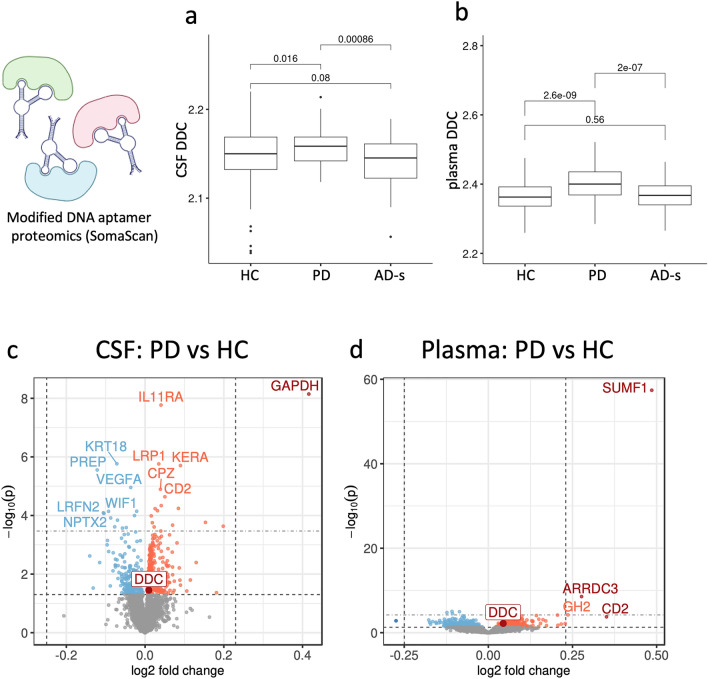
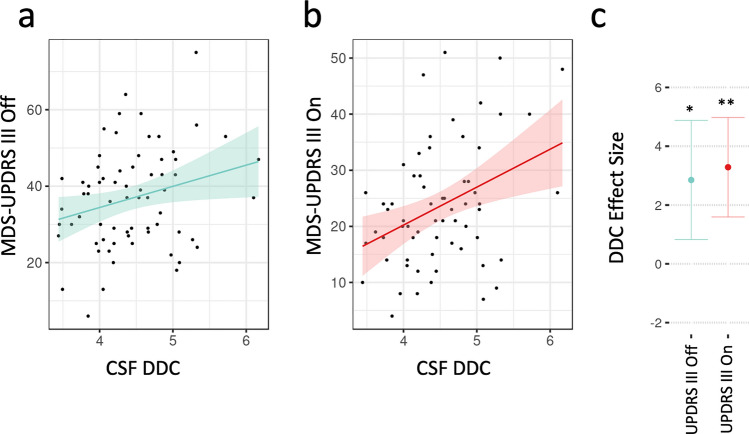
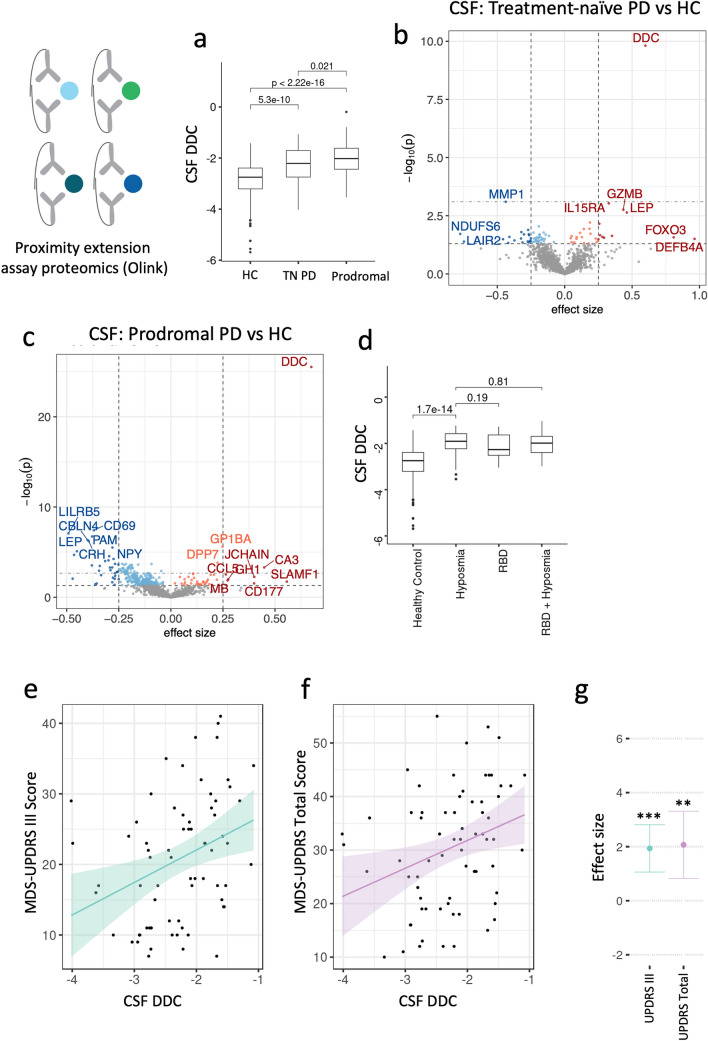
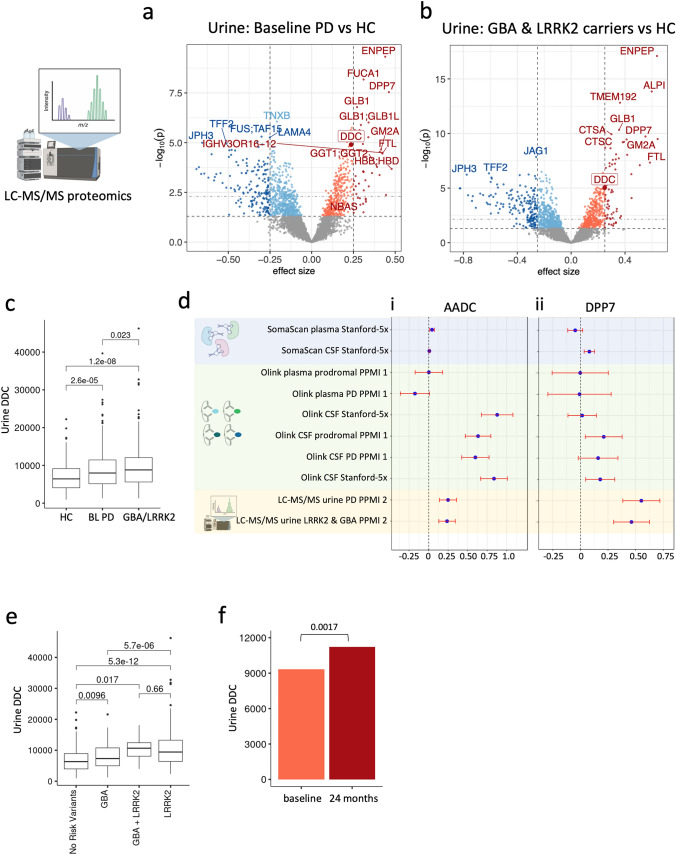
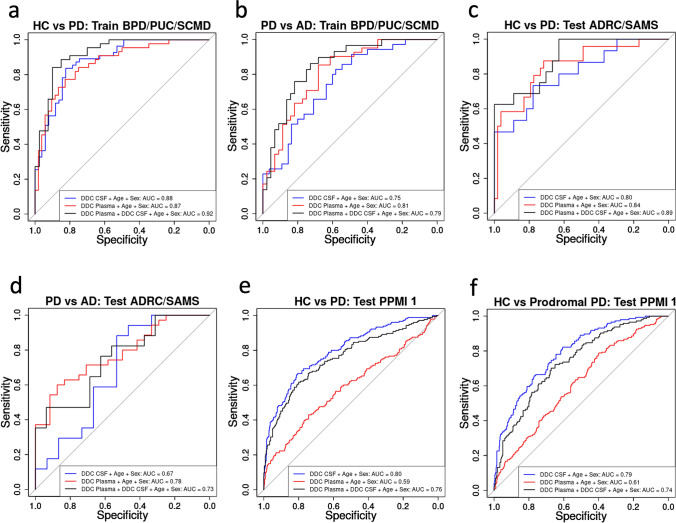
Parkinson's disease (PD) starts at the molecular and cellular level long before motor symptoms appear, yet there are no early-stage molecular biomarkers for diagnosis, prognosis prediction, or monitoring therapeutic response. This lack of biomarkers greatly impedes patient care and translational research-L-DOPA remains the standard of care more than 50 years after its introduction. Here, we performed a large-scale, multi-tissue, and multi-platform proteomics study to identify new biomarkers for early diagnosis and disease monitoring in PD. We analyzed 4877 cerebrospinal fluid, blood plasma, and urine samples from participants across seven cohorts using three orthogonal proteomics methods: Olink proximity extension assay, SomaScan aptamer precipitation assay, and liquid chromatography-mass spectrometry proteomics. We discovered that hundreds of proteins were upregulated in the CSF, blood, or urine of PD patients, prodromal PD patients with DAT deficit and REM sleep behavior disorder or anosmia, and non-manifesting genetic carriers of LRRK2 and GBA mutations. We nominate multiple novel hits across our analyses as promising markers of early PD, including DOPA decarboxylase (DDC), also known as L-aromatic acid decarboxylase (AADC), sulfatase-modifying factor 1 (SUMF1), dipeptidyl peptidase 2/7 (DPP7), glutamyl aminopeptidase (ENPEP), WAP four-disulfide core domain 2 (WFDC2), and others. DDC, which catalyzes the final step in dopamine synthesis, particularly stands out as a novel hit with a compelling mechanistic link to PD pathogenesis. DDC is consistently upregulated in the CSF and urine of treatment-naïve PD, prodromal PD, and GBA or LRRK2 carrier participants by all three proteomics methods. We show that CSF DDC levels correlate with clinical symptom severity in treatment-naïve PD patients and can be used to accurately diagnose PD and prodromal PD. This suggests that urine and CSF DDC could be a promising diagnostic and prognostic marker with utility in both clinical care and translational research.


Conflict of interest statement

J.R., T.W-C, B.L., and K.P. have filed a patent application related to this work. J.R. and T.W-C. are advisors of Teal Omics, where they have an equity stake. K.P. is on the Scientific Advisory Board for Curasen, where she receives consulting fees and stock options. K.P. is on the Scientific Advisory Board for Amprion, where she receives stock options.

Figures

Fig. 1
Fig. 1
Illustration of the study design. Three proteomics platforms (Olink, SomaScan, LC–MS/MS) were used to analyze proteomics from three different biofluids (CSF, plasma, urine) in multiple cohorts (Stanford-5x, PPMI 1, and PPMI 2). CSF and plasma were collected from Stanford-5x and PPMI 1, while urine was collected from PPMI 2. Inset within each square are the number of samples from healthy controls (HC), Parkinson’s disease (PD), and AD-spectrum (AD) participants. The total sample numbers are summed across the rows and columns, providing information on the total number of samples run with each assay and biofluid
Fig. 2
Fig. 2
Differential expression analysis of CSF and plasma from Stanford-5x using Olink proximity extension assay proteomics identifies DDC (DDC) as a top hit in both tissues. Top horizontal dotted line indicates FDR significance threshold, bottom horizontal dotted line indicates raw p-value threshold. Dotted vertical lines indicate an arbitrary 0.25 effect size cutoff for moderate-effect proteins. Significant hits are shaded by effect size cutoff. a Results comparing Parkinson’s disease participants to healthy controls in CSF. b Results comparing Parkinson’s disease participants to Alzheimer’s disease participants in CSF. c Results comparing Parkinson’s disease participants to healthy controls in plasma d Results comparing Parkinson’s disease participants to Alzheimer’s disease participants in plasma. e CSF DDC levels plotted per disease group. f Plasma DDC levels plotted per disease group. Statistics from non-parametric one-way ANOVA test
Fig. 3
Fig. 3
Differential expression analysis of CSF and plasma from Stanford-5x using SomaScan modified DNA aptamer proteomics replicates DDC as a hit and identifies additional top hits GAPDH and SUMF1. a DDC levels in CSF measured by SomaScan aptamer. b DDC levels in plasma measured by SomaScan aptamer. c, d Proteome-wide differential expression analysis. Top horizontal dotted line indicates FDR significance threshold, bottom horizontal dotted line indicates raw p-value threshold. Dotted vertical lines indicate an arbitrary 0.25 effect size cutoff for moderate-effect proteins. Significant hits are shaded by effect size cutoff. DDC is highlighted for comparison to Fig. 1. c Parkinson’s disease participants vs healthy participants in CSF. d Parkinson’s disease participants vs healthy participants in plasma. Statistics in A and B from non-parametric one-way ANOVA test
Fig. 4
Fig. 4
CSF DDC levels are correlated with motor function in PD participants. a Correlation between MDS-UPDRS III Off score and CSF DDC level. b Correlation between MDS-UPDRS III On score and CSF DDC level. c Effect size estimate and p-value of relationship between CSF DDC and UPDRS III scores after controlling for age and sex effects on scores. 95% confidence intervals are shown. MDS-UPDRS III Off p = 0.022. MDS-UPDRS III On p = 0.0017
Fig. 5
Fig. 5
Replication of DDC findings in CSF Olink proteomics from treatment-naïve and prodromal PD participants in the PPMI 1 cohort. a CSF DDC is significantly elevated in treatment-naïve PD (TN PD) and prodromal PD. b, c Proteome-wide differential expression analysis of TN PD vs healthy controls (B) and prodromal PD vs healthy controls (C) identifies DDC as the most differentially expressed protein. Top horizontal dotted line indicates FDR significance threshold, bottom horizontal dotted line indicates raw p-value threshold. Dotted vertical lines indicate an arbitrary 0.25 effect size cutoff for moderate-effect proteins. Significant hits are shaded by effect size cutoff. d CSF DDC is elevated in both hyposmic and RBD prodromal subtypes. Hyposmic participants trend higher but the effect is not significant (p = 0.19). e Correlation between MDS-UPDRS III score and CSF DDC level in treatment-naïve, baseline PD participants in PPMI. f Correlation between MDS-UPDRS total score and CSF DDC level in treatment-naïve, baseline PD participants in PPMI. g Effect size estimate and p value of relationship between CSF DDC and MDS-UPDRS III scores after controlling for age and sex effects on scores. 95% confidence intervals are shown. MDS-UPDRS III p = 0.00018, MDS-UPDRS total score p = 0.0063
Fig. 6
Fig. 6
Liquid chromatography-mass spectrometry-mass spectrometry (LC–MS/MS) proteomics of urine samples in the PPMI 2 cohort. a, b Proteome-wide differential expression analysis of LC–MS/MS urine data in baseline PD vs healthy controls (A) and non-manifesting GBA and LRRK2 carriers vs healthy controls (B) identifies multiple strong hits including DDC. Top horizontal dotted line indicates FDR significance threshold, bottom horizontal dotted line indicates raw p-value threshold. Dotted vertical lines indicate an arbitrary 0.25 effect size cutoff for moderate-effect proteins. Significant hits are shaded by effect size cutoff. c Urine DDC levels are elevated in baseline PD (BL PD) and non-manifesting GBA and LRRK2 carriers. d Summary of differential expression effect sizes across all cohorts and measurement technologies for DDC (i) and DPP7 (ii). Error bars represent 95% confidence intervals. DDC is significantly elevated in all tissues by all measurement technologies, though effect strength varies across technologies and tissues. DDP7 is elevated in CSF and urine across all 3 technologies, with strongest effects in urine. e Urine DDC levels in non-manifesting carrier types. DDC is significantly elevated in both LRRK2 and GBA carriers, and is significantly more elevated in LRRK2 carriers. f Urine DDC levels go up by ~ 10% in LRRK2 carriers with repeated sampling at baseline and 24 months. Statistic is p-value of time covariate in a linear mixed-effects model which accounts for individual differences in baseline DDC levels, as well as age and sex. Bars are mean DDC levels at each timepoint in males of mean study population age
Fig. 7
Fig. 7
Development and testing of logistic regression classifiers to discriminate PD from HC and AD-s participants using DDC levels in CSF and plasma. Receiver operating characteristic (ROC) sensitivity–specificity curves of classifier performance are plotted. Area Under the Curve (AUC) is a measure of classifier performance, with an AUC of 1 being perfect classification with no false positives (perfect specificity) and no false negatives (perfect sensitivity). The diagonal (AUC = 0.5) represents a random guess. Classifier using CSF DDC levels is shown in blue. Classifier using plasma DDC levels is shown in red. Classifier using both CSF and plasma DDC levels shown in black. All classifiers include age and sex as additional covariates. a Performance on PD vs HC in the Stanford-5x sub-cohorts BPD, PUC, and SCMD, which were used to train the model. CSF AUC = 0.88. Plasma AUC = 0.87. Combined AUC = 0.92. b Performance on PD vs AD-s in the Stanford-5x sub-cohorts BPD, PUC, and SCMD. CSF AUC = 0.75. Plasma AUC = 0.81. Combined AUC = 0.79. c Performance on PD vs HC in the held-out test sub-cohorts from Stanford-5x ADRC and SAMS. CSF AUC = 0.80. Plasma AUC = 0.84. Combined AUC = 0.89. d Performance on PD vs AD-s in the held-out test sub-cohorts from Stanford-5x ADRC and SAMS. CSF AUC = 0.67. Plasma AUC = 0.78. Combined AUC = 0.73. e Performance on PD vs HC in the completely independent test cohort PPMI 1. CSF AUC = 0.80. Plasma AUC = 0.59. Combined AUC = 0.76. f Performance on prodromal PD vs HC in the completely independent test cohort PPMI 1. CSF AUC = 0.79. Plasma AUC = 0.61. Combined AUC = 0.74

Similar articles

Cited by

References

    1. Assarsson E, Lundberg M, Holmquist G, Björkesten J, Thorsen SB, Ekman D, et al. Homogenous 96-Plex PEA immunoassay exhibiting high sensitivity, specificity, and excellent scalability. PLoS ONE. 2014;9:e95192. doi: 10.1371/journal.pone.0095192. - DOI - PMC - PubMed
    1. Braak H, Tredici KD, Rüb U, de Vos RAI, Jansen Steur ENH, Braak E. Staging of brain pathology related to sporadic Parkinson’s disease. Neurobiol Aging. 2003;24:197–211. doi: 10.1016/S0197-4580(02)00065-9. - DOI - PubMed
    1. Budd Haeberlein S, Aisen PS, Barkhof F, Chalkias S, Chen T, Cohen S, et al. Two randomized phase 3 studies of aducanumab in early Alzheimer’s disease. J Prev Alzheimers Dis. 2022;9:197–210. doi: 10.14283/jpad.2022.30. - DOI - PubMed
    1. del Campo M, Vermunt L, Peeters CFW, Sieben A, Hok-A-Hin YS, Lleó A, et al. CSF proteome profiling reveals biomarkers to discriminate dementia with Lewy bodies from Alzheimer´s disease. Nat Commun. 2023;14:5635. doi: 10.1038/s41467-023-41122-y. - DOI - PMC - PubMed
    1. Christine CW, Bankiewicz KS, Van Laar AD, Richardson RM, Ravina B, Kells AP, et al. Magnetic resonance imaging–guided phase 1 trial of putaminal AADC gene therapy for Parkinson’s disease. Ann Neurol. 2019;85:704–714. doi: 10.1002/ana.25450. - DOI - PMC - PubMed

Publication types

MeSH terms