. 2024 Mar 11;24(1):330.
doi: 10.1186/s12885-024-11958-8.

ST14 interacts with TMEFF1 and is a predictor of poor prognosis in ovarian cancer

Affiliations

ST14 interacts with TMEFF1 and is a predictor of poor prognosis in ovarian cancer

Xin Nie et al. BMC Cancer. .

Abstract

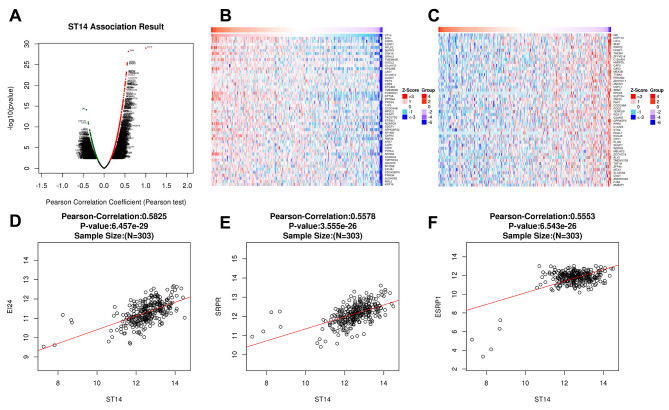
TMEFF1 is a new protein involved in the physiological functions of the central nervous system, and we previously reported TMEFF1 can promote ovarian cancer. ST14 was determined to be involved in the processes of epidermal differentiation, epithelial cell integrity, and vascular endothelial cell migration, etc. The relationship between ST14 and TMEFF1 in the ovary remains unknown. In this study, we detected the expression of ST14 and TMEFF1 in 130 different ovarian cancer tissues through immunohistochemistry. We determined ST14 and TMEFF1 were highly expressed in ovarian cancer, indicating a higher degree of tumor malignancy and a worse prognosis. Tissues significantly expressing ST14 also highly expressed TMEFF1, and the expression of the two proteins was positively correlated. Consistently, immunofluorescence double staining demonstrated the co-localization of ST14 and TMEFF1 in the same region, and immunoprecipitation confirmed the interaction between ST14 and TMEFF1. TMEFF1 expression was also reduced after knocking down ST14 through Western blot. MTT, wound healing and Transwell assays results determined that knockdown of ST14 inhibited proliferation, migration and invasion of ovarian cancer cells in vitro, but the inhibitory effect was restored after adding TMEFF1 exogenous protein. Gene Ontology and Kyoto Encyclopedia of Genes and Genomes pathways analysis showed that ST14 and its related genes were enriched in the processes of epithelial formation, intercellular adhesion, protein localization, and mitosis regulation. We also clarified the kinase, microRNA, and transcription factor target networks and the impact of genetic mutations on prognosis. Overall, high expression of ST14 and TMEFF1 in ovarian cancer predicts higher tumor malignancy and a worse prognosis. ST14 and TMEFF1 co-localize and interact with each other in ovarian cancer. ST14 can regulate TMEFF1 expression to promote proliferation, migration and invasion of ovarian cancer cells. We speculate that the relationship between ST14 and TMEFF1 in ovarian cancer could become a potential target for anti-cancer therapy.

Keywords: Ovarian cancer; Prognostic indicator; Protein interactions; ST14; TMEFF1.


Conflict of interest statement

The authors declare no competing interests.

Figures

Fig. 1
Fig. 1
ST14 expression in different datasets from patients with ovarian cancer. (A) Oncomine analysis of the mRNA expression levels of ST14 genes in different cancers. The differences in expression levels of genes between cancer and normal tissues are concluded. The thresholds are indicated in the colored cells. P < 0.05, fold-change > 2 and gene rank = 10% were considered statistically significant. Red cells represent overexpression of the target gene in tumor tissues compared to normal tissues, while blue cells indicate downregulation of the gene. Gene rank is depicted by the color depth in the cells. (B) UALCAN analysis of the mRNA expression levels of ST14 genes in different cancers. (C) GEPIA analysis of the mRNA expression levels of ST14 genes in different cancers. (D) ST14 DNA copy numbers based on chips for ovarian cancer research in TCGA Ovary. *P < 0.05. (E) Levels of ST14 mRNA in ovarian cancer based on research in the GEPIA websites (red for tumor, black for normal). The boxplot analysis showed the expression level by log2 (TPM + 1) on a log-scale. *P < 0.05. (F) Correlation between ST14 and TMEFF1 expression in ovarian cancer based on the GEPIA website. R = 0.32, ***P < 0.001. (G) The expression of ST14 and TMEFF1 in ovarian malignant tumor tissues and normal tissues detected by western blot. (H) Quantification of TMEFF1 normalized to GAPDH. Data are presented as the mean ± SEM (n = 3 per group). *P < 0.05, **P < 0.01, and ***P < 0.001
Fig. 2
Fig. 2
Levels of ST14 in subgroups of patients with ovarian cancer. Levels of ST14 expression in ovarian cancer patients based on different (A) ages, (B) races, (C) tumor grades, (D) cancer stages, and (E) TP53 methylation statuses. OV, ovarian serous cystadenocarcinoma. *P < 0.05
Fig. 3
Fig. 3
Differentially expressed genes correlated with ST14 in ovarian cancer. (A) Correlations between ST14 and genes differentially expressed in ovarian cancer were assessed by the Pearson test. (B) Genes positively correlated with ST14 in ovarian cancer as heat maps (TOP 50). Red: positively correlated genes. Blue: negatively correlated genes. (C) Genes negatively correlated with ST14 in ovarian cancer as heat maps (TOP 50). (D-F) Correlation between ST14 expression and the expression of EI24 (D), SRPR (E), and ESRP1 (F) based on the Pearson test, shown with a scatter plot (P = 6.457e-29, P = 3.555e-25, P = 6.453e-26, respectively)
Fig. 4
Fig. 4
Significantly enriched GO annotations and KEGG pathways of ST14-co-expressed genes and proteins interacting with ST14 in ovarian cancer. Results were analyzed with Metascape. The top 20 enriched (A) cellular components, (C) biological processes, and (E) molecular functions related to ST14-related genes are shown, with the bar graph colored based on P-values. (B, D, F) Network of GO-enriched terms colored based on the P-value, where terms containing more genes tended to have a more significant P-value. (G) KEGG-enriched terms colored based on P-values. (H) Network of KEGG-enriched terms colored based on the P-value, where terms containing more genes tended to have a more significant P-value. GO, Gene Ontology; KEGG, Kyoto Encyclopedia of Genes and Genomes. (I) PPI analysis using the STRING database. (J) PPI analysis using the GeneMANIA database
Fig. 5
Fig. 5
Analysis of ST14 genetic variations and effect on survival and prognosis of ovarian cancer patients. (A) Mutations in the ST14 gene based on the cBioPortal database. (B) Analyses of genetic variations in ST14 reported in different studies. The variations included mutation (green), amplification (red), and deep deletions (blue). TCGA: The Cancer Genome Atlas. (C-F) Effect of mutations in the ST14 gene on the (C) overall survival (OS), (D) disease-free survival (DFS), (E) disease-specific survival (DSS), and (F) progression-free survival (PFS) of ovarian cancer patients (P > 0.05)
Fig. 6
Fig. 6
Expression and co-localization of ST14 and TMEFF1 in different ovarian tissues. (A) Immunohistochemical staining of ovarian malignant tumors (i, v), borderline tumors (ii, vi), benign tumors (iii, vii), and normal ovarian tissues (vi, viii). ST14 (i-iv) and TMEFF1 (v-viii) staining is shown (original magnification, ×400). (B) Dual-labeled immunofluorescence technology was used to detect the co-localization of ST14 and TMEFF1 in different ovarian tissues. Blue represents the nucleus, red represents ST14, green represents TMEFF1, orange represents the co-localization of ST14 and TMEFF1 (original magnification, ×400). Pearson’s correlation coefficient (Rr) and Manders’ overlap coefficient (R) of the co-localization images: malignant tumors (Rr:0.64, R:0.87), borderline tumors (Rr:0.76,R:0.79), benign tumors (Rr:0.63,R:0.68), and normal ovarian tissues (Rr:0.76,R:0.92)
Fig. 7
Fig. 7
Co-localization and interaction of ST14 and TMEFF1 in ovarian cancer cells, and ST14 regulates the expression of TMEFF1. (A) Dual-labeled immunofluorescence technology was used to detect the co-localization of ST14 and TMEFF1 in ovarian cancer cell. Blue represents the nucleus, red represents ST14, green represents TMEFF1, and orange represents the co-localization of ST14 and TMEFF1 (original magnification, ×600). Pearson’s correlation coefficient (Rr) and Manders’ overlap coefficient (R) of the co-localization images are Rr:0.73, R:0.61. (B-C) The cell lysates of CAOV3, OVCAR3, and SKOV3 cells were immunoprecipitated with an anti-TMEFF1 antibody (B) and anti-ST14 antibody (C), and then, western blotting was performed with an anti-ST14 antibody and anti-TMEFF1 antibody. “Input” is the total cell lysate of CAOV3 cells. “IgG” is the negative control. (D) In the ovarian cancer cell lines CAOV3 and SKOV3, the expression of TMEFF1 decreased after knocking down the ST14 gene. (E) Quantification of ST14 and TMEFF1 normalized to GAPDH. Representative images and accompanying statistical plots are presented. Blank, blank control group, untreated original cells; siST14, ST14 gene knockdown group (through siRNA); NC, negative control group, negative gene (no sequence homology with ST14) knockdown group (through siRNA). Data are presented as the mean ± SEM (n = 3 per group). *P < 0.05, **P < 0.01, and ***P < 0.001
Fig. 8
Fig. 8
Interaction between ST14 and TMEFF1 promotes proliferation, invasion and migration of ovarian cancer. (A, B, E, F) The invasion capacities of ovarian cancer cells (CAOV3 and SKOV3) after downregulation of ST14 protein and addition of recombinant TMEFF1 active protein detected by Transwell assay. Number 1,2,3,4 respectively represents CAOV3-NC, CAOV3-siST14, CAOV3-NC + TMEFF1 and CAOV3-siST14 + TMEFF1; Number 5,6,7,8 respectively represents SKOV3-NC, SKOV3-siST14, SKOV3-NC + TMEFF1 and SKOV3-siST14 + TMEFF1. (C, D, G, H) The migration capacities of ovarian cancer cells (CAOV3 and SKOV3) after downregulation of ST14 protein and addition of recombinant TMEFF1 active protein detected by Wound healing assay. Number 1,2,3,4 respectively represents CAOV3-NC, CAOV3-siST14, CAOV3-NC + TMEFF1 and CAOV3-siST14 + TMEFF1; Number 5,6,7,8 respectively represents SKOV3-NC, SKOV3-siST14, SKOV3-NC + TMEFF1 and SKOV3-siST14 + TMEFF1. (I-J) The proliferation capacities of ovarian cancer cells (CAOV3 and SKOV3) after downregulation of ST14 protein and addition of recombinant TMEFF1 active protein detected by MTT assay. Data are presented as the mean ± SEM (n = 3 per group). *P < 0.05, **P < 0.01, and ***P < 0.001

Similar articles

Cited by

References

    1. Siegel RL, Miller KD, Fuchs HE, Jemal A. Cancer statistics, 2022. Cancer J Clin. 2022;72(1):7–33. doi: 10.3322/caac.21708. - DOI - PubMed
    1. Dalmartello M, La Vecchia C, Bertuccio P, Boffetta P, Levi F, Negri E, Malvezzi M. European cancer mortality predictions for the year 2022 with focus on ovarian cancer. Annals Oncology: Official J Eur Soc Med Oncol. 2022;33(3):330–9. doi: 10.1016/j.annonc.2021.12.007. - DOI - PubMed
    1. Eib DW, Martens GJ. A novel transmembrane protein with epidermal growth factor and follistatin domains expressed in the hypothalamo-hypophysial axis of Xenopus laevis. J Neurochem. 1996;67(3):1047–55. doi: 10.1046/j.1471-4159.1996.67031047.x. - DOI - PubMed
    1. Eib DW, Holling TM, Zwijsen A, Dewulf N, de Groot E, van den Eijnden-van Raaij AJ, Huylebroeck D, Martens GJ. Expression of the follistatin/EGF-containing transmembrane protein M7365 (tomoregulin-1) during mouse development. Mech Dev. 2000;97(1–2):167–71. doi: 10.1016/S0925-4773(00)00426-3. - DOI - PubMed
    1. Chang C, Eggen BJ, Weinstein DC, Brivanlou AH. Regulation of nodal and BMP signaling by tomoregulin-1 (X7365) through novel mechanisms. Dev Biol. 2003;255(1):1–11. doi: 10.1016/S0012-1606(02)00075-1. - DOI - PubMed