

L-shaped association between the GA/HbA1c ratio and all-cause mortality in U.S. adults with NAFLD: a cross-sectional study from the NHANES 1999-2004
- PMID: 38468235
- PMCID: PMC10926622
- DOI: 10.1186/s12902-024-01568-7
L-shaped association between the GA/HbA1c ratio and all-cause mortality in U.S. adults with NAFLD: a cross-sectional study from the NHANES 1999-2004
Abstract
Objective: It is currently unclear whether there is a relationship between the ratio of glycated albumin to hemoglobin A1c (GA/HbA1c) and mortality in individuals diagnosed with nonalcoholic fatty liver disease (NAFLD). The primary objective of the study was to investigate the relationship between the GA/HbA1c ratio and all-cause mortality in adults with NAFLD in the U.S.
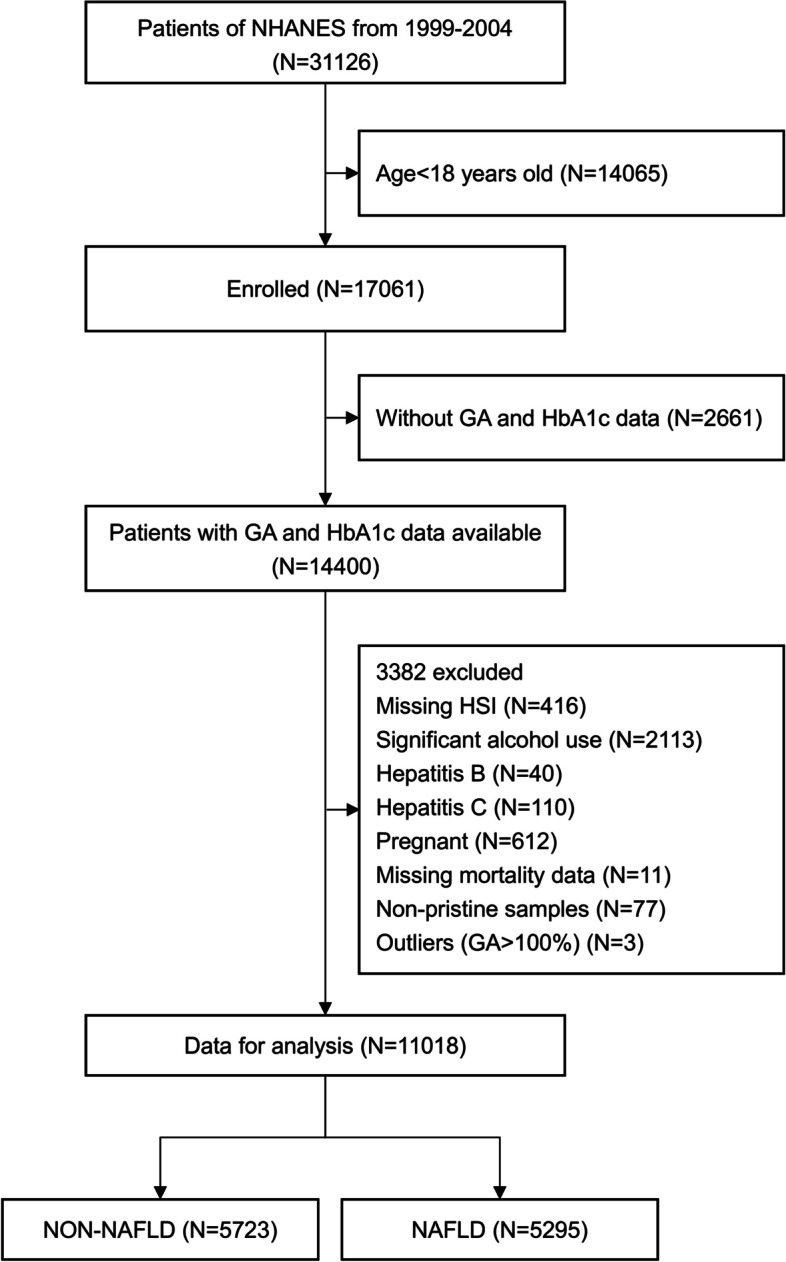
Methods: The investigation included a total of 5,295 individuals aged ≥ 18 years who were diagnosed with NAFLD, these individuals were selected from the National Health and Nutrition Examination Survey conducted between 1999 and 2004. To evaluate the outcomes of death, the researchers relied on National Death Index (NDI) records up to December 31, 2019. To better understand the nonlinear relationship between the GA/HbA1c ratio and mortality among individuals with NAFLD, this study employed both subgroup and sensitivity analyses. Furthermore, Cox proportional hazards models and two-part Cox proportional hazards model were utilized.
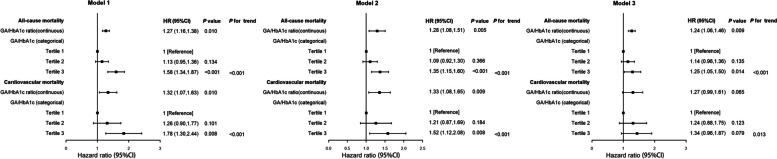
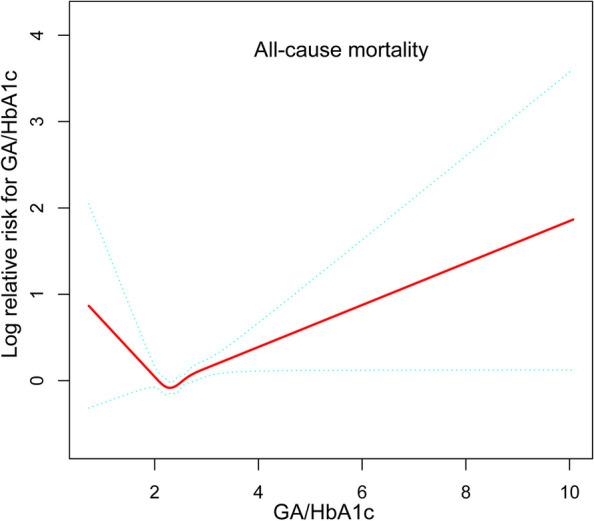
Results: The study included a total of 5,295 adult patients with NAFLD in the U.S. During a median follow-up period of 16.9 years, there were 1,471 recorded deaths, including 419 cardiovascular deaths. After accounting for various factors, a higher GA/HbA1c ratio exhibited a positive and nonlinear association with an increased risk of all-cause mortality in patients with NAFLD. Furthermore, the study revealed an L-shaped relationship between the GA/HbA1c ratio and all-cause mortality, with the inflection point occurring at a GA/HbA1c ratio of 2.21. When the GA/HbA1c ratio exceeded 2.21, each 1-unit increase in the ratio was associated with a 33% increase in the adjusted hazard ratio (HR 1.33; 95% CI 1.14, 1.60) for all-cause mortality.
Conclusions: A nonlinear correlation between the ratio of GA to HbA1c and all-cause mortality was observed in U.S. adults with NAFLD. In addition, an elevated GA/HbA1c ratio was linked to an increased risk of all-cause mortality in these patients.
Keywords: Glycated albumin to HbA1c ratio; Mortality; National Health and Nutrition Examination Survey; Nonalcoholic fatty liver disease.
© 2024. The Author(s).
Conflict of interest statement
The authors declare no competing interests.
Figures

References
-
- Alvarez CS, Graubard BI, Thistle JE, Petrick JL, McGlynn KA. Attributable fractions of nonalcoholic fatty liver disease for mortality in the United States: results from the Third National Health and Nutrition Examination Survey with 27 years of follow-up. Hepatology. 2020;72(2):430–40. doi: 10.1002/hep.31040. - DOI - PMC - PubMed
MeSH terms
Substances
LinkOut - more resources
Full Text Sources
Medical
