

Routine evaluation of HBV-specific T cell reactivity in chronic hepatitis B using a broad-spectrum T-cell epitope peptide library and ELISpot assay
- PMID: 38468254
- PMCID: PMC10929206
- DOI: 10.1186/s12967-024-05062-5
Routine evaluation of HBV-specific T cell reactivity in chronic hepatitis B using a broad-spectrum T-cell epitope peptide library and ELISpot assay
Abstract
Background: The clinical routine test of HBV-specific T cell reactivity is still limited due to the high polymorphisms of human leukocyte antigens (HLA) in patient cohort and the lack of universal detection kit, thus the clinical implication remains disputed.
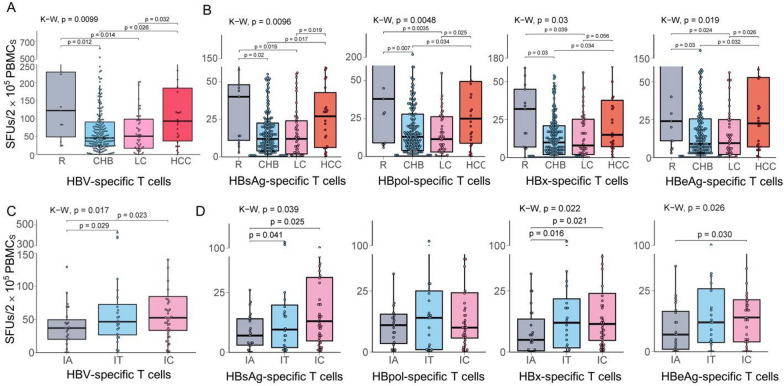
Methods: A broad-spectrum peptide library, which consists of 103 functionally validated CD8+ T-cell epitopes spanning overall HBsAg, HBeAg, HBx and HBpol proteins and fits to the HLA polymorphisms of Chinese and Northeast Asian populations, was grouped into eight peptide pools and was used to establish an ELISpot assay for enumerating the reactive HBV-specific T cells in PBMCs. Totally 294 HBV-infected patients including 203 ones with chronic hepatitis B (CHB), 13 ones in acute resolved stage (R), 52 ones with liver cirrhosis (LC) and 26 ones with hepatocellular carcinoma (HCC) were detected, and 33 CHB patients were longitudinally monitored for 3 times with an interval of 3-5 months.
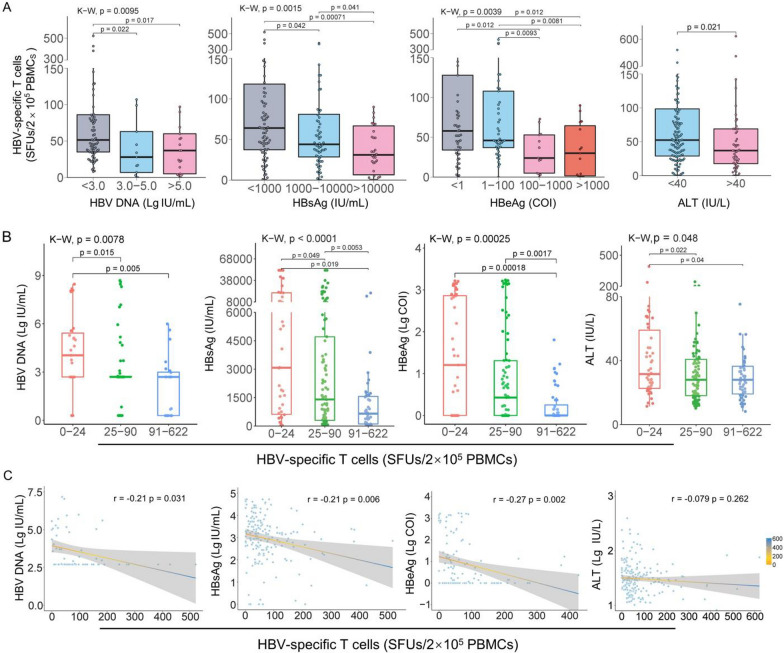
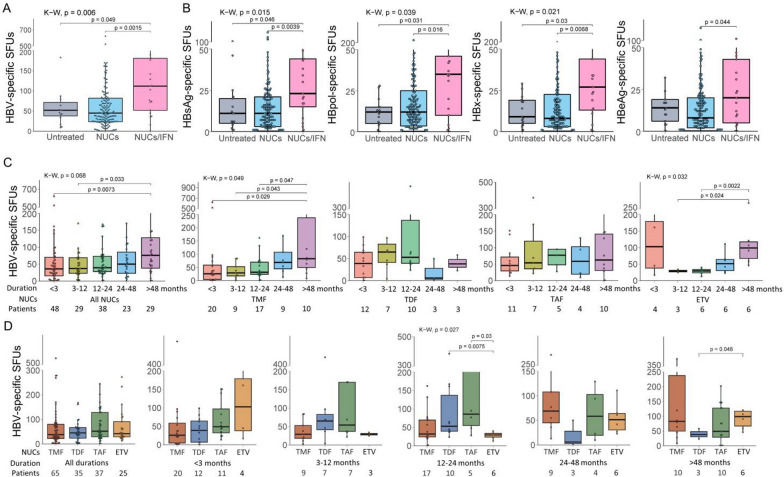
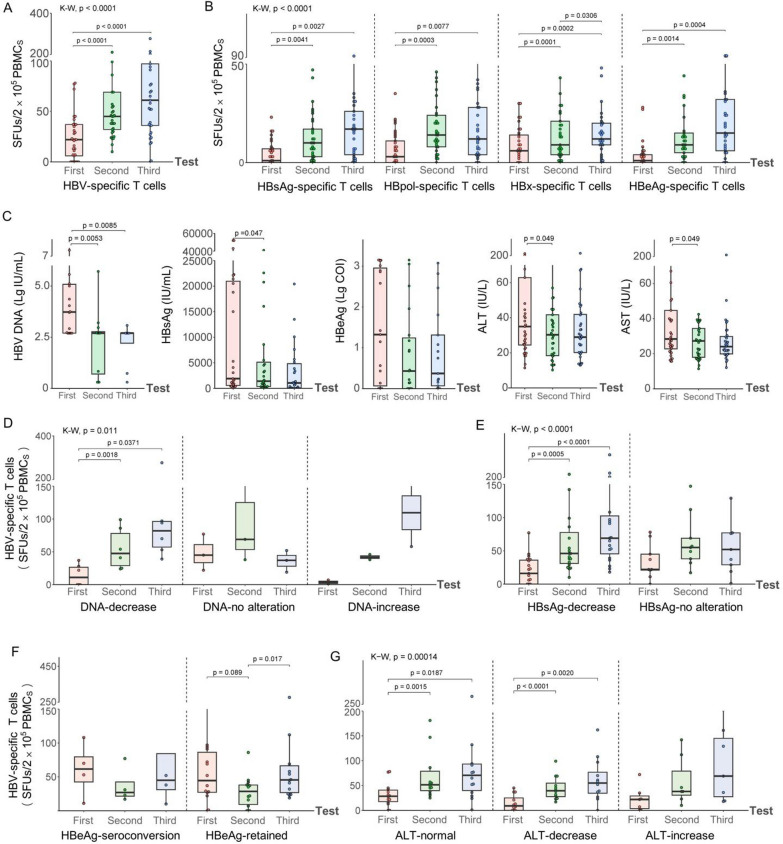
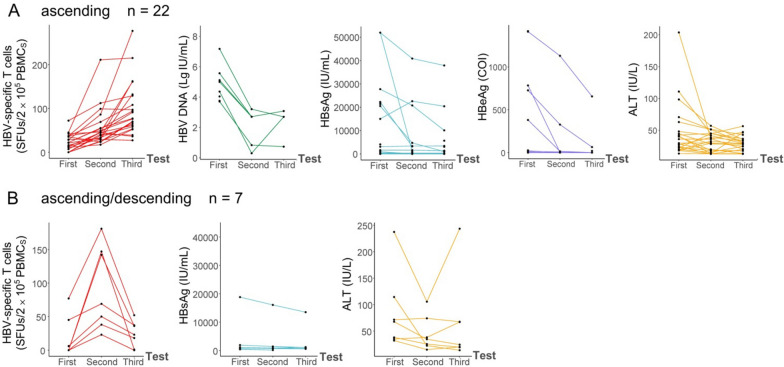
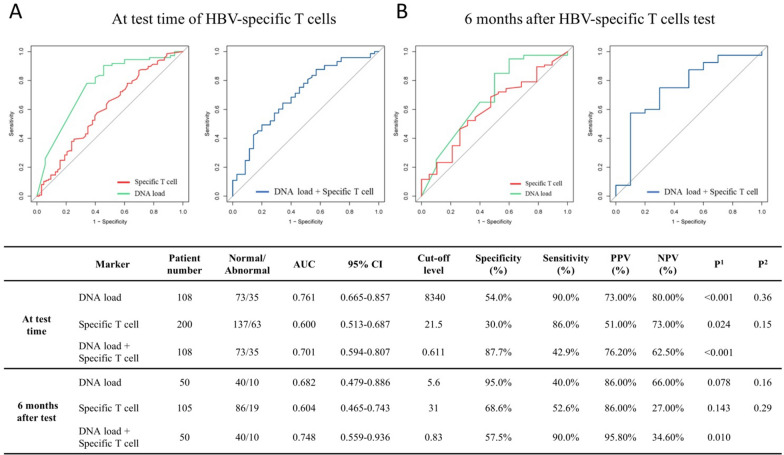
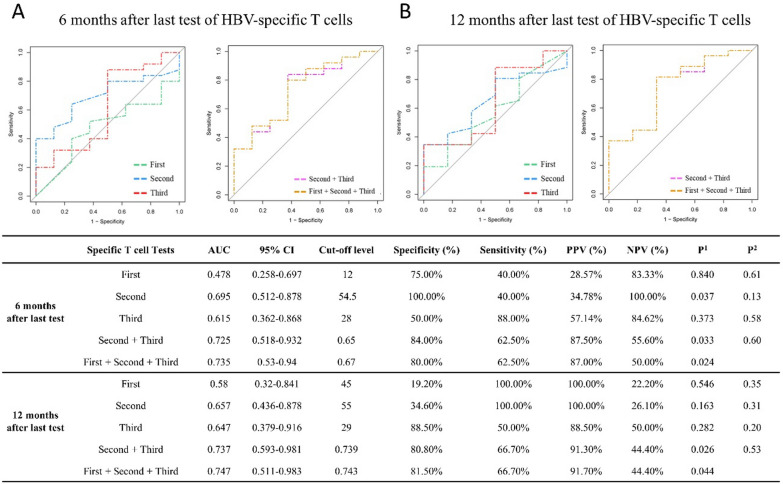
Results: The numbers of reactive HBV-specific T cells were significantly correlated with ALT level, HBsAg level, and disease stage (R, CHB, LC and HCC), and R patients displayed the strongest HBV-specific T cell reactivity while CHB patients showed the weakest one. For 203 CHB patients, the numbers of reactive HBV-specific T cells presented a significantly declined trend when the serum viral DNA load, HBsAg, HBeAg or ALT level gradually increased, but only a very low negative correlation coefficient was defined (r = - 0.21, - 0.21, - 0.27, - 0.079, respectively). Different Nucleotide Analogs (NUCs) did not bring difference on HBV-specific T cell reactivity in the same duration of treatment. NUCs/pegIFN-α combination led to much more reactive HBV-specific T cells than NUCs monotherapy. The dynamic numbers of reactive HBV-specific T cells were obviously increasing in most CHB patients undergoing routine treatment, and the longitudinal trend possess a high predictive power for the hepatitis progression 6 or 12 months later.
Conclusion: The presented method could be developed into an efficient reference method for the clinical evaluation of cellular immunity. The CHB patients presenting low reactivity of HBV-specific T cells have a worse prognosis for hepatitis progression and should be treated using pegIFN-α to improve host T-cell immunity.
Keywords: Antigen-specific T cell; Chronic hepatitis B; ELISpot; T-cell epitopes.
© 2024. The Author(s).
Conflict of interest statement
The authors declare no competing financial interests related to this study.
Figures
Similar articles
-
Comparison of HBV-specific T cell reactivity across the pregnant, postpartum and non-pregnant women with chronic HBV infection.Front Immunol. 2024 Oct 10;15:1461767. doi: 10.3389/fimmu.2024.1461767. eCollection 2024. Front Immunol. 2024. PMID: 39474421 Free PMC article.
-
Screening and Identification of HBV Epitopes Restricted by Multiple Prevalent HLA-A Allotypes.Front Immunol. 2022 Apr 7;13:847105. doi: 10.3389/fimmu.2022.847105. eCollection 2022. Front Immunol. 2022. PMID: 35464415 Free PMC article.
-
[The discrepancy of HBsAg titre and HBV DNA in patients with chronic hepatitis B, HBV-related liver cirrhosis and hepatocellular carcinoma].Zhonghua Gan Zang Bing Za Zhi. 2011 Oct;19(10):743-6. doi: 10.3760/cma.j.issn.1007-3418.2011.10.006. Zhonghua Gan Zang Bing Za Zhi. 2011. PMID: 22409845 Chinese.
-
What can we learn from hepatitis B virus clinical cohorts?Liver Int. 2015 Jan;35 Suppl 1:91-9. doi: 10.1111/liv.12716. Liver Int. 2015. PMID: 25529093 Review.
-
Treatment of chronic hepatitis B: case selection and duration of therapy.J Gastroenterol Hepatol. 2002 Apr;17(4):409-14. doi: 10.1046/j.1440-1746.2002.02767.x. J Gastroenterol Hepatol. 2002. PMID: 11982721 Review.
Cited by
-
Comparison of HBV-specific T cell reactivity across the pregnant, postpartum and non-pregnant women with chronic HBV infection.Front Immunol. 2024 Oct 10;15:1461767. doi: 10.3389/fimmu.2024.1461767. eCollection 2024. Front Immunol. 2024. PMID: 39474421 Free PMC article.
-
Achieving chronic hepatitis B functional cure: Factors and potential mechanisms.Virus Res. 2025 Jan;351:199507. doi: 10.1016/j.virusres.2024.199507. Epub 2024 Dec 13. Virus Res. 2025. PMID: 39662778 Free PMC article.
-
Large-scale screening of HIV-1 T-cell epitopes restricted by 12 prevalent HLA-A allotypes in Northeast Asia and universal detection of HIV-1-specific CD8+ T cells.Front Microbiol. 2025 Feb 11;16:1529721. doi: 10.3389/fmicb.2025.1529721. eCollection 2025. Front Microbiol. 2025. PMID: 40008047 Free PMC article.
References
-
- Xiong S, Zhu D, Liang B, Li M, Pan W, He J, Wang H, Sutter K, Dittmer U, Lu M, Liu D, Yang D, Liu J, Zheng X. Longitudinal characterization of phenotypic profile of T cells in chronic hepatitis B identifies immune markers associated with HBsAg loss. EBioMedicine. 2021;69:103464. doi: 10.1016/j.ebiom.2021.103464. - DOI - PMC - PubMed
-
- Wang Q, Pan W, Liu Y, Luo J, Zhu D, Lu Y, Feng X, Yang X, Dittmer U, Lu M, Yang D, Liu J. Hepatitis B virus-specific CD8+ T cells maintain functional exhaustion after antigen reexposure in an acute activation immune environment. Front Immunol. 2018;9:219. doi: 10.3389/fimmu.2018.00219. - DOI - PMC - PubMed
Publication types
MeSH terms
Substances
Grants and funding
LinkOut - more resources
Full Text Sources
Medical
Research Materials
