. 2024 Mar 11;25(1):69.
doi: 10.1186/s13059-024-03207-9.

A comparison of methods for detecting DNA methylation from long-read sequencing of human genomes

Affiliations

A comparison of methods for detecting DNA methylation from long-read sequencing of human genomes

Brynja D Sigurpalsdottir et al. Genome Biol. .

Abstract

Background: Long-read sequencing can enable the detection of base modifications, such as CpG methylation, in single molecules of DNA. The most commonly used methods for long-read sequencing are nanopore developed by Oxford Nanopore Technologies (ONT) and single molecule real-time (SMRT) sequencing developed by Pacific Bioscience (PacBio). In this study, we systematically compare the performance of CpG methylation detection from long-read sequencing.

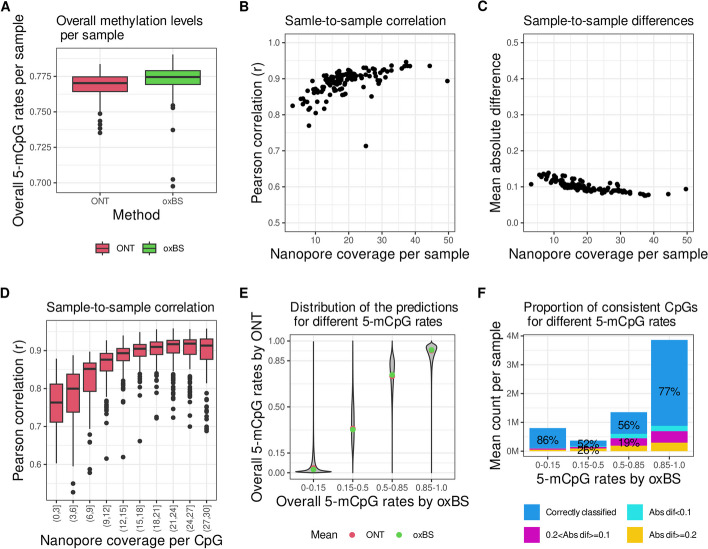
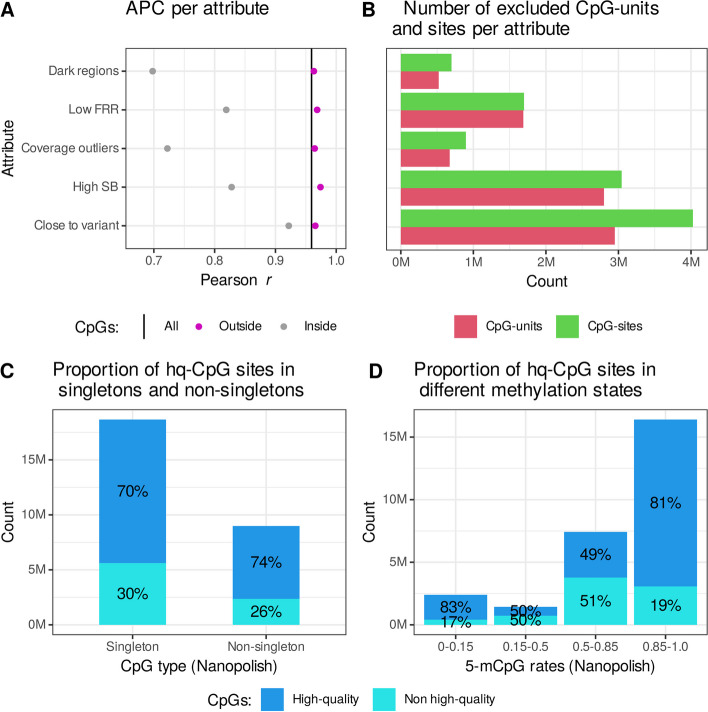
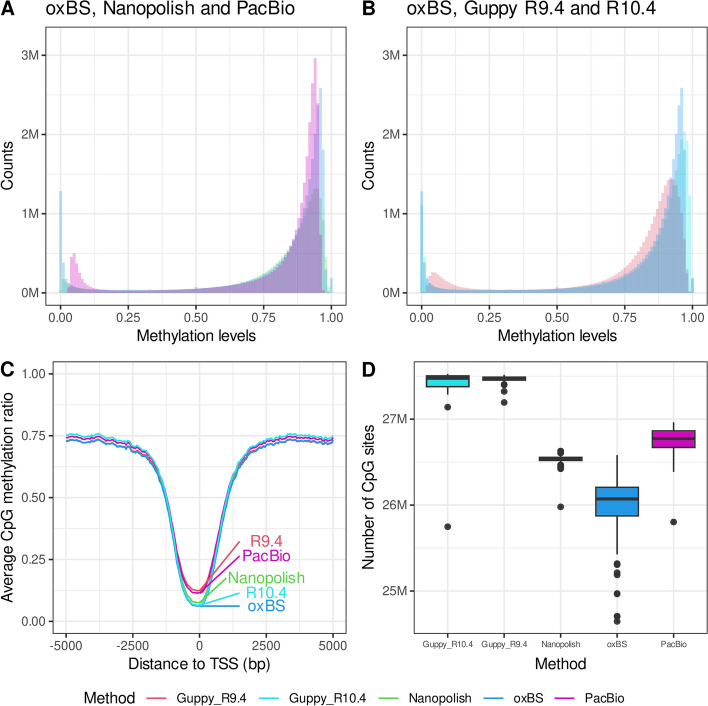
Results: We demonstrate that CpG methylation detection from 7179 nanopore-sequenced DNA samples is highly accurate and consistent with 132 oxidative bisulfite-sequenced (oxBS) samples, isolated from the same blood draws. We introduce quality filters for CpGs that further enhance the accuracy of CpG methylation detection from nanopore-sequenced DNA, while removing at most 30% of CpGs. We evaluate the per-site performance of CpG methylation detection across different genomic features and CpG methylation rates and demonstrate how the latest R10.4 flowcell chemistry and base-calling algorithms improve methylation detection from nanopore sequencing. Additionally, we show how the methylation detection of 50 SMRT-sequenced genomes compares to nanopore sequencing and oxBS.

Conclusions: This study provides the first systematic comparison of CpG methylation detection tools for long-read sequencing methods. We compare two commonly used computational methods for the detection of CpG methylation in a large number of nanopore genomes, including samples sequenced using the latest R10.4 nanopore flowcell chemistry and 50 SMRT sequenced samples. We provide insights into the strengths and limitations of each sequencing method as well as recommendations for standardization and evaluation of tools designed for genome-scale modified base detection using long-read sequencing.


Conflict of interest statement

All authors are employees of deCODE genetics/Amgen, Inc.

Figures

Fig. 1
Fig. 1
Nanopore sequencing and oxBS performance in the same DNA samples. The consistency in 5-mCpG rates measured by nanopore sequencing and oxBS in DNA samples isolated from the same 132 individuals was estimated by the following: A The overall measurement of 5-mCpG rates in each of the 132 DNA samples measured by ONT (red) and oxBS (green), Y-axis is limited to (0.7,0.8). The center line (solid black) shown in each box represents the median; the box limits represent the upper and lower quartiles; the whiskers represent 1.5 × interquartile range. B The Pearson r correlation coefficient, y-axis, and C mean of the absolute differences in 5-mCpG rates of each CpG, y-axis, with respect to nanopore sequencing coverage in each sample on the x-axis. Panels D, E, and F analyze sites that have > 25 × coverage in oxBS. D CpG coverage underlying the 5-mCpG rates, i.e., the number of sequences that were used to compute the 5-mCpG rate for a given CpG, in nanopore sequenced samples, x-axis, influences the consistency (Pearson r), y-axis, with 5-mCpG rates measured with high coverage by oxBS. The y-axis is limited to (0.5, 1) E CpG rates in nanopore (y-axis) and oxBS (x-axis, binned). The mean is represented with red (ONT) and green (oxBS). F Number (y-axis, unit = million CpGs) of correctly classified (blue) by nanopore sequencing in a sample-to-sample comparison. Incorrectly classified CpGs are colored according to the absolute difference in 5-mCpG rates (color legend)
Fig. 2
Fig. 2
The quality of 5-mCpG rate measurements by DNA sequence attributes. A APC estimates (x-axis), for CpG sites located outside (pink) and inside (gray) of DNA sequence attributes, y-axis, and the APC estimates based on all CpGs (vertical black line). B The number of CpG units (red) and sites (green), x-axis, found inside of each attribute, y-axis. C The proportion of high-quality (dark blue) and non-high-quality (light blue) CpG units among singletons and non-singletons, x-axis. D The proportion of high-quality and non-high-quality CpG units within each methylation state category, x-axis, defined by binning the mean of 5-mCpG rates measured by Nanopolish
Fig. 3
Fig. 3
Comparison of CpG methylation detection by method. CpG methylation rates (ranging from 0 to 1) averaged across individuals yield the expected bimodal distribution seen in oxBS data for A oxBS, Guppy R9.4, and R10.4 and B oxBS, PacBio, and Nanopore. The units on y-axis are millions (M). C CpG methylation rates averaged in 50-bp bins relative to transcription start sites (TSSs) of genes expressed in whole blood. D Number of CpGs called by each method. For Nanopolish, we count all CpGs within a CpG unit. Note that the y-axis is limited from 24.5 to 27.7 M (millions). The center line (solid black) shown in each box represents the median; the box limits represent the upper and lower quartile; the whiskers represent the 1.5 × interquartile range

References

    1. Luo C, Hajkova P, Ecker JR. Dynamic DNA methylation: In the right place at the right time. Science. 2018;361:1336–40. doi: 10.1126/science.aat6806. - DOI - PMC - PubMed
    1. Kaluscha S, Domcke S, Wirbelauer C, Stadler MB, Durdu S, Burger L, et al. Evidence that direct inhibition of transcription factor binding is the prevailing mode of gene and repeat repression by DNA methylation. Nat Genet. 2022;54(12):1895–1906. doi: 10.1038/s41588-022-01241-6. - DOI - PMC - PubMed
    1. Borgel J, Guibert S, Li Y, Chiba H, Schübeler D, Sasaki H, et al. Targets and dynamics of promoter DNA methylation during early mouse development. Nat Genet. 2010;42(12):1093–100. doi: 10.1038/ng.708. - DOI - PubMed
    1. Butz S, Schmolka N, Karemaker ID, Villaseñor R, Schwarz I, Domcke S, et al. DNA sequence and chromatin modifiers cooperate to confer epigenetic bistability at imprinting control regions. Nat Genet. 2022;54(11):1702–10. doi: 10.1038/s41588-022-01210-z. - DOI - PMC - PubMed
    1. Tost J, Gut IG. Analysis of gene-specific DNA methylation patterns by pyrosequencing technology. Methods Mol Biol. 2007;373:89–102. - PubMed

LinkOut - more resources