. 2024 Mar 12;22(1):58.
doi: 10.1186/s12915-024-01846-9.

Differentiation is accompanied by a progressive loss in transcriptional memory

Affiliations

Differentiation is accompanied by a progressive loss in transcriptional memory

Camille Fourneaux et al. BMC Biol. .

Abstract

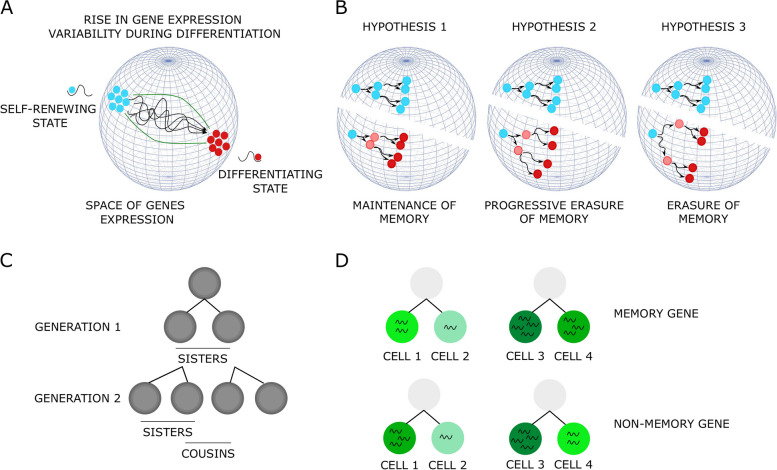
Background: Cell differentiation requires the integration of two opposite processes, a stabilizing cellular memory, especially at the transcriptional scale, and a burst of gene expression variability which follows the differentiation induction. Therefore, the actual capacity of a cell to undergo phenotypic change during a differentiation process relies upon a modification in this balance which favors change-inducing gene expression variability. However, there are no experimental data providing insight on how fast the transcriptomes of identical cells would diverge on the scale of the very first two cell divisions during the differentiation process.

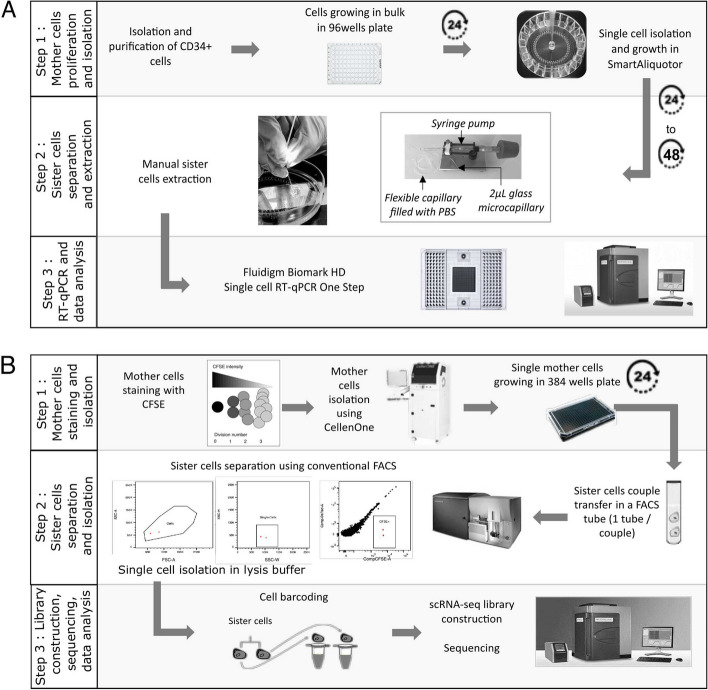
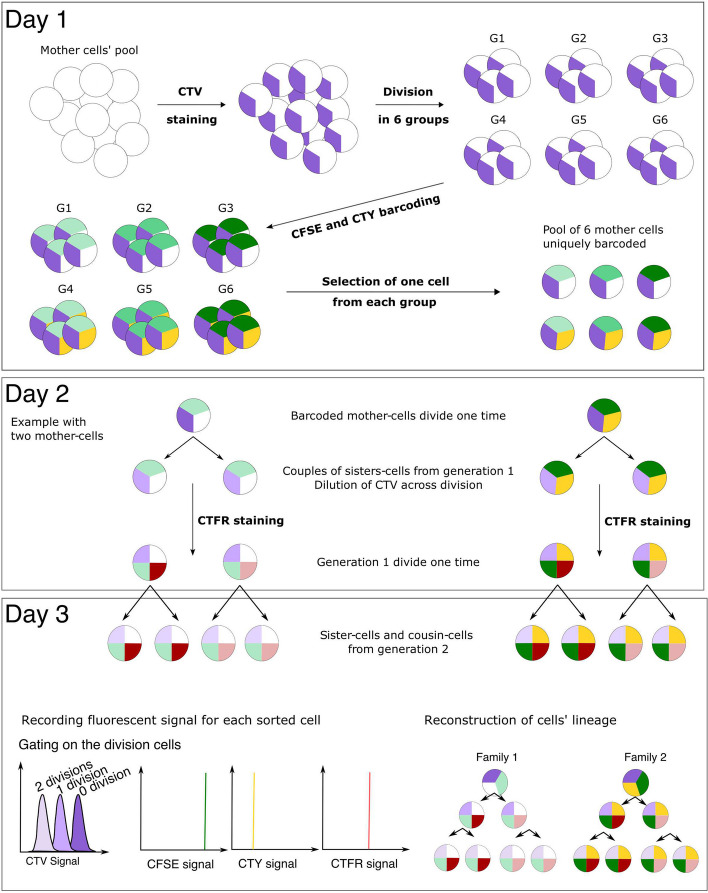
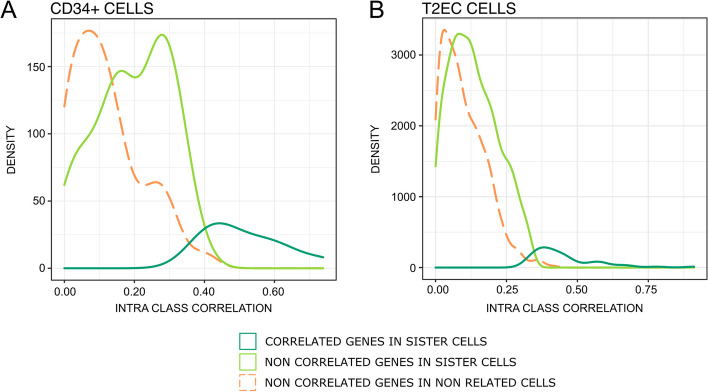
Results: In order to quantitatively address this question, we developed different experimental methods to recover the transcriptomes of related cells, after one and two divisions, while preserving the information about their lineage at the scale of a single cell division. We analyzed the transcriptomes of related cells from two differentiation biological systems (human CD34+ cells and T2EC chicken primary erythrocytic progenitors) using two different single-cell transcriptomics technologies (scRT-qPCR and scRNA-seq).

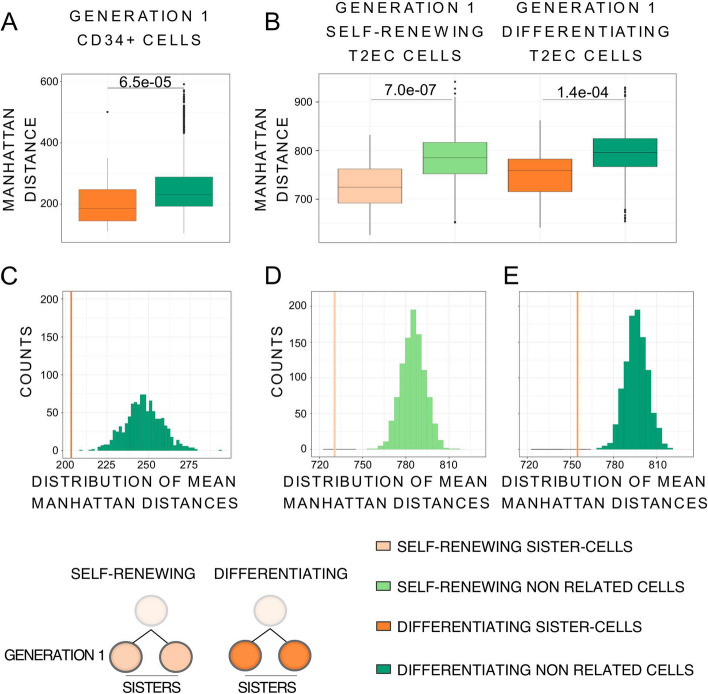
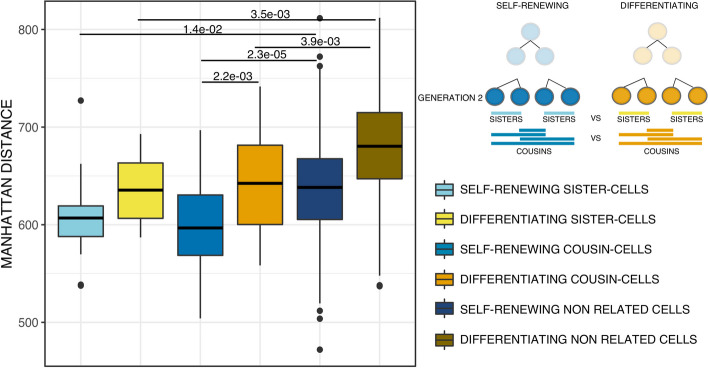
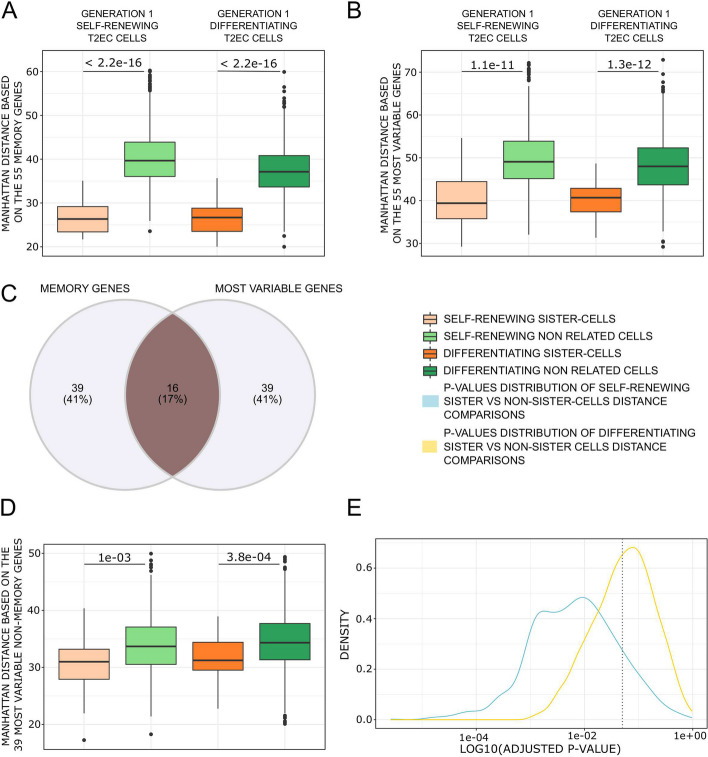
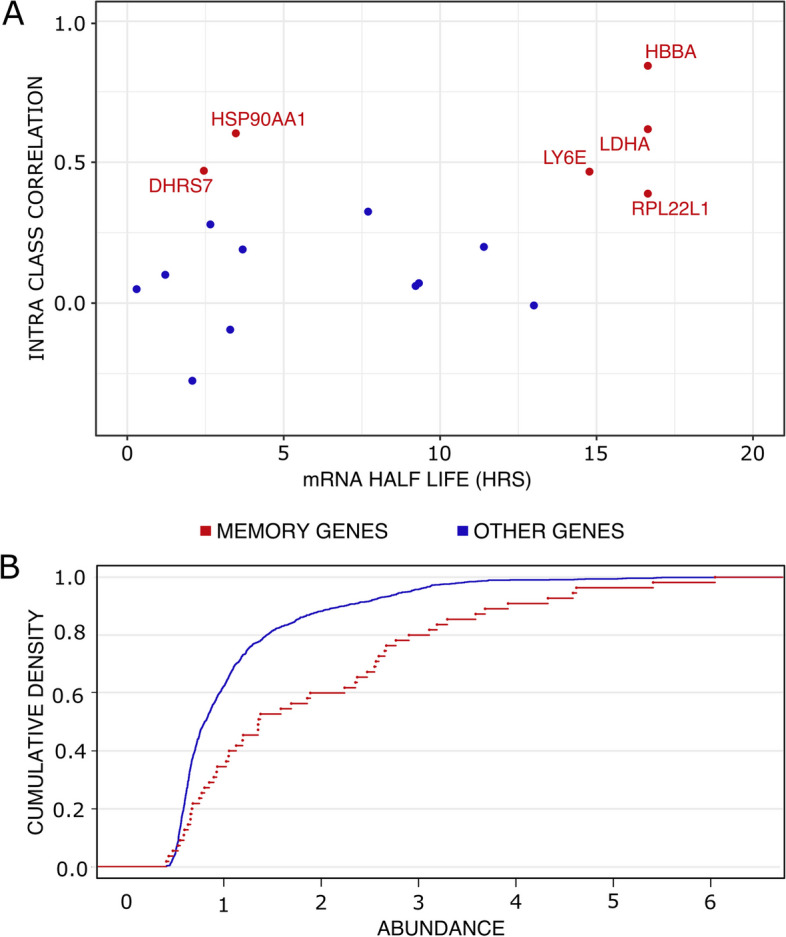
Conclusions: We identified that the gene transcription profiles of differentiating sister cells are more similar to each other than to those of non-related cells of the same type, sharing the same environment and undergoing similar biological processes. More importantly, we observed greater discrepancies between differentiating sister cells than between self-renewing sister cells. Furthermore, a progressive increase in this divergence from first generation to second generation was observed when comparing differentiating cousin cells to self renewing cousin cells. Our results are in favor of a gradual erasure of transcriptional memory during the differentiation process.

Keywords: Cell differentiation; Gene expression variability; Sister cells; Transcriptional memory; Transcriptome.


Conflict of interest statement

The authors declare that they have no competing interests.

Figures

Fig. 1
Fig. 1
Representation of the concepts used in this study. (A) Schematic representation of a dynamic differentiation process. If one assumes that cells are dots moving in a gene expression space (sphere), then one can represent cells in a 3D (i.e. 3 genes) space. Self-renewing cells (blue cells) display some micro-heterogeneity, as well as differentiating cells (red cells). The differentiation process is accompanied by an increase in cell-to-cell variability (i.e. macro-heterogeneity) that allows the cells to escape locally attractive state and attain a new differentiated state [–25]. (B) Three possible hypotheses on transcriptional memory behavior during a differentiation process (see text for details). (C) The type of genealogical information that was made available by dedicated methods in this paper. (D) Schematic description of a memory gene (upper) and a non-memory gene (lower). In the case of a memory gene, the geometric distance between the sister-cells 1 and 2 is of 2 minus 1, that is 1. The distance between the sister-cells 3 and 4 is of 4 minus 3, that is also 1. The mean distance for the memory gene between all sister-cells is therefore of 1, whereas the mean distance for the non-memory gene between all sister-cells is of 2 in this example
Fig. 2
Fig. 2
General workflows developed to generate, follow and separate generation 1 sister-cells from CD34+ (A - manual strategy) or T2EC (B - cytometry-based strategy) mother cells. See text and Methods for details
Fig. 3
Fig. 3
General labelling strategy for generation 2 T2EC cells identification. On day 1, a population of mother-cells was stained using CTV. The CTV positive population was divided into six subgroups, and each subgroup was uniquely barcoded using a combination of CFSE and CTY concentrations, resulting in six distinct fluorescent barcodes. One mother-cell from each subgroup was then retrieved and combined in a well for approximately 24 hours of culture (resulting in a total of six mother cells, each with a unique fluorescent barcode). On day 2, following the first division, a fourth dye, CTFR, was introduced to label sister-cells with a different intensity in order to be able to discriminate the cells relationship after the subsequent division. On day 3, cells which underwent 2 divisions, determined by the intensity of CTV, were sorted into single-cells, and their fluorescent intensities for CTY, CFSE and CTFR signals were recorded. Finally, a dedicated script was used to infer the relationships of cells based on the fluorescent intensities (see "Methods" section)
Fig. 4
Fig. 4
Manhattan distances comparison between generation 1 sister-cells and non related cells. (A) Boxplots of Manhattan distances between the generation 1 CD34+ sister and non related cells. CD34+ sister-cells (43 couples) are in orange and CD34+ non related cells (3612 couples) in green. Manhattan distances were computed using all the 83 selected genes. Statistical comparison was performed using Wilcoxon test. (B) Boxplots of Manhattan distances between generation 1 T2EC sister and non related cells. Manhattan distances were computed between all cells from the same biological conditions using all the 1177 selected genes. Self-renewing sister-cells (30 couples) are in light orange and self-renewing non related cells (1740 couples) in light green, differentiating sister-cells (32 couples) are in orange and differentiating non related cells (1984 couples) in green. Statistical comparison was performed using Student t-test. (C) Histograms of mean Manhattan distances of 1000 random subsampling of distances between 43 CD34+ non related cell pairs (green), compared to the mean distance between the 43 CD34+ generation 1 sister-cells pairs (orange line). (D) Histograms of mean Manhattan distances of 1000 random subsampling of distances between 30 T2EC self-renewing non related cell pairs (light green histogram), compare to the mean distance between the 30 T2EC self-renewing generation 1 sister-cells pairs (light orange line). (E) Histograms of mean Manhattan distances of 1000 random subsampling of distances between 32 T2EC differentiating non related cell pairs (Green histogram), compare to the mean distance between the 32 T2EC differentiating generation 1 sister-cells pairs (orange line)
Fig. 5
Fig. 5
Manhattan distances comparison between generation 2 sisters, cousins and non related T2EC cells. Boxplots of Manhattan distances between generation 2 sisters, cousins and non related T2EC cells. Manhattan distances were computed between all cells (32 self-renewing and 20 differentiating cells) from the same biological condition using the 983 selected genes. Self-renewing generation 2 sister-cells (16 pairs) are presented in light blue, self-renewing generation 2 cousin-cells (32 pairs) are in medium blue and self-renewing non related cells (448 pairs) are in dark blue. Differentiating generation 2 sister-cells (10 pairs) are in yellow, differentiating generation 2 cousin-cells (20 pairs) are in orange and differentiating non related cells (160 pairs) are in brown. Statistical comparisons were performed using Student t-test
Fig. 6
Fig. 6
Density plot of genes intra-class correlation in generation 1 sister-cells and randomly paired CD34+ cells (A) and T2EC cells (B). Identification of memory genes using a linear model with random effect (CD34+) and mixed effect model (T2EC). Memory genes are in dark green (11 genes for the 86 CD34+ cells, 55 genes for the 104 T2EC cells), and non significant genes are in light green (72 for CD34+ cells, 1022 for T2EC cells); no memory genes were identified when cells were randomly paired (orange curve)
Fig. 7
Fig. 7
Manhattan distances comparison between generation 1 sisters and non related T2EC cells using subsets of genes. (A) Boxplots of the Manhattan distances computed between all cells from the same biological conditions using all the 55 memory genes. (B) Boxplots of the Manhattan distances computed between all cells from the same biological conditions using the 55 most variable genes. (C) Venn diagram of the 55 memory genes and the 55 most variable genes, 16 genes are common between both categories. (D) Boxplots of the Manhattan distances computed between all cells from the same biological conditions using the most variable genes, excluding the memory genes. (E) Density plot of the distribution of adjusted p-values from Wilcoxon test for mean Manhattan distance comparisons between conditions using 55 randomly draw genes, 1000 times. Blue curve is the p-values distribution of mean distance comparison between self-renewing sister-cells vs self-renewing non related cells. Yellow curve is the p-values distribution of mean distance comparison between differentiating sister-cells vs differentiating non related cells. P-value at 5% is presented as dotted grey vertical line
Fig. 8
Fig. 8
T2EC Memory genes characteristics. (A) mRNA half-life of memory genes and other genes present in the scRNA-seq dataset evaluated at 24hrs post differentiation induction [46] vs their Intra Class Correlation value extracted from the mixed effects model. (B) Cumulative empirical distribution graph of transcripts abundance of the 55 memory genes in the dataset compared to the total genes (1177) of scRNA-seq data

Similar articles

Cited by

References

    1. Miura H, Hiratani I. Cell cycle dynamics and developmental dynamics of the 3D genome: toward linking the two timescales. Curr Opin Genet Dev. 2022;73:101898. doi: 10.1016/j.gde.2021.101898. - DOI - PubMed
    1. Sigal A, Milo R, Cohen A, Geva-Zatorsky N, Klein Y, Liron Y, et al. Variability and memory of protein levels in human cells. Nature. 2006;444(7119):643–646. doi: 10.1038/nature05316. - DOI - PubMed
    1. Schwanhäusser B, Wolf J, Selbach M, Busse D. Synthesis and degradation jointly determine the responsiveness of the cellular proteome: Insights & Perspectives. BioEssays. 2013;35(7):597–601. doi: 10.1002/bies.201300017. - DOI - PubMed
    1. Corre G, Stockholm D, Arnaud O, Kaneko G, Viñuelas J, Yamagata Y, et al. Stochastic Fluctuations and Distributed Control of Gene Expression Impact Cellular Memory. PLoS ONE. 2014;9(12):e115574. doi: 10.1371/journal.pone.0115574. - DOI - PMC - PubMed
    1. Kimmerling RJ, Lee Szeto G, Li JW, Genshaft AS, Kazer SW, Payer KR, et al. A microfluidic platform enabling single-cell RNA-seq of multigenerational lineages. Nat Commun. 2016;7:10220. doi: 10.1038/ncomms10220. - DOI - PMC - PubMed

LinkOut - more resources