. 2024 Mar 11;19(1):24.
doi: 10.1186/s13024-024-00714-y.

APOE4 genotype and aging impair injury-induced microglial behavior in brain slices, including toward Aβ, through P2RY12

Affiliations

APOE4 genotype and aging impair injury-induced microglial behavior in brain slices, including toward Aβ, through P2RY12

Jordy Sepulveda et al. Mol Neurodegener. .

Abstract

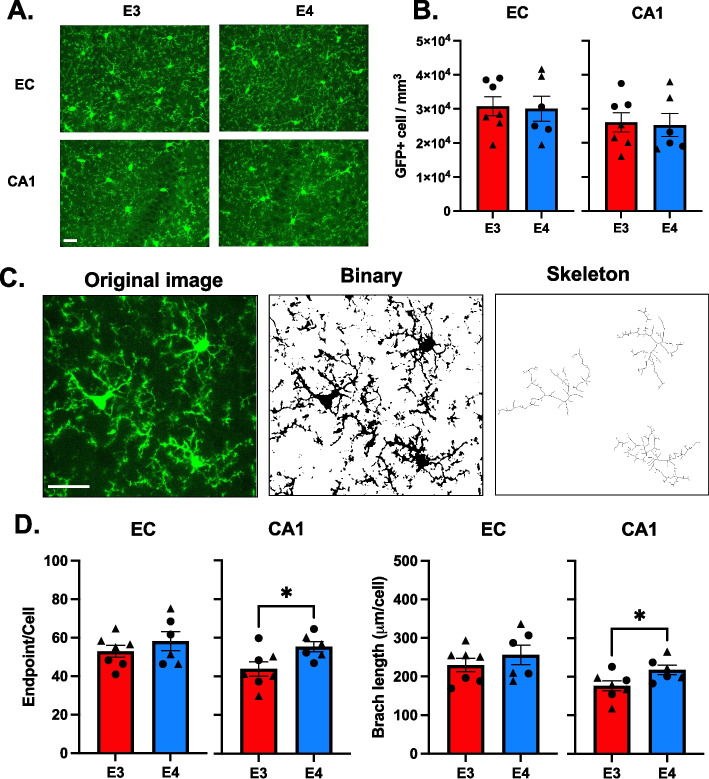
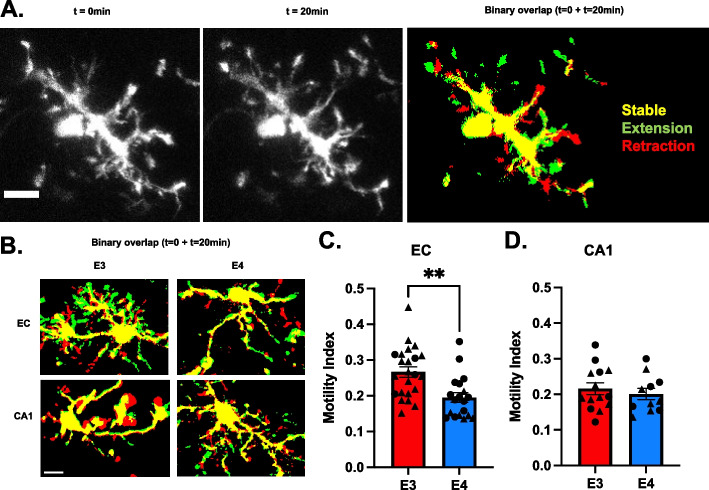
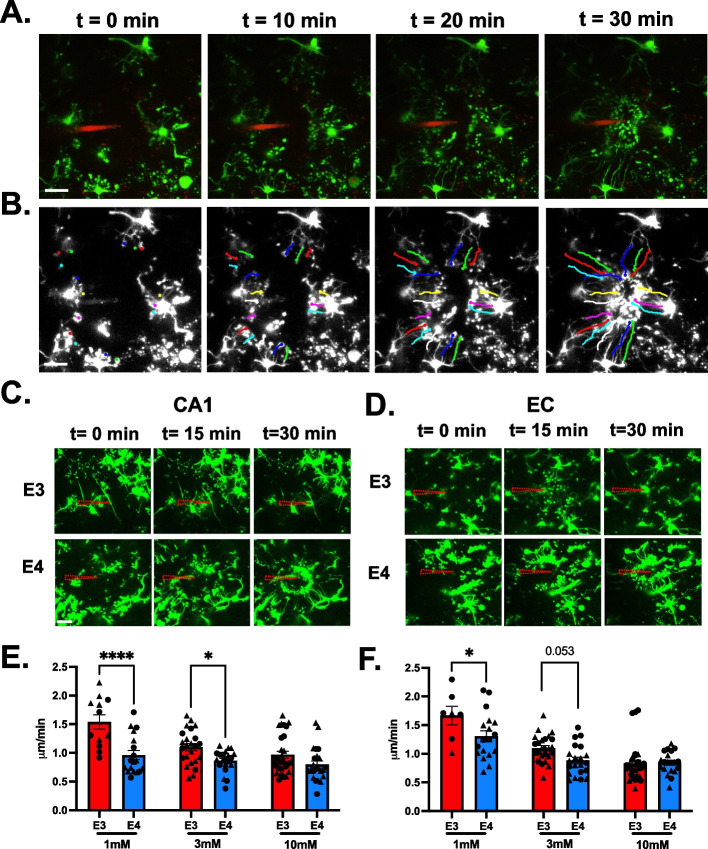
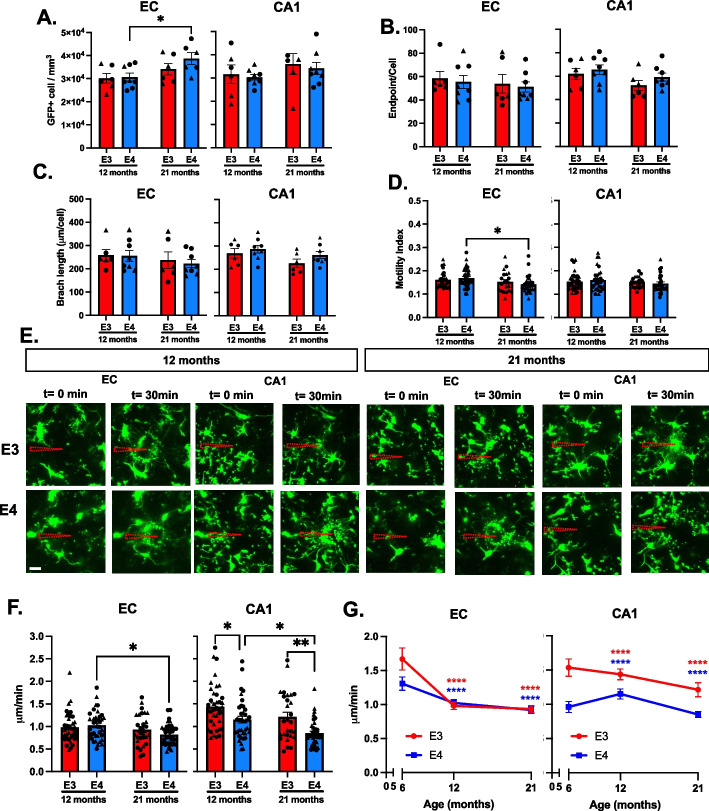
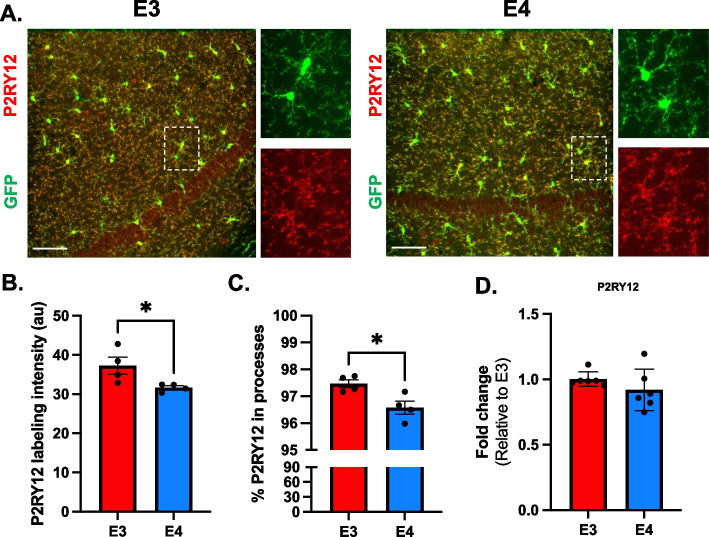
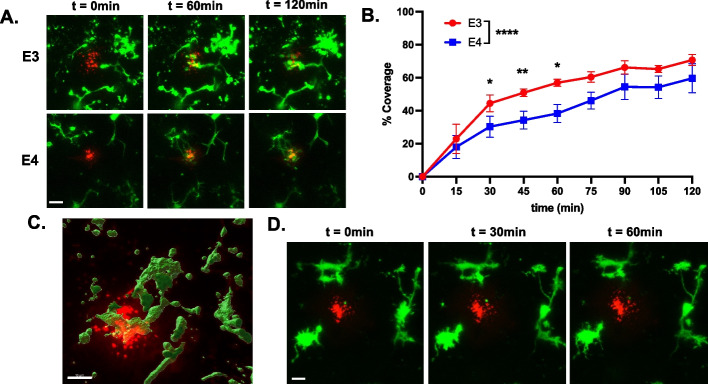
Microglia are highly dynamic cells that play a critical role in tissue homeostasis through the surveillance of brain parenchyma and response to cues associated with damage. Aging and APOE4 genotype are the strongest risk factors for Alzheimer's disease (AD), but how they affect microglial dynamics remains unclear. Using ex vivo confocal microscopy, we analyzed microglial dynamic behaviors in the entorhinal cortex (EC) and hippocampus CA1 of 6-, 12-, and 21-month-old mice APOE3 or APOE4 knock-in mice expressing GFP under the CX3CR1 promoter. To study microglia surveillance, we imaged microglia baseline motility for 20 min and measured the extension and retraction of processes. We found that APOE4 microglia exhibited significantly less brain surveillance (27%) compared to APOE3 microglia in 6-month-old mice; aging exacerbated this deficit. To measure microglia response to damage, we imaged process motility in response to ATP, an injury-associated signal, for 30 min. We found APOE4 microglia extended their processes significantly slower (0.9 µm/min, p < 0.005) than APOE3 microglia (1.1 μm/min) in 6-month-old animals. APOE-associated alterations in microglia motility were observed in 12- and 21-month-old animals, and this effect was exacerbated with aging in APOE4 microglia. We measured protein and mRNA levels of P2RY12, a core microglial receptor required for process movement in response to damage. We found that APOE4 microglia express significantly less P2RY12 receptors compared to APOE3 microglia despite no changes in P2RY12 transcripts. To examine if the effect of APOE4 on the microglial response to ATP also applied to amyloid β (Aβ), we infused locally Hi-Lyte Fluor 555-labeled Aβ in acute brain slices of 6-month-old mice and imaged microglia movement for 2 h. APOE4 microglia showed a significantly slower (p < 0.0001) process movement toward the Aβ, and less Aβ coverage at early time points after Aβ injection. To test whether P2RY12 is involved in process movement in response to Aβ, we treated acute brain slices with a P2RY12 antagonist before Aβ injection; microglial processes no longer migrated towards Aβ. These results provide mechanistic insights into the impact of APOE4 genotype and aging in dynamic microglial behaviors prior to gross Aβ pathology and could help explain how APOE4 brains are more susceptible to AD pathogenesis.

Keywords: Ex-vivo imaging; APOE4; Aging; Alzheimer’s disease; Microglia; P2RY12.


Conflict of interest statement

The authors have no competing interests.

Figures

Fig. 1
Fig. 1
APOE genotype does not affect microglia density and morphology. A Representative images of microglia in the entorhinal cortex (EC) and hippocampus (CA1) from APOE3 (E3) and APOE4 (E4) mice. Scale bar = 50 µm. B Quantification of microglia density. Bars represent the mean ± SEM cell density in analyzed fields, and symbols (circles, male; triangle, females) represent data points for each animal. 2–3 brain slices per animal, 4 animals per genotype per sex. C Schematic of microglia morphology analysis. Scale bar 25µm. D Quantification of microglial endpoint/cell (left) and branch length/cell (right) of the EC and CA1 of E3 and E4 mice. Bars represent the mean ± SEM microglial endpoint/cell and branch length/cell in analyzed fields, and symbols (circles, male; triangle, females) represent data points for each animal. 2–3 brain slices per animal, 4 animals per genotype per sex. *p < 0.05; unpaired two-tailed Student’s t test
Fig. 2
Fig. 2
APOE4 Microglia exhibit lower spontaneous motility in the entorhinal cortex. A Confocal images of microglia spontaneous motility time-lapse at different time points, and binary overlap. Scale bar 10 µm. B Binary overlaps of APOE3 and APOE4 microglia in the EC and CA1. Quantification of microglial baseline processes movement (motility index = green pixels + red pixels/yellow pixels) in the EC (C) and CA1 (D). Bars represent the average motility index of all analyzed microglia ± SEM, and symbols (circles, male; triangle, females) represent data points for each microglia (3–4 animals per genotype). ***p < 0.001; unpaired two-tailed Student’s t test
Fig. 3
Fig. 3
APOE4 microglia extend their processes in response to ATP slower than APOE3 microglia. A Representative confocal time-lapse showing microglial response (green) to 3 mM ATP in a patch pipette (red) in acute entorhinal slices. Scale bar 20 µm. B Illustration of the microglial processes manual tracking over the course of 30 min. Scale bar 20 µm. C-D APOE3 (E3) and APOE4 (E4) microglia responding to patch pipette containing ATP (shown as dashed triangle) in the CA1 (C) and EC (D). EF Processes velocity in the CA1 (C) and EC (D) in response to 1 mM, 3 mM, and 10 mM ATP. Bar graphs represent the mean velocity ± SEM. Individual points (circles, male; triangle, females) represent the average process velocity (3 processes per cell) of each microglia (3–5 cells per animal). 3–4 animals per genotype per sex (6 months old). Two-way ANOVA with Sidak’s multiple comparison post-hoc analyses *p < 0.05, ****p < 0.0001
Fig. 4
Fig. 4
APOE4-associated alterations in microglia behaviors are worsened with aging. A Quantification of microglia density in EC and CA1 of 12- and 21-month-old mice. Bars represent the mean ± SEM cell density in analyzed fields, symbols (circles, male; triangle females) represent data points for each animal. 2–3 brain slices per animal, 3–4 animals per genotype per sex per age. Two-way ANOVA with Tukey’s multiple comparison post-hoc analyses, *p = 0.014. B-C Quantification of microglial endpoint/cell (B) and branch length/cell (C) in the EC and CA1 of 12- and 21-month-old mice. Bars represent the mean ± SEM microglial endpoint/cell and branch length/cell in analyzed fields, and symbols (circles, male; triangle, females) represent data points for each animal. 2–3 brain slices per animal, 3–4 animals per genotype per sex per age. D Bars represent the average motility index of all analyzed microglia ± SEM, and points represent data from each microglia 3–4 animals per genotype per sex per age. Two-way ANOVA with Tukey’s multiple comparison post-hoc analyses *p = 0.022. E 12- and 21- months old APOE3 (E3) and APOE4 (E4) microglia responding to patch pipette containing ATP (shown as dashed triangle) in the CA1 and EC. Scale bar 20 µm. F Processes velocity in the CA1 (C) and EC (D) in response to 1 mM ATP. Bar graphs represent the mean velocity ± SEM. Individual points represent the average process velocity (3 processes per cell) of each microglia (3–5 cells per animal), 3–4 animals per genotype per sex (6 months old). Two-way ANOVA with Tukey’s multiple comparison post-hoc analyses *p < 0.05, **p = 0.006. G Comparison of velocity of microglial processes in response to 1 mM ATP in 6-month (shown in Fig. 3), 12-, and 21-month-old mice. Two-way ANOVA with Tukey’s multiple comparison post-hoc analyses; data are compared to 6-month-old mice for either EC or CA1. ****p = 0.0001
Fig. 5
Fig. 5
P2RY12 is downregulated in APOE4 microglia. A Confocal images of GFP (green) P2RY12 (red) in APOE3 (E3) and APOE4 (E4) brains. P2RY12 is expressed mainly in the membrane of microglial processes distal from microglial soma. Scale bar 60 µm. B Quantification of P2RY12 labeling intensity (arbitrate units, see methods) in total field. Individual points represent each animal. 2 brain slices per animal, 4 animals (males) per genotype. *p < 0.05, two-tailed student t-test. C Quantification of percent P2RY12 in microglial processes. Individual points represent individual fields. 2 fields per brain slice, 2 brain slices per animal, 4 animals (males) per genotype. *p < 0.05, two-tailed student t-test. Fold change levels of P2RY12 mRNA. RNA was extracted from hemibrain (6 animals per genotype). Level of transcript was determined through double delta CT
Fig. 6
Fig. 6
APOE4 microglia exhibit slower response to Aβ peptides, which requires P2RY12. A Representative confocal zt-stacks showing the time course of microglial response (green) to Hi-Lyte Fluor 555-labeled Aβ (Aβ − 42) (red) in acute entorhinal slices. Scale bar 10 µm. B Percent coverage computed as the percent area of infused Aβ − 42 covered by microglial processes over time. Mean percent coverage ± SEM plotted. Two-way ANOVA with Sidak’s multiple comparison post-hoc analyses to show the effect of APOE genotype, and two-tailed student t-test to compare at each time point. C 3D reconstruction of microglial processes internalizing Aβ 6 h post-injection. Scale bar 10 µm. D Acute brain slices were incubated in 10 µM PSB. Representative confocal zt-stacks showing the time course of microglial response (green) to Hi-Lyte Fluor 555-labeled Aβ (Aβ − 42) (red). Scale bar 10 µm

References

    1. 2022 Alzheimer's disease facts and figures. Alzheimers Dement. 2022;18(4), 700–789. 10.1002/alz.12638. - PubMed
    1. Bu G. Apolipoprotein E and its receptors in Alzheimer's disease: pathways, pathogenesis and therapy. Nat Rev Neurosci. 2009;10(5):333–344. doi: 10.1038/nrn2620. - DOI - PMC - PubMed
    1. Flowers SA, Rebeck GW. APOE in the normal brain. Neurobiol Dis. 2020;136:104724. doi: 10.1016/j.nbd.2019.104724. - DOI - PMC - PubMed
    1. Liang X, Wu H, Colt M, Guo X, Pluimer B, Zeng J, Dong S, Zhao Z. Microglia and its Genetics in Alzheimer's Disease. Curr Alzheimer Res. 2021;18(9):676–688. doi: 10.2174/1567205018666211105140732. - DOI - PMC - PubMed
    1. Fernandez CG, Hamby ME, McReynolds ML, Ray WJ. The Role of APOE4 in Disrupting the Homeostatic Functions of Astrocytes and Microglia in Aging and Alzheimer's Disease. Front Aging Neurosci. 2019;11:14. doi: 10.3389/fnagi.2019.00014. - DOI - PMC - PubMed