

Predicting long-term progression of Alzheimer's disease using a multimodal deep learning model incorporating interaction effects
- PMID: 38468358
- PMCID: PMC10926590
- DOI: 10.1186/s12967-024-05025-w
Predicting long-term progression of Alzheimer's disease using a multimodal deep learning model incorporating interaction effects
Abstract
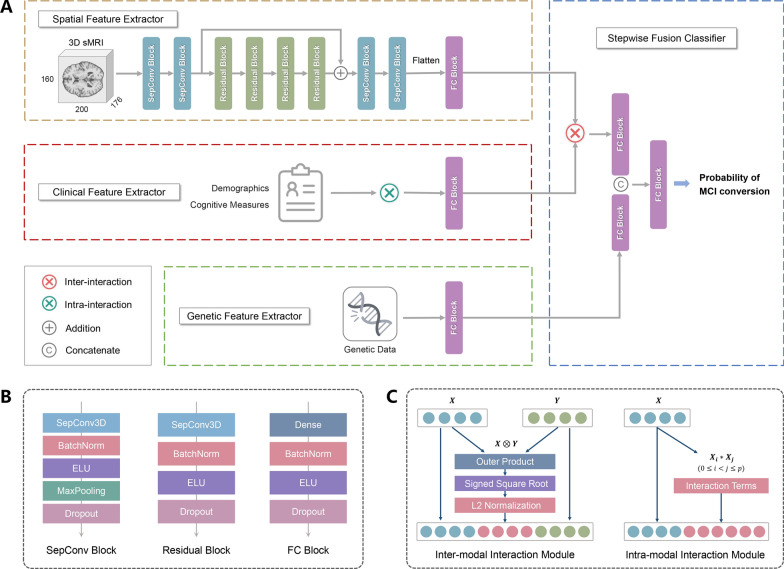
Background: Identifying individuals with mild cognitive impairment (MCI) at risk of progressing to Alzheimer's disease (AD) provides a unique opportunity for early interventions. Therefore, accurate and long-term prediction of the conversion from MCI to AD is desired but, to date, remains challenging. Here, we developed an interpretable deep learning model featuring a novel design that incorporates interaction effects and multimodality to improve the prediction accuracy and horizon for MCI-to-AD progression.
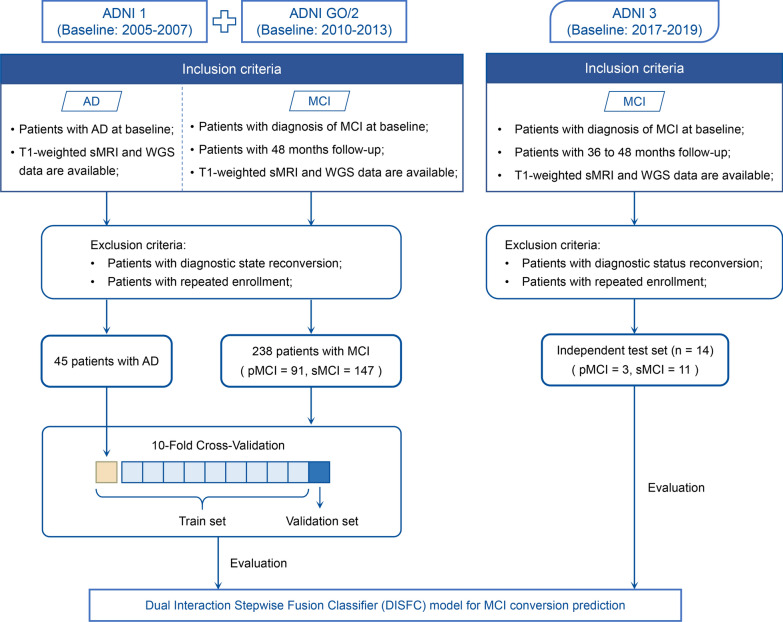
Methods: This multi-center, multi-cohort retrospective study collected structural magnetic resonance imaging (sMRI), clinical assessments, and genetic polymorphism data of 252 patients with MCI at baseline from the Alzheimer's Disease Neuroimaging Initiative (ADNI) database. Our deep learning model was cross-validated on the ADNI-1 and ADNI-2/GO cohorts and further generalized in the ongoing ADNI-3 cohort. We evaluated the model performance using the area under the receiver operating characteristic curve (AUC), accuracy, sensitivity, specificity, and F1 score.
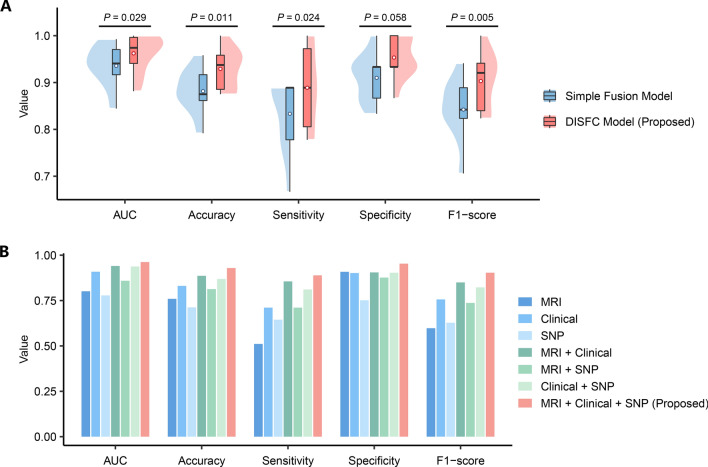
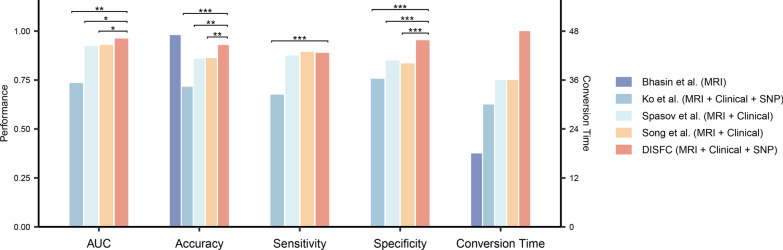
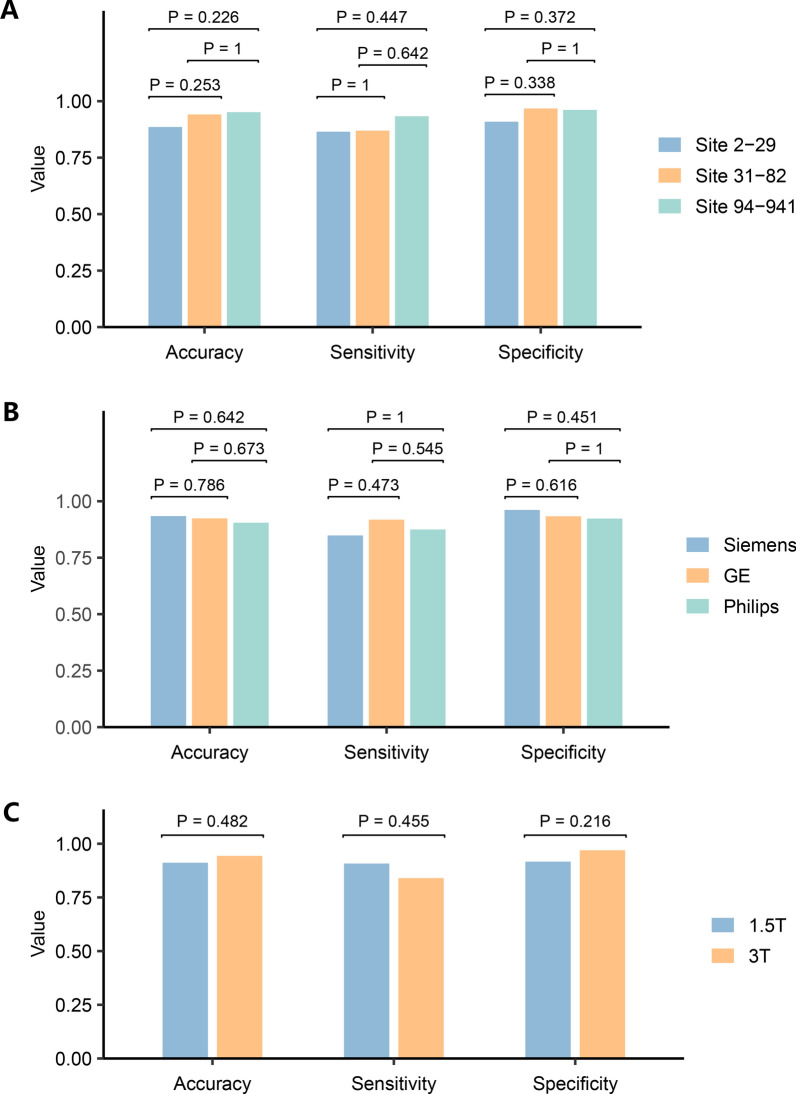
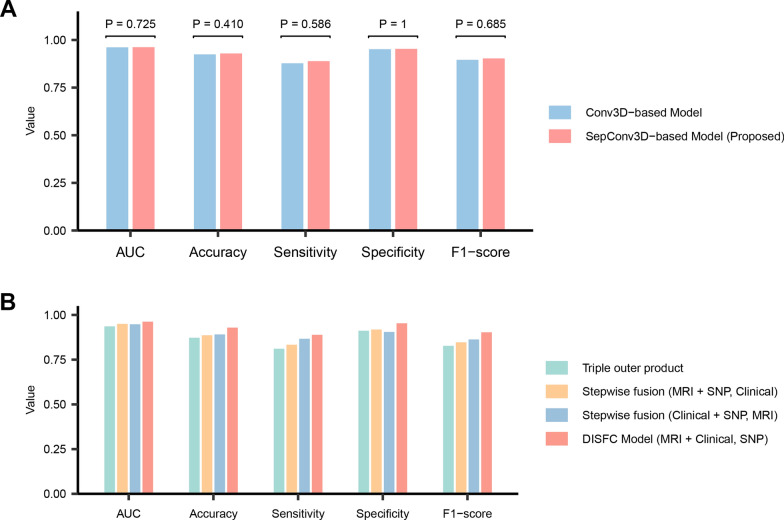
Results: On the cross-validation set, our model achieved superior results for predicting MCI conversion within 4 years (AUC, 0.962; accuracy, 92.92%; sensitivity, 88.89%; specificity, 95.33%) compared to all existing studies. In the independent test, our model exhibited consistent performance with an AUC of 0.939 and an accuracy of 92.86%. Integrating interaction effects and multimodal data into the model significantly increased prediction accuracy by 4.76% (P = 0.01) and 4.29% (P = 0.03), respectively. Furthermore, our model demonstrated robustness to inter-center and inter-scanner variability, while generating interpretable predictions by quantifying the contribution of multimodal biomarkers.
Conclusions: The proposed deep learning model presents a novel perspective by combining interaction effects and multimodality, leading to more accurate and longer-term predictions of AD progression, which promises to improve pre-dementia patient care.
Keywords: Alzheimer’s disease; Artificial intelligence; Deep learning; Early diagnosis; Multimodal biomarkers.
© 2024. The Author(s).
Conflict of interest statement
The authors declare that they have no competing interests.
Figures


Similar articles
-
A parameter-efficient deep learning approach to predict conversion from mild cognitive impairment to Alzheimer's disease.Neuroimage. 2019 Apr 1;189:276-287. doi: 10.1016/j.neuroimage.2019.01.031. Epub 2019 Jan 14. Neuroimage. 2019. PMID: 30654174
-
Machine learning framework for early MRI-based Alzheimer's conversion prediction in MCI subjects.Neuroimage. 2015 Jan 1;104:398-412. doi: 10.1016/j.neuroimage.2014.10.002. Epub 2014 Oct 12. Neuroimage. 2015. PMID: 25312773 Free PMC article.
-
Structural, static, and dynamic functional MRI predictors for conversion from mild cognitive impairment to Alzheimer's disease: Inter-cohort validation of Shanghai Memory Study and ADNI.Hum Brain Mapp. 2024 Jan;45(1):e26529. doi: 10.1002/hbm.26529. Epub 2023 Nov 22. Hum Brain Mapp. 2024. PMID: 37991144 Free PMC article.
-
Structural magnetic resonance imaging for the early diagnosis of dementia due to Alzheimer's disease in people with mild cognitive impairment.Cochrane Database Syst Rev. 2020 Mar 2;3(3):CD009628. doi: 10.1002/14651858.CD009628.pub2. Cochrane Database Syst Rev. 2020. PMID: 32119112 Free PMC article.
-
Machine learning methods for predicting progression from mild cognitive impairment to Alzheimer's disease dementia: a systematic review.Alzheimers Res Ther. 2021 Sep 28;13(1):162. doi: 10.1186/s13195-021-00900-w. Alzheimers Res Ther. 2021. PMID: 34583745 Free PMC article.
Cited by
-
Biopsychosocial phenotypes in people with HIV in the CHARTER cohort.Brain Commun. 2024 Jul 29;6(4):fcae224. doi: 10.1093/braincomms/fcae224. eCollection 2024. Brain Commun. 2024. PMID: 39077377 Free PMC article.
-
Comparing machine learning and deep learning models to predict cognition progression in Parkinson's disease.Clin Transl Sci. 2024 Nov;17(11):e70066. doi: 10.1111/cts.70066. Clin Transl Sci. 2024. PMID: 39513668 Free PMC article.
-
Application of artificial intelligence in Alzheimer's disease: a bibliometric analysis.Front Neurosci. 2025 Feb 14;19:1511350. doi: 10.3389/fnins.2025.1511350. eCollection 2025. Front Neurosci. 2025. PMID: 40027465 Free PMC article. Review.
-
Research progress in predicting the conversion from mild cognitive impairment to Alzheimer's disease via multimodal MRI and artificial intelligence.Front Neurol. 2025 Jun 2;16:1596632. doi: 10.3389/fneur.2025.1596632. eCollection 2025. Front Neurol. 2025. PMID: 40529431 Free PMC article. Review.
-
Predicting cognitive change using functional, structural, and neuropsychological predictors.Brain Commun. 2025 Apr 18;7(3):fcaf155. doi: 10.1093/braincomms/fcaf155. eCollection 2025. Brain Commun. 2025. PMID: 40337465 Free PMC article.
References
-
- 2022 Alzheimer’s disease facts and figures. Alzheimers Dement. 2022;18(4):700–89. - PubMed
-
- Winblad B, Palmer K, Kivipelto M, Jelic V, Fratiglioni L, Wahlund L-O, et al. Mild cognitive impairment—beyond controversies, towards a consensus: report of the International Working Group on Mild Cognitive Impairment. J Intern Med. 2004;256(3):240–246. doi: 10.1111/j.1365-2796.2004.01380.x. - DOI - PubMed
Publication types
MeSH terms
Grants and funding
LinkOut - more resources
Full Text Sources
Medical
