

The relationship between weight gain during chemotherapy and outcomes in patients with advanced non-small cell lung cancer
- PMID: 38468440
- PMCID: PMC11154746
- DOI: 10.1002/jcsm.13426
The relationship between weight gain during chemotherapy and outcomes in patients with advanced non-small cell lung cancer
Abstract
Background: This post hoc, pooled analysis examined the relationship between different weight gain categories and overall survival (OS) in patients with non-small cell lung cancer (NSCLC) receiving first-line platinum-based chemotherapy.
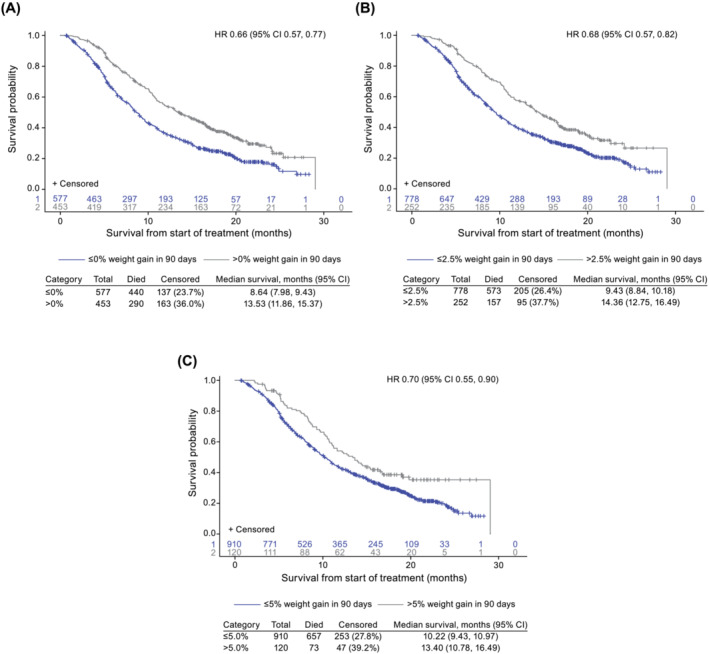
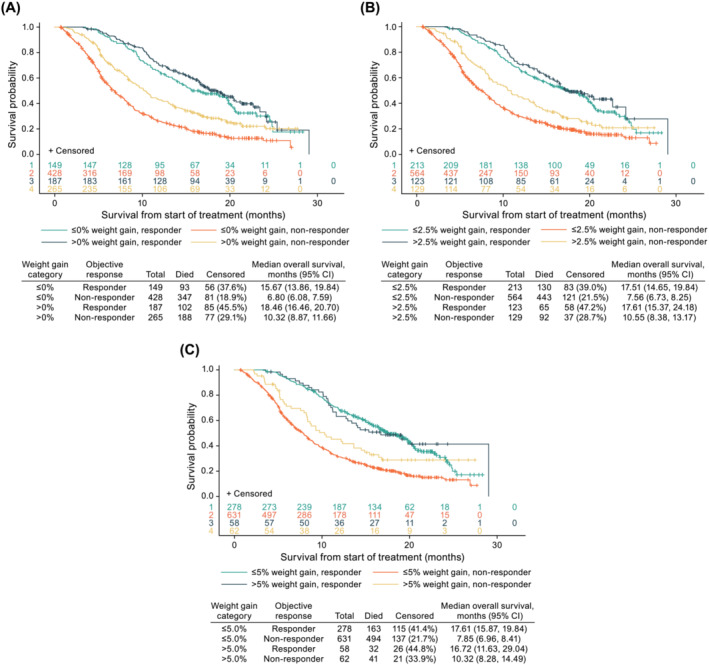
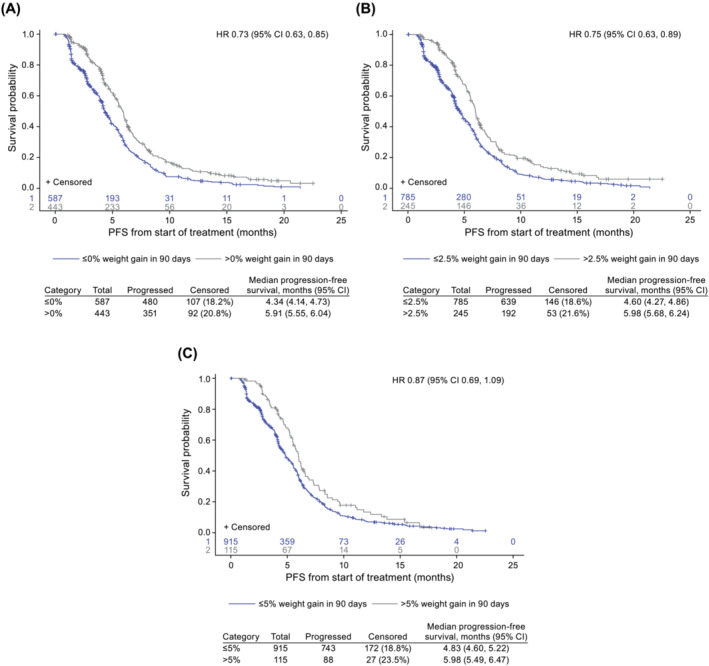
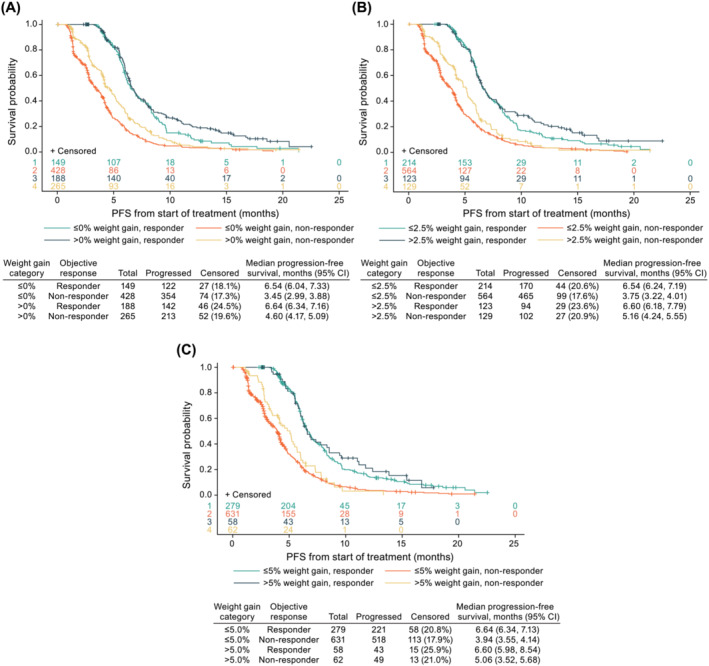
Methods: Data were pooled from the control arms of three phase III clinical studies (NCT00596830, NCT00254891, and NCT00254904), and the maximum weight gain in the first 3 months from treatment initiation was categorised as >0%, >2.5%, and >5.0%. Cox proportional hazard modelling of OS was used to estimate hazard ratios (HRs) for each category, including baseline covariates, time to weight gain, and time to confirmed objective response (RECIST Version 1.0).
Results: Of 1030 patients with advanced NSCLC (IIIB 11.5% and IV 88.5%), 453 (44.0%), 252 (24.5%), and 120 (11.7%) experienced weight gain from baseline of >0%, >2.5%, and >5.0%, respectively. The median time to weight gain was 23 (>0%), 43 (>2.5%), and 45 (>5.0%) days. After adjusting for a time-dependent confirmed objective response, the risk of death was reduced for patients with any weight gain (>0% vs. ≤0% [HR 0.71; 95% confidence interval-CI 0.61, 0.82], >2.5% vs. ≤2.5% [HR 0.76; 95% CI 0.64, 0.91] and >5.0% vs. ≤5.0% [HR 0.77; 95% CI 0.60, 0.99]). The median OS was 13.5 versus 8.6 months (weight gain >0% vs. ≤0%), 14.4 versus 9.4 months (weight gain >2.5% vs. ≤2.5%), and 13.4 versus 10.2 months (weight gain >5.0% vs. ≤5.0%).
Conclusions: Weight gain during treatment was associated with a reduced risk of death, independent of tumour response. The survival benefit was comparable for weight gain >0%, >2.5%, and >5.0%, suggesting that any weight gain may be an early predictor of survival with implications for the design of interventional cancer cachexia studies.
Keywords: cachexia; non‐small cell lung cancer; survival; weight; weight gain.
© 2024 Pfizer Inc. Journal of Cachexia, Sarcopenia and Muscle published by Wiley Periodicals LLC.
Conflict of interest statement
E. J. Roeland has served on scientific advisory boards for Napo Pharmaceuticals, Care4ward, Actimed Therapeutics, Meter Health, Alerion, and Takeda; as a consultant for Veloxis Therapeutics and BYOMass; and as a member of a data safety monitoring board for Enzychem Lifesciences. F. J. Fintelmann receives research support from Pfizer and serves as a consultant and speaker for Boston Scientific. L. Tarasenko, E. Whalen and R. Yang are full‐time employees and shareholders of Pfizer. R. A. Calle and F. Hilton were employees of Pfizer at the time of study execution and are Pfizer shareholders. P. D. Bonomi has received honoraria from Pfizer and Helsinn for participation in advisory boards.
Figures

Similar articles
-
Relationship between efficacy outcomes and weight gain during treatment of advanced, non-squamous, non-small-cell lung cancer patients.Ann Oncol. 2016 Aug;27(8):1612-9. doi: 10.1093/annonc/mdw211. Epub 2016 May 23. Ann Oncol. 2016. PMID: 27217544
-
Docetaxel plus nintedanib versus docetaxel plus placebo in patients with previously treated non-small-cell lung cancer (LUME-Lung 1): a phase 3, double-blind, randomised controlled trial.Lancet Oncol. 2014 Feb;15(2):143-55. doi: 10.1016/S1470-2045(13)70586-2. Epub 2014 Jan 9. Lancet Oncol. 2014. PMID: 24411639 Clinical Trial.
-
A prognostic model for platinum-doublet as second-line chemotherapy in advanced non-small-cell lung cancer patients.Cancer Med. 2016 Jun;5(6):1116-24. doi: 10.1002/cam4.689. Epub 2016 Mar 19. Cancer Med. 2016. PMID: 26993156 Free PMC article.
-
Does granulocyte colony-stimulating factor affect survival in patients with advanced non-small cell lung cancer?J Thorac Oncol. 2006 Jul;1(6):564-70. doi: 10.1016/s1556-0864(15)30360-9. J Thorac Oncol. 2006. PMID: 17409918
-
Treatment outcomes by histology in REVEL: A randomized phase III trial of Ramucirumab plus docetaxel for advanced non-small cell lung cancer.Lung Cancer. 2017 Oct;112:126-133. doi: 10.1016/j.lungcan.2017.05.021. Epub 2017 Jun 3. Lung Cancer. 2017. PMID: 29191585 Clinical Trial.
Cited by
-
Defining and Addressing Research Priorities in Cancer Cachexia through Transdisciplinary Collaboration.Cancers (Basel). 2024 Jun 27;16(13):2364. doi: 10.3390/cancers16132364. Cancers (Basel). 2024. PMID: 39001427 Free PMC article. Review.
-
Weight Gain Among Cancer Patients Receiving Chemotherapy-Facts and Numbers.J Cachexia Sarcopenia Muscle. 2025 Feb;16(1):e13694. doi: 10.1002/jcsm.13694. J Cachexia Sarcopenia Muscle. 2025. PMID: 39972941 Free PMC article.
References
-
- Bruggeman AR, Kamal AH, LeBlanc TW, Ma JD, Baracos VE, Roeland EJ. Cancer cachexia: beyond weight loss. J Oncol Pract 2016;12:1163–1171. - PubMed
-
- Fearon K, Strasser F, Anker SD, Bosaeus I, Bruera E, Fainsinger RL, et al. Definition and classification of cancer cachexia: an international consensus. Lancet Oncol 2011;12:489–495. - PubMed
-
- Roeland EJ, Bohlke K, Baracos VE, Bruera E, Del Fabbro E, Dixon S, et al. Management of cancer cachexia: ASCO guideline. J Clin Oncol 2020;38:2438–2453. - PubMed
MeSH terms
Grants and funding
LinkOut - more resources
Full Text Sources
Medical
