. 2024 Mar;30(3):e14673.
doi: 10.1111/cns.14673.

CD4+ CD11b+ T cells infiltrate and aggravate the traumatic brain injury depending on brain-to-cervical lymph node signaling

Affiliations

CD4+ CD11b+ T cells infiltrate and aggravate the traumatic brain injury depending on brain-to-cervical lymph node signaling

Weiwei Jiang et al. CNS Neurosci Ther. 2024 Mar.

Abstract

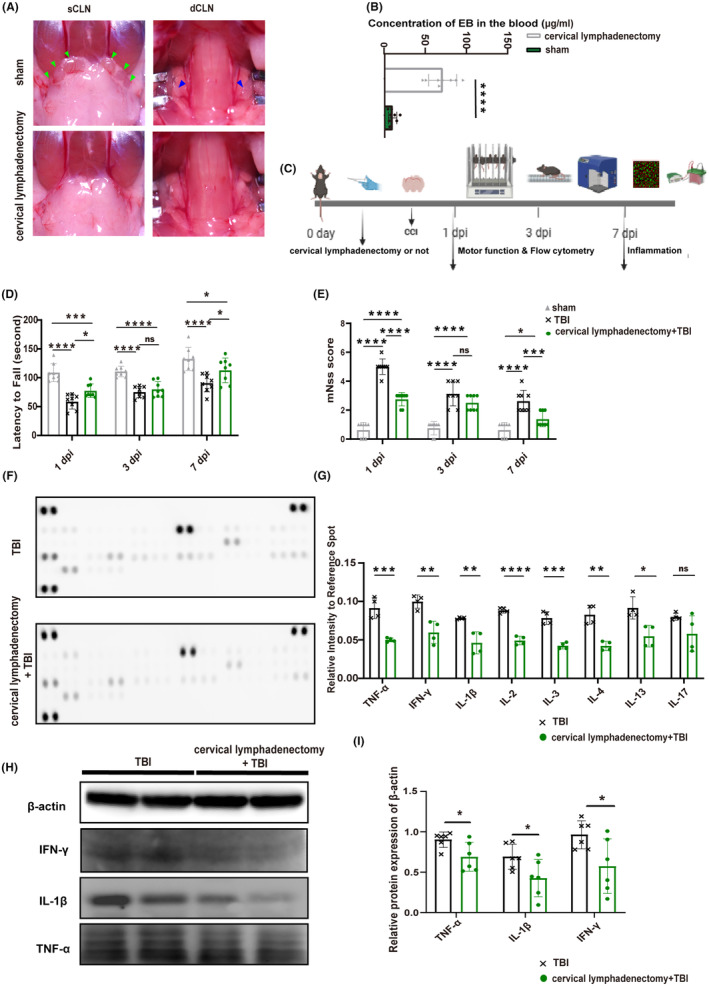
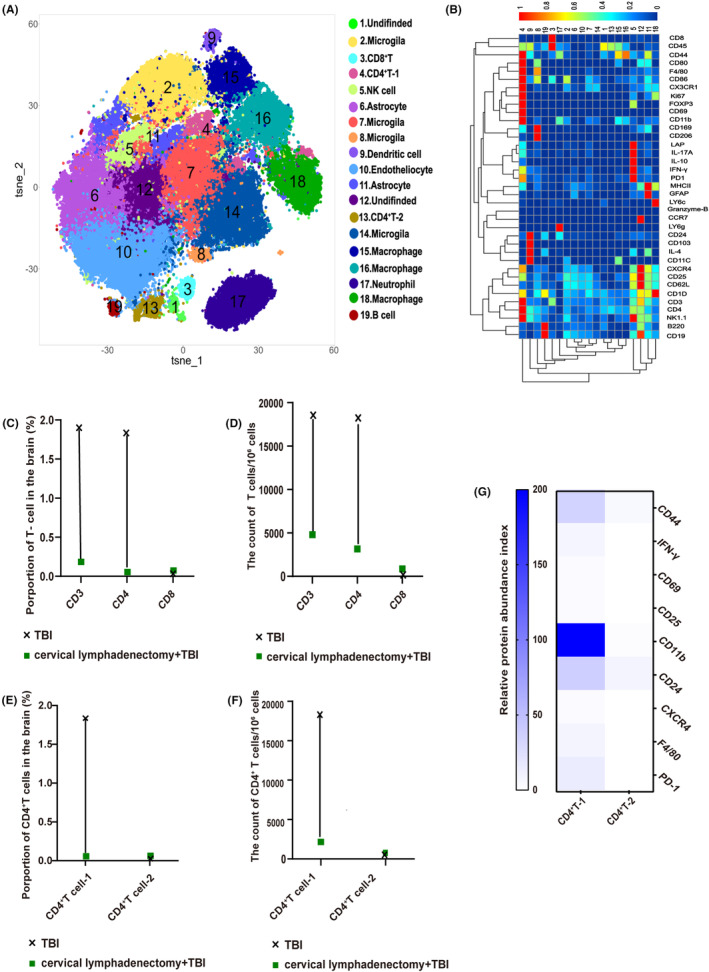
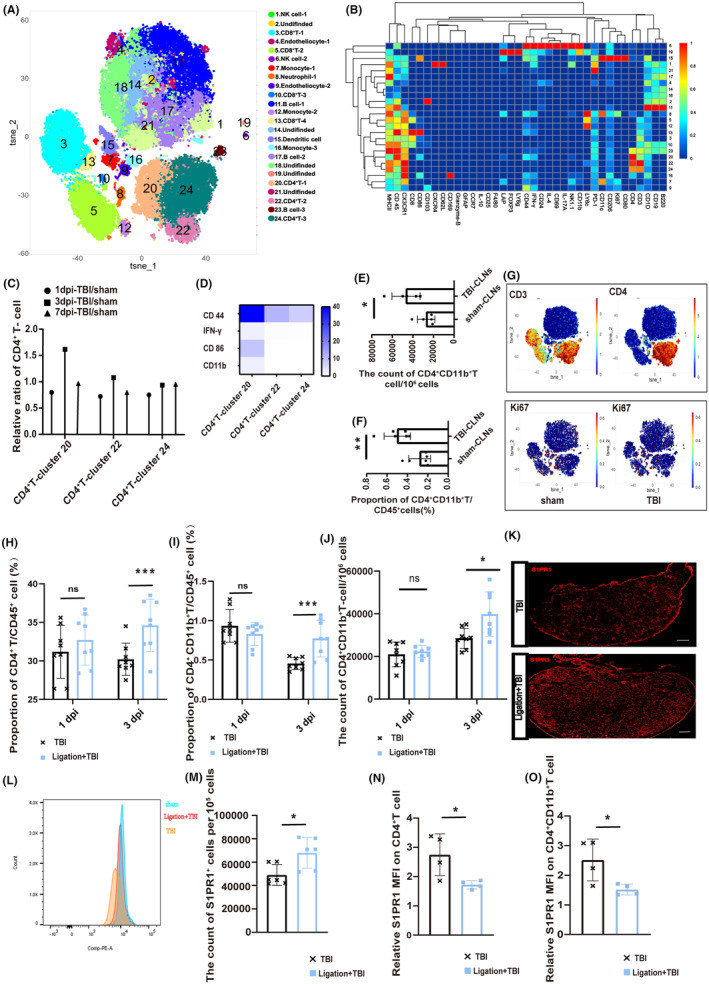
Aim: We aim to identify the specific CD4+ T-cell subtype influenced by brain-to-CLN signaling and explore their role during the acute phase of traumatic brain injury (TBI).

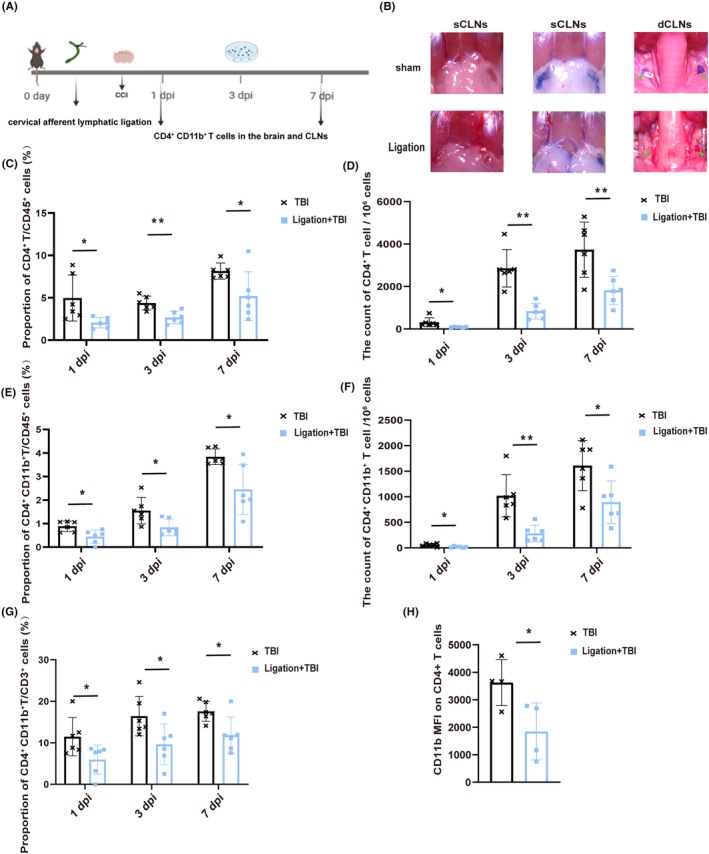
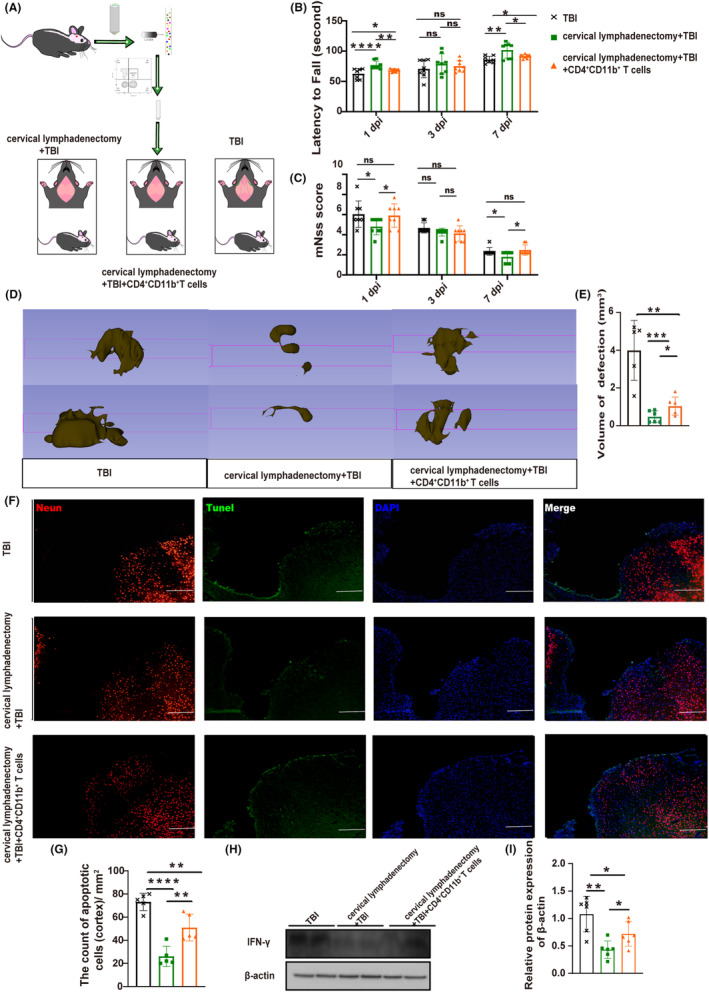
Method: Cervical lymphadenectomy or cervical afferent lymphatic ligation was performed before TBI. Cytokine array and western blot were used to detect cytokines, while the motor function was assessed using mNss and rotarod test. CD4+ T-cell subtypes in blood, brain, and CLNs were analyzed with Cytometry by time-of-flight analysis (CyTOF) or fluorescence-activated cell sorting (FACS). Brain edema and volume changes were measured by 9.4T MRI. Neuronal apoptosis was evaluated by terminal deoxynucleotidyl transferase-mediated dUTP nick end labeling (TUNEL) staining.

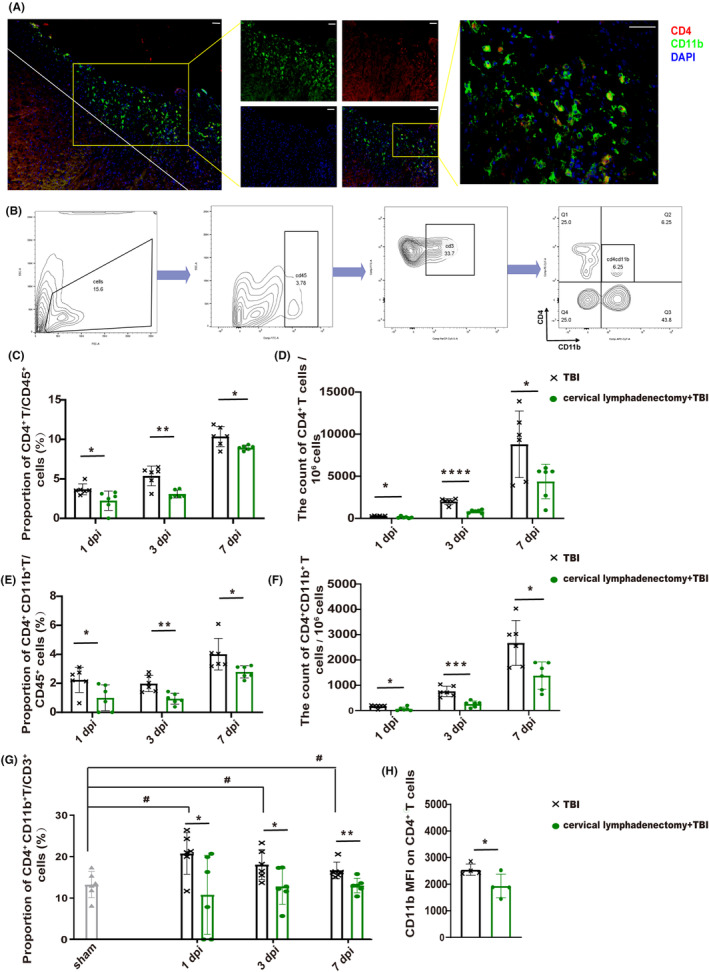
Results: Cervical lymphadenectomy and ligation of cervical lymphatic vessels resulted in a decreased infiltration of CD4+ T cells, specifically CD11b-positive CD4+ T cells, within the affected region. The population of CD4+ CD11b+ T cells increased in ligated CLNs, accompanied by a decrease in the average fluorescence intensity of sphingosine-1-phosphate receptor-1 (S1PR1) on these cells. Administration of CD4+ CD11b+ T cells sorted from CLNs into the lateral ventricle reversed the attenuated neurologic deficits, brain edema, and lesion volume following cervical lymphadenectomy.

Conclusion: The infiltration of CD4+ CD11b+ T cells exacerbates secondary brain damage in TBI, and this process is modulated by brain-to-CLN signaling.

Keywords: CD4+ T cell; brain-to-cervical lymph node signaling; immunoregulation; traumatic brain injury.


Conflict of interest statement

The authors declare that they have no competing interests.

Figures

FIGURE 1
FIGURE 1
The motor function and expression of cytokines after cervical lymphadenectomy. (A) Display of cervical lymphadenectomy; green arrows indicate sCLNs; blue arrows indicate dCLNs. (B) The concentration of Evans Blue in peripheral blood in mice with or without CLNs (n = 8). (C) Basic characteristics of this part. (D) Statistical analysis of the Rotarod experiment (n = 8). (E) The results of mNSS in each group (n = 8). (F) The exposure image displays inflammatory cytokines using the mice cytokine array at 7 dpi. (G) Statistical analysis of the pixel density of elevated cytokines at 7 dpi. The samples were derived from a mixture of three independent mice, and each inflammatory factor detection point represents one experiment (n = 4). (H) Representative western blots of β‐actin, IFN‐γ, TNF‐α, and IL‐1β. (I) Quantification of relative protein expression normalized to the optical density of β‐actin (n = 6). All data are shown as mean ± SD. *p < 0.05, **p < 0.01, ***p < 0.001, and ****p < 0.0001. dCLNs, deep cervical lymph nodes; dpi, day post‐injury; IFN‐γ, interferon‐gamma; IL, interleukin; mNSS, modified neurological severity score; sCLNs, superficial cervical lymph nodes; TNF‐α, tumor necrosis factor‐alpha.
FIGURE 2
FIGURE 2
Cytometry by time‐of‐flight analysis of the brain at 7 dpi. (A) Visualized t‐SNE maps of brain cells from TBI and cervical lymphadenectomy+TBI mice at 7 dpi. Maps were based on the expression of 37 different parameters as shown in Table S1. (B) Based on the clusters identified in (A), median intensities for each marker were calculated and plotted as heat maps to identify the respective immune cell populations. (C) Proportion of T cells among total cells in the brain between TBI and cervical lymphadenectomy+TBI mice. (D) The count of T cells per 106 cells in the brain between TBI and cervical lymphadenectomy+TBI mice at 7 dpi. (E) Proportion of CD4+ T‐cell 1 (cluster 4) and CD4+ T‐cell 2 (cluster 13) among total brain cells at 7 dpi. (F) The count of CD4+ T cells per 106 cells in the brain between TBI and cervical lymphadenectomy+TBI mice at 7 dpi. (G) Expression of partial cell markers in CD4+ T‐cell 1 and CD4+ T‐cell 2. A comprehensive analysis was performed by amalgamating the data obtained from three distinct mice and visually depicting the results using a dumbbell plot. CLNs, cervical lymph nodes; TBI, traumatic brain injury; dpi, day post‐injury.
FIGURE 3
FIGURE 3
Cervical lymphadenectomy decreased recruitment of brain CD4+CD11b+ T cells after TBI. (A) Localization of CD4+CD11b+ T cells in the brain after TBI (red—CD4, green—CD11b, and blue—DAPI). Scale: 100 μm. (B) Logic of cell selection. (C–F) Proportion and count of CD4+ T, and CD4+ CD11b+ T lymphocytes in the injured brain among TBI and cervical lymphadenectomy+TBI mice at 1 dpi, 3 dpi, and 7 dpi (n = 6). (G) Proportion of CD4+ CD11b+ T cells among the CD3+ T cells in each group at 1 dpi, 3 dpi, and 7 dpi (n = 6). (H) CD11b MFI on CD4+ T cells in the injured brain between TBI and cervical lymphadenectomy mice at 7 dpi (n = 4). All data are shown as mean ± SD. *p < 0.05, **p < 0.01, ***p < 0.001, and ****p < 0.0001. # p < 0.05, ## p < 0.01, ### p < 0.001, and #### p < 0.0001. dpi, day post‐injury; MFI, mean fluorescence intensity; TBI, traumatic brain injury.
FIGURE 4
FIGURE 4
Ligating cervical afferent lymphatic vessels reduces brain T lymphocyte infiltration. (A) The specific experimental procedure for this section. (B) Display drawing of ligating afferent lymphatic vessels of CLNs; dCLNs (green arrow); cervical afferent lymphatic vessels (white arrow). (C–F) Proportion and count of infiltrating CD4+ T cells and CD4+ CD11b+ T cells in the injured brain after TBI at 1 dpi, 3 dpi, and 7 dpi (n = 6). (G) Proportion of brain CD4+ CD11b+ T cells among the CD3+ T cells in TBI and Ligation+TBI mice at 1 dpi, 3 dpi, and 7 dpi (n = 6). (H) MFI of CD11b on CD4+ T cells in the injured brain between TBI and cervical lymphadenectomy mice at 7 dpi (n = 4). All data are shown as mean ± SD. *p < 0.05, **p < 0.01, ***p < 0.001, and ****p < 0.0001. dCLNs, deep cervical lymph nodes; dpi, day post‐injury; MFI, mean fluorescence intensity; TBI, traumatic brain injury.
FIGURE 5
FIGURE 5
Brain‐to‐CLN signaling promotes the release of CD4+CD11b+ T cells from CLNs. (A) Visualized t‐SNE maps of CLNs cells from sham and TBI mice at 1 dpi, 3 dpi, and 7 dpi. (B) Heat map was based on the expression of 37 different parameters, as the Table S1 shows. Median intensities for each marker were calculated and plotted as heat maps to identify the respective immune cell populations. (C) The ratio of CLNs CD4+ T cells in TBI mice at 1 dpi, 3 dpi, and 7 dpi. Data of CyTOF from three independent mice were pooled together for analysis and visually depicting the results using a dumbbell plot. (D) The relative expression of cell markers (such as CD44, IFN‐γ, CD86, and CD11b) on the CD4+ T cells (including clusters 20, 22, and 24). (E and F) The count and proportion of CD4+CD11b+ T cells in the CLNs at 3 dpi and sham mice. (G) Location of CD3, CD4, and Ki67 in the visualized t‐SNE maps of CLNs between sham and TBI mice. (H and I) The proportion of CD4+ T, and CD4+CD11b+ T cells on the CD45+ cells in the CLNs of TBI and Ligation+TBI mice at 1 and 3 dpi (n = 8). (J) The count of CD4+CD11b+ T cells per 106 cells in the CLNs of TBI and Ligation+TBI mice at 1 and 3 dpi (n = 8). (K) The CLNs S1PR1 fluorescent staining in TBI and Ligation+TBI mice at 3 dpi. Scale 100 μm. (L and M) The count of S1PR1+ cells in the CLNs among TBI and Ligation+TBI mice (n = 6). (N and O) The CLNs S1PR1 MFI on CD4+ T, CD4+CD11b+ T cells between TBI and Ligation+TBI mice divided by S1PR1 MFI of sham mice (n = 4–6). Data are shown as mean ± SD. *p < 0.05, **p < 0.01, ***p < 0.001, and ****p < 0.0001. CLNs, deep cervical lymph nodes; CyTOF, cytometry by time‐of‐flight analysis; dpi, day post‐injury; IFN‐γ, interferon‐gamma; MFI, mean fluorescence intensity; S1PR1, sphingosine 1‐phosphate receptors‐1; TBI, traumatic brain injury.
FIGURE 6
FIGURE 6
CD4+CD11b+ T cells aggravated brain injury. (A) Schematic diagram of experimental operation. (B) The statistics of the rotarod experiment in each group (n = 8). (C) mNss results (n = 8). (D and E) The defect lesions of mice with 3D Slicer and the statistical volumetric histogram of defect lesions (n = 5–6). (F) Fluorescent staining of apoptosis. Fluorescence color: NeuN, red channel; TUNEL, green channel; DAPI, blue channel. Scale 100 μm. (G) The total number of neuro apoptosis on both sides of the lesion (n = 5). The area of measurement for statistical purposes is approximately 1 mm2 on each side of the lesion. (H) Representative western blots of β‐actin and IFN‐γ. (I) Quantification of relative protein expression normalized to the optical density of β‐actin (n = 6). All data are shown as mean ± SD. *p < 0.05, **p < 0.01, ***p < 0.001, and ****p < 0.0001. DAPI, 4′,6‐diamidino‐2‐phenylindole; dpi, day post‐injury; mNSS, modified neurological severity score; MRI, Magnetic Resonance Imaging; TUNEL, terminal deoxynucleotidyl transferase‐mediated dUTP nick end labeling (TUNEL) staining.

Similar articles

Cited by

References

    1. Corrigan F, Mander KA, Leonard AV, Vink R. Neurogenic inflammation after traumatic brain injury and its potentiation of classical inflammation. J Neuroinflammation. 2016;13(1):264. doi:10.1186/s12974-016-0738-9 - DOI - PMC - PubMed
    1. Collaborators GBDN. Global, regional, and national burden of neurological disorders, 1990‐2016: a systematic analysis for the global burden of disease study 2016. Lancet Neurol. 2019;18(5):459‐480. doi:10.1016/S1474-4422(18)30499-X - DOI - PMC - PubMed
    1. Corps KN, Roth TL, McGavern DB. Inflammation and neuroprotection in traumatic brain injury. JAMA Neurol. 2015;72(3):355‐362. doi:10.1001/jamaneurol.2014.3558 - DOI - PMC - PubMed
    1. Dinet V, Petry KG, Badaut J. Brain‐immune interactions and Neuroinflammation after traumatic brain injury. Front Neurosci. 2019;13:1178. doi:10.3389/fnins.2019.01178 - DOI - PMC - PubMed
    1. Bao W, Lin Y, Chen Z. The peripheral immune system and traumatic brain injury: insight into the role of T‐helper cells. Int J Med Sci. 2021;18(16):3644‐3651. doi:10.7150/ijms.46834 - DOI - PMC - PubMed

Publication types