Prediction of prognosis in oral squamous cell carcinoma using infrared microspectroscopy
- PMID: 38468595
- PMCID: PMC10928453
- DOI: 10.1002/cam4.7094
Prediction of prognosis in oral squamous cell carcinoma using infrared microspectroscopy
Abstract
Background: Estimation of prognosis of oral squamous cell carcinoma (OSCC) is inaccurate prior to surgery, only being effected following subsequent pathological analysis of the primary tumour and excised lymph nodes. Consequently, a proportion of patients are overtreated, with an increase in morbidity, or undertreated, with inadequate margins and risk of recurrence. We hypothesise that it is possible to accurately characterise clinical outcomes from infrared spectra arising from diagnostic biopsies. In this first step, we correlate survival with IR spectra derived from the primary tumour.
Methods: Infrared spectra were collected from tumour tissue from 29 patients with OSCC and subject to classification modelling.
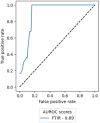
Results: The model had a median AUROC of 0.89 with regard to prognosis, a median specificity of 0.83, and a hazard ratio of 6.29 in univariate Cox proportional hazard modelling.
Conclusion: The data suggest that FTIR spectra may be a useful early biomarker of prognosis in OSCC.
Keywords: FTIR; OSCC; biomarker; infrared microspectroscopy; prognosis.
© 2024 The Authors. Cancer Medicine published by John Wiley & Sons Ltd.
Conflict of interest statement
The authors assert that they have no conflict of interest to declare.
Figures


Similar articles
-
Role of hyaluronan mediated motility receptor gene in oral squamous cell carcinoma and clinical prognosis.Zhong Nan Da Xue Xue Bao Yi Xue Ban. 2021 Dec 28;46(12):1315-1324. doi: 10.11817/j.issn.1672-7347.2021.200955. Zhong Nan Da Xue Xue Bao Yi Xue Ban. 2021. PMID: 35232899 Free PMC article. Chinese, English.
-
Extracellular vesicles miR-210 as a potential biomarker for diagnosis and survival prediction of oral squamous cell carcinoma patients.J Oral Pathol Med. 2022 Apr;51(4):350-357. doi: 10.1111/jop.13263. Epub 2021 Dec 1. J Oral Pathol Med. 2022. PMID: 34800057 Free PMC article.
-
Tumour mismatch repair protein loss is associated with advanced stage in oral cavity squamous cell carcinoma.Pathology. 2019 Dec;51(7):688-695. doi: 10.1016/j.pathol.2019.08.005. Epub 2019 Oct 18. Pathology. 2019. PMID: 31630878
-
Surgical tumour margins and their significance in oral squamous cell carcinoma.J Oral Pathol Med. 2022 Apr;51(4):311-314. doi: 10.1111/jop.13276. Epub 2022 Feb 8. J Oral Pathol Med. 2022. PMID: 35080080 Review.
-
Characterization and clinicopathological significance of circulating tumour cells in patients with oral squamous cell carcinoma.Int J Oral Maxillofac Surg. 2022 Mar;51(3):289-299. doi: 10.1016/j.ijom.2021.05.020. Epub 2021 Jun 19. Int J Oral Maxillofac Surg. 2022. PMID: 34154876 Review.
Cited by
-
Full fingerprint hyperspectral imaging of prostate cancer tissue microarrays within clinical timeframes using quantum cascade laser microscopy.Analyst. 2025 Apr 22;150(9):1741-1753. doi: 10.1039/d5an00046g. Analyst. 2025. PMID: 40084568 Free PMC article.
References
-
- Head and Neck Cancers Statistics . 2021. https://www.cancerresearchuk.org/health‐professional/cancer‐statistics/s....
-
- Gamez ME, Kraus R, Hinni ML, et al. Treatment outcomes of squamous cell carcinoma of the oral cavity in young adults. Oral Oncol. 2018;87:43‐48. - PubMed
-
- Amin MB, Greene FL, Edge SB, et al. The eighth edition AJCC cancer staging manual: continuing to build a bridge from a population‐based to a more “personalized” approach to cancer staging. CA Cancer J Clin. 2017;67:93‐99. - PubMed
-
- Shaw RJ, Lowe D, Woolgar JA, et al. Extracapsular spread in oral squamous cell carcinoma. Head Neck. 2009;36:714‐722. - PubMed
-
- Barry CP, Katre C, Papa E, et al. De‐escalation of surgery for early oral cancer – is it oncologically safe? Br J Oral Maxillofac Surg. 2013;51:30‐36. - PubMed
Publication types
MeSH terms
Grants and funding
LinkOut - more resources
Full Text Sources
Medical

