

Thermosensitive/thermochromic silicone and infrared thermography mapping in 60 consecutive cases of epilepsy surgery
- PMID: 38468653
- PMCID: PMC10927215
- DOI: 10.25259/SNI_763_2023
Thermosensitive/thermochromic silicone and infrared thermography mapping in 60 consecutive cases of epilepsy surgery
Abstract
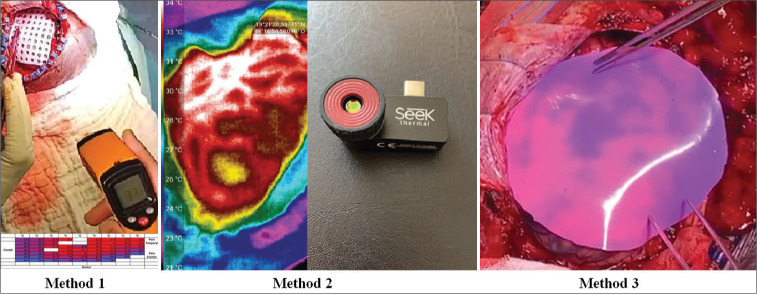
Background: Epilepsy surgery represents a therapeutic opportunity for those patients who do not respond to drug therapy. However, an important challenge is the precise identification of the epileptogenic area during surgery. Since it can be hard to delineate, it makes it necessary to use auxiliary tools as a guide during the surgical procedure. Electrocorticography (ECoG), despite having shown favorable results in terms of reducing post-surgical seizures, have certain limitations. Brain mapping using infrared thermography mapping and a new thermosensitive/thermochromic silicone (TTS) in epilepsy surgery has introduced a new resource of noninvasive and real-time devices that allow the localization of irritative zones.
Methods: Sixty consecutive patients with drug-resistant epilepsy with surgical indications who decided to participate voluntarily in the study were included in the study. We measured brain temperature using two quantitative methods and a qualitative method: the TTS sheet. In all cases, we used ECoG as the gold standard to identify irritative areas, and all brain tissue samples obtained were sent to pathology for diagnosis.
Results: In the subgroup in which the ECoG detected irritative areas (n = 51), adding the results in which there was a correlation with the different methods, the efficiency obtained to detect irritative areas is 94.11% (n = 48/51, P ≤ 0.0001) while the infrared thermography mapping method independently has an efficiency of 91.66% (P ≤ 0.0001). The TTS has a sensitivity of 95.71% and a specificity of 97.9% (P ≤ 0.0001) to detect hypothermic areas that correlate with the irritative zones detected by ECoG. No postoperative infections or wound dehiscence were documented, so the different methodologies used do not represent an additional risk for the surgical proceedings.
Conclusion: We consider that the infrared thermography mapping using high-resolution infrared thermography cameras and the TTS are both accurate and safe methods to identify irritative areas in epilepsy surgeries.
Keywords: Electrocorticography; Epilepsy surgery; Infrared thermography mapping; Thermochromic silicone; Thermosensitive silicone.
Copyright: © 2024 Surgical Neurology International.
Conflict of interest statement
The principal author may apply for a patent of the STT described.
Figures
Similar articles
-
Localization of irritative zones in epilepsy with thermochromic silicone.Surg Neurol Int. 2022 Jan 12;13:14. doi: 10.25259/SNI_1169_2021. eCollection 2022. Surg Neurol Int. 2022. PMID: 35127214 Free PMC article.
-
Thermography mapping patterns in temporal lobe epilepsy surgery.Surg Neurol Int. 2020 Feb 28;11:30. doi: 10.25259/SNI_549_2019. eCollection 2020. Surg Neurol Int. 2020. PMID: 32257556 Free PMC article.
-
Recording human electrocorticographic (ECoG) signals for neuroscientific research and real-time functional cortical mapping.J Vis Exp. 2012 Jun 26;(64):3993. doi: 10.3791/3993. J Vis Exp. 2012. PMID: 22782131 Free PMC article.
-
Presurgical intracranial investigations in epilepsy surgery.Handb Clin Neurol. 2019;161:45-71. doi: 10.1016/B978-0-444-64142-7.00040-0. Handb Clin Neurol. 2019. PMID: 31307620 Review.
-
Electrocorticography for seizure foci mapping in epilepsy surgery.J Clin Neurophysiol. 2013 Dec;30(6):554-70. doi: 10.1097/01.wnp.0000436898.10125.70. J Clin Neurophysiol. 2013. PMID: 24300981 Review.
References
-
- Alsaaod M, Büscher W. Detection of hoof lesions using digital infrared thermography in dairy cows. J Dairy Sci. 2012;95:735–42. - PubMed
LinkOut - more resources
Full Text Sources