Native microalgal-bacterial consortia from the Ecuadorian Amazon region: an alternative to domestic wastewater treatment
- PMID: 38468686
- PMCID: PMC10925762
- DOI: 10.3389/fbioe.2024.1338547
Native microalgal-bacterial consortia from the Ecuadorian Amazon region: an alternative to domestic wastewater treatment
Abstract
In low-middle income countries (LMIC), wastewater treatment using native microalgal-bacterial consortia has emerged as a cost-effective and technologically-accessible remediation strategy. This study evaluated the effectiveness of six microalgal-bacterial consortia (MBC) from the Ecuadorian Amazon in removing organic matter and nutrients from non-sterilized domestic wastewater (NSWW) and sterilized domestic wastewater (SWW) samples. Microalgal-bacterial consortia growth, in NSWW was, on average, six times higher than in SWW. Removal rates (RR) for NH4 +- N and PO4 3--P were also higher in NSWW, averaging 8.04 ± 1.07 and 6.27 ± 0.66 mg L-1 d-1, respectively. However, the RR for NO3 - -N did not significantly differ between SWW and NSWW, and the RR for soluble COD slightly decreased under non-sterilized conditions (NSWW). Our results also show that NSWW and SWW samples were statistically different with respect to their nutrient concentration (NH4 +-N and PO4 3--P), organic matter content (total and soluble COD and BOD5), and physical-chemical parameters (pH, T, and EC). The enhanced growth performance of MBC in NSWW can be plausibly attributed to differences in nutrient and organic matter composition between NSWW and SWW. Additionally, a potential synergy between the autochthonous consortia present in NSWW and the native microalgal-bacterial consortia may contribute to this efficiency, contrasting with SWW where no active autochthonous consortia were observed. Finally, we also show that MBC from different localities exhibit clear differences in their ability to remove organic matter and nutrients from NSWW and SWW. Future research should focus on elucidating the taxonomic and functional profiles of microbial communities within the consortia, paving the way for a more comprehensive understanding of their potential applications in sustainable wastewater management.
Keywords: microalgal-bacterial consortia; nutrients removal; organic matter removal; removal rates; wastewater treatment.
Copyright © 2024 López-Patiño, Cárdenas-Orrego, Torres, Navarrete, Champagne and Ochoa-Herrera.
Conflict of interest statement
The authors declare that the research was conducted in the absence of any commercial or financial relationships that could be construed as a potential conflict of interest.
Figures

 ) and total chlorophyll (
 ) evolution along 15 days of cultivation in NSWW (
 ) and SWW (
 ) for the treatment bioassays (T5) with microalgal-bacterial consortia M5 and abiotic controls in NSWW (
 ) and SWW (
 ), respectively.
 ) sCOD (
 ), NH4
+-N (
 ), PO4
3--P and (
 ) NO3
− -N along 15 days of cultivation in NSWW and SWW with MBC M1, M2, M3, M4, M5 and M6 in T1, T2, T3, T4, T5, T6, respectively and abiotic controls (AC).
 ) and SWW (
 ) in T2 (M2) (
 ) and abiotic control (
 ). (D) Concentration profile of NO3
−-N in NSWW (
 ) and SWW (
 ) for consortium T2 (M2) (
 ) and the abiotic control (
 ) at day 0 and also day 15.
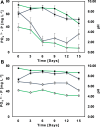
 ) and pH measurement (
 ) along 15 days of cultivation in NSWW (
 ) and SWW (
 ) for native MBC T2 (A, B) abiotic control.
References
-
- Acién F. G., Gómez-Serrano C., Morales-Amaral M. M., Fernández-Sevilla J. M., Molina-Grima E. (2016). Wastewater treatment using microalgae: how realistic a contribution might it be to significant urban wastewater treatment? Appl. Microbiol. Biotechnol. 100 (21), 9013–9022. 10.1007/s00253-016-7835-7 - DOI - PubMed
-
- Adnan A. I., Ong M. Y., Nomanbhay S., Show P. L. (2020). Determination of dissolved CO2 concentration in culture media: evaluation of pH value and mathematical data. Processes 8 (11), 1373. 10.3390/pr8111373 - DOI
-
- Al-Housni M., Hussein A. H., Yeboah D., Hashim K. S., Abdulhadi B., Shubbar A. A., et al. (2020). Electrochemical removal of nitrate from wastewater. IOP Conf. Ser. Mater. Sci. Eng. 888 (1), 012037. 10.1088/1757-899X/888/1/012037 - DOI
-
- An M., Gao L., Zhao W., Chen W., Li M. (2020). Effects of nitrogen forms and supply mode on lipid production of microalga scenedesmus obliquus. Energies 13 (3), 697. 10.3390/en13030697 - DOI
-
- APHA (2002). American public health association; American water works association; water environment federation. Stand. Methods Exam. Water Wastewater 02, 1–541.
LinkOut - more resources
Full Text Sources

