

Association between diabetic status and risk of all-cause and cause-specific mortality on dialysis following first kidney allograft loss
- PMID: 38468698
- PMCID: PMC10926326
- DOI: 10.1093/ckj/sfad245
Association between diabetic status and risk of all-cause and cause-specific mortality on dialysis following first kidney allograft loss
Abstract
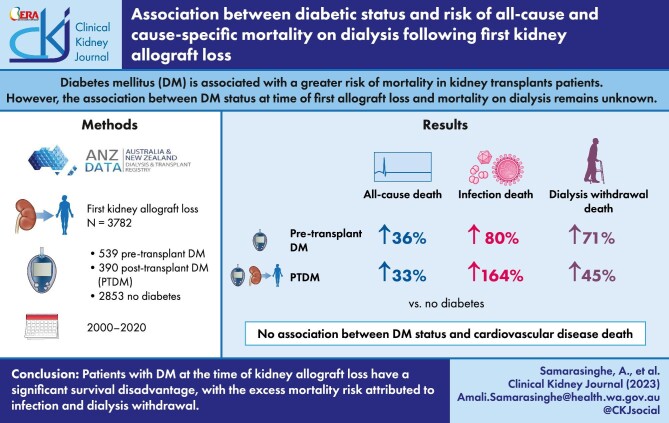
Background: Diabetes mellitus (DM) is associated with a greater risk of mortality in kidney transplant patients, primarily driven by a greater risk of cardiovascular disease (CVD)-related mortality. However, the associations between diabetes status at time of first allograft loss and mortality on dialysis remain unknown.
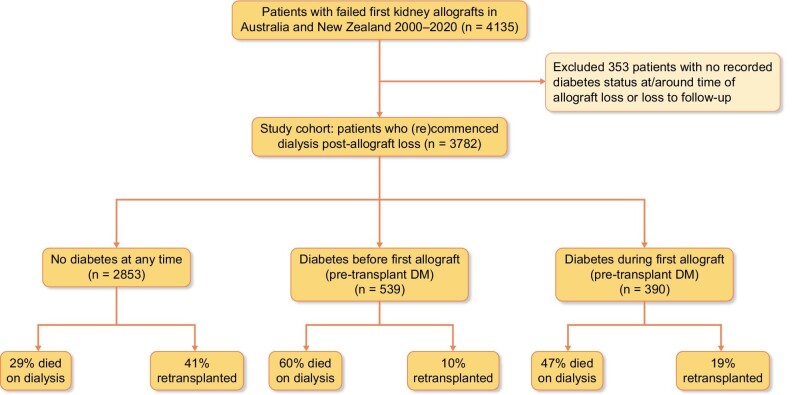
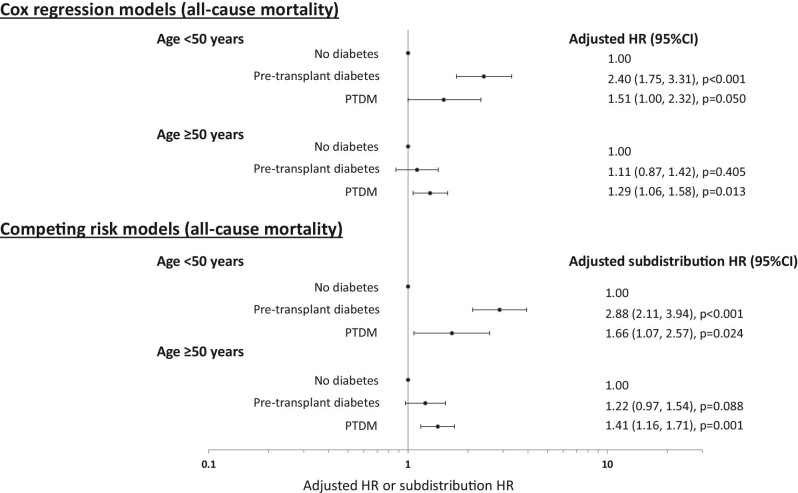
Methods: All patients with failed first kidney allografts transplanted in Australia and New Zealand between 2000 and 2020 were included. The associations between diabetes status at first allograft loss, all-cause and cause-specific mortality were examined using competing risk analyses, separating patients with diabetes into those with pre-transplant DM or post-transplant diabetes mellitus (PTDM).
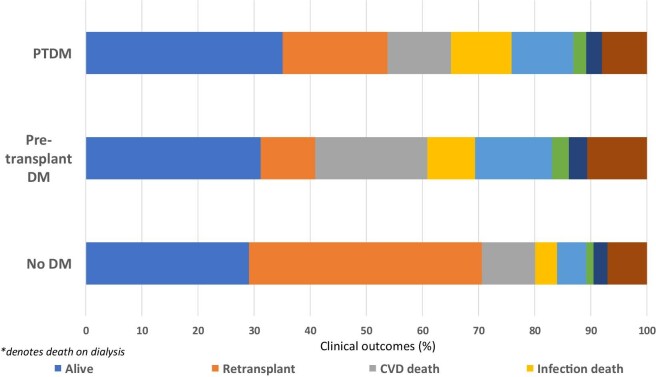
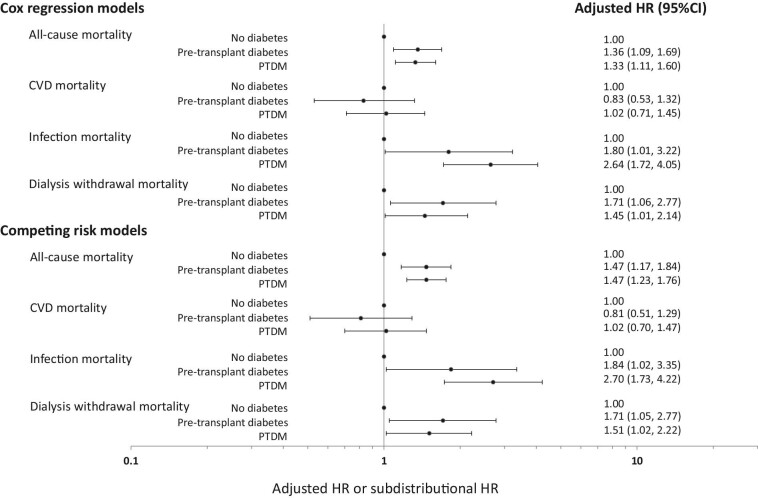
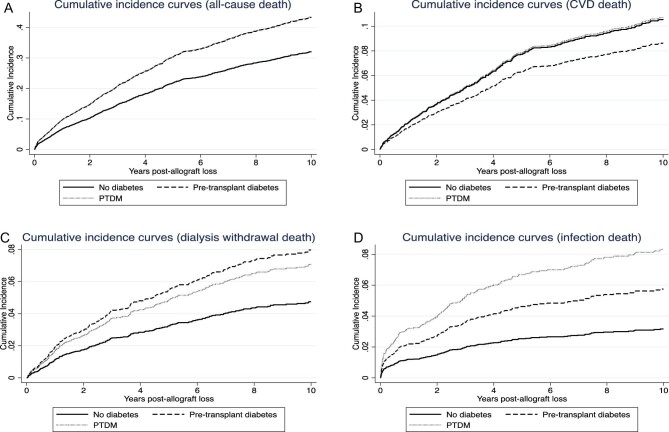
Results: Of 3782 patients with a median (IQR) follow-up duration of 2.7 (1.1-5.4) years, 539 (14%) and 390 (10%) patients had pre-transplant DM or developed PTDM, respectively. In the follow-up period, 1336 (35%) patients died, with 424 (32%), 264 (20%) and 199 (15%) deaths attributed to CVD, dialysis withdrawal and infection, respectively. Compared to patients without DM, the adjusted subdistribution HRs (95% CI) for pre-transplant DM and PTDM for all-cause mortality on dialysis were 1.47 (1.17-1.84) and 1.47 (1.23-1.76), respectively; for CVD-related mortality were 0.81 (0.51-1.29) and 1.02 (0.70-1.47), respectively; for infection-related mortality were 1.84 (1.02-3.35) and 2.70 (1.73-4.20), respectively; and for dialysis withdrawal-related mortality were 1.71 (1.05-2.77) and 1.51 (1.02-2.22), respectively.
Conclusions: Patients with diabetes at the time of kidney allograft loss have a significant survival disadvantage, with the excess mortality risk attributed to infection and dialysis withdrawal.
Keywords: allograft loss; diabetes; dialysis; kidney failure; mortality.
© The Author(s) 2024. Published by Oxford University Press on behalf of the ERA.
Conflict of interest statement
There are no conflicts of interest.
Figures
References
-
- Australia and New Zealand Dialysis and Transplant Registry . ANZDATA Registry 43rd Report, Chapter 1: Incidence of Renal Replacement Therapy for End Stage Kidney Disease. Adelaide, Australia, 2020.
-
- Grace B, Excell L, Dent H et al. Australia and New Zealand Dialysis and Transplant Registry. ANZDATA Registry 43rd Report, Chapter 2: New Patients. Adelaide, Australia, 2010.
-
- United States Renal Data System . 2019 Annual Data Report: Epidemiology of Kidney Disease in the United States. National Institutes of Health, National Institute of Diabetes and Digestive and Kidney Diseases, Bethesda, MD, 2019.
-
- United States Renal Data System . 2014 USRDS Annual Data Report Volume 2: End-Stage Renal Disease. National Institutes of Health, National Institute of Diabetes and Digestive and Kidney Diseases, Bethesda, MD, 2014.
LinkOut - more resources
Full Text Sources
