Search Behavior of Individual Foragers Involves Neurotransmitter Systems Characteristic for Social Scouting
- PMID: 38468879
- PMCID: PMC10926421
- DOI: 10.3389/finsc.2021.664978
Search Behavior of Individual Foragers Involves Neurotransmitter Systems Characteristic for Social Scouting
Abstract
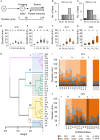
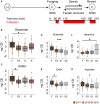
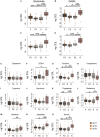
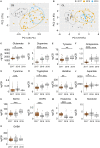
In honey bees search behavior occurs as social and solitary behavior. In the context of foraging, searching for food sources is performed by behavioral specialized foragers, the scouts. When the scouts have found a new food source, they recruit other foragers (recruits). These recruits never search for a new food source on their own. However, when the food source is experimentally removed, they start searching for that food source. Our study provides a detailed description of this solitary search behavior and the variation of this behavior among individual foragers. Furthermore, mass spectrometric measurement showed that the initiation and performance of this solitary search behavior is associated with changes in glutamate, GABA, histamine, aspartate, and the catecholaminergic system in the optic lobes and central brain area. These findings strikingly correspond with the results of an earlier study that showed that scouts and recruits differ in the expression of glutamate and GABA receptors. Together, the results of both studies provide first clear support for the hypothesis that behavioral specialization in honey bees is based on adjusting modulatory systems involved in solitary behavior to increase the probability or frequency of that behavior.
Keywords: GABA; glutamate; histamine; honey bee; mass spectrometry—LC-MS/MS; octopamine.
Copyright © 2021 Chatterjee, Bais, Brockmann and Ramesh.
Conflict of interest statement
The authors declare that the research was conducted in the absence of any commercial or financial relationships that could be construed as a potential conflict of interest.
Figures

Similar articles
-
A role for octopamine in honey bee division of labor.Brain Behav Evol. 2002;60(6):350-9. doi: 10.1159/000067788. Brain Behav Evol. 2002. PMID: 12563167
-
Mass Spectrometric Quantification of Arousal Associated Neurochemical Changes in Single Honey Bee Brains and Brain Regions.ACS Chem Neurosci. 2019 Apr 17;10(4):1950-1959. doi: 10.1021/acschemneuro.8b00254. Epub 2018 Oct 26. ACS Chem Neurosci. 2019. PMID: 30346719
-
Inter-individual variation in honey bee dance intensity correlates with expression of the foraging gene.Genes Brain Behav. 2020 Jan;19(1):e12592. doi: 10.1111/gbb.12592. Epub 2019 Jul 8. Genes Brain Behav. 2020. PMID: 31145838
-
Characterization of Genomic Variants Associated with Scout and Recruit Behavioral Castes in Honey Bees Using Whole-Genome Sequencing.PLoS One. 2016 Jan 19;11(1):e0146430. doi: 10.1371/journal.pone.0146430. eCollection 2016. PLoS One. 2016. PMID: 26784945 Free PMC article.
-
Spatial cognition in the context of foraging styles and information transfer in ants.Anim Cogn. 2020 Nov;23(6):1143-1159. doi: 10.1007/s10071-020-01423-x. Epub 2020 Aug 25. Anim Cogn. 2020. PMID: 32840698 Review.
Cited by
-
The Neural Signature of Visual Learning Under Restrictive Virtual-Reality Conditions.Front Behav Neurosci. 2022 Feb 16;16:846076. doi: 10.3389/fnbeh.2022.846076. eCollection 2022. Front Behav Neurosci. 2022. PMID: 35250505 Free PMC article.
-
Integrating computer vision and molecular neurobiology to bridge the gap between behavior and the brain.Curr Opin Insect Sci. 2024 Dec;66:101259. doi: 10.1016/j.cois.2024.101259. Epub 2024 Sep 5. Curr Opin Insect Sci. 2024. PMID: 39244088 Free PMC article. Review.
References
-
- Lindauer M. Ein beitrag zur frage der arbeitsteilung im bienenstaat. Z Vgl Physiol. (1952) 34:299–345. 10.1007/BF00298048 - DOI
-
- Seeley TD. Division of labor between scouts and recruits in honeybee foraging. Behav Ecol Sociobiol. (1983) 12:253–9. 10.1007/BF00290778 - DOI
-
- zu Oettingen-Spielberg T. Über das Wesen der Suchbiene. Z Vgl Physiol. (1949) 31:454–89. 10.1007/BF00338037 - DOI
-
- Seeley TD. The Wisdom of the Hive: The Social Physiology of Honey Bee Colonies. Cambridge, MA: Harvard University Press; (1995).
LinkOut - more resources
Full Text Sources

