. 2024 Feb 28;10(5):e26993.
doi: 10.1016/j.heliyon.2024.e26993. eCollection 2024 Mar 15.

Deciphering the molecular and clinical characteristics of TREM2, HCST, and TYROBP in cancer immunity: A comprehensive pan-cancer study

Affiliations

Deciphering the molecular and clinical characteristics of TREM2, HCST, and TYROBP in cancer immunity: A comprehensive pan-cancer study

Piao Zheng et al. Heliyon. .

Abstract

Background: Hematopoietic cell signal transducer (HCST) and tyrosine kinase-binding protein (TYROBP) are triggering receptors expressed on myeloid cells 2 (TREM2), which are pivotal in the immune response to disease. Despite growing evidence underscoring the significance of TREM2, HCST, and TYROBP in certain forms of tumorigenesis, a comprehensive pan-cancer analysis of these proteins is lacking.

Methods: Multiple databases were synthesized to investigate the relationship between TREM2, HCST, TYROBP, and various cancer types. These include prognosis, methylation, regulation by long non-coding RNAs and transcription factors, immune signatures, pathway activity, microsatellite instability (MSI), tumor mutational burden (TMB), single-cell transcriptome profiling, and drug sensitivity.

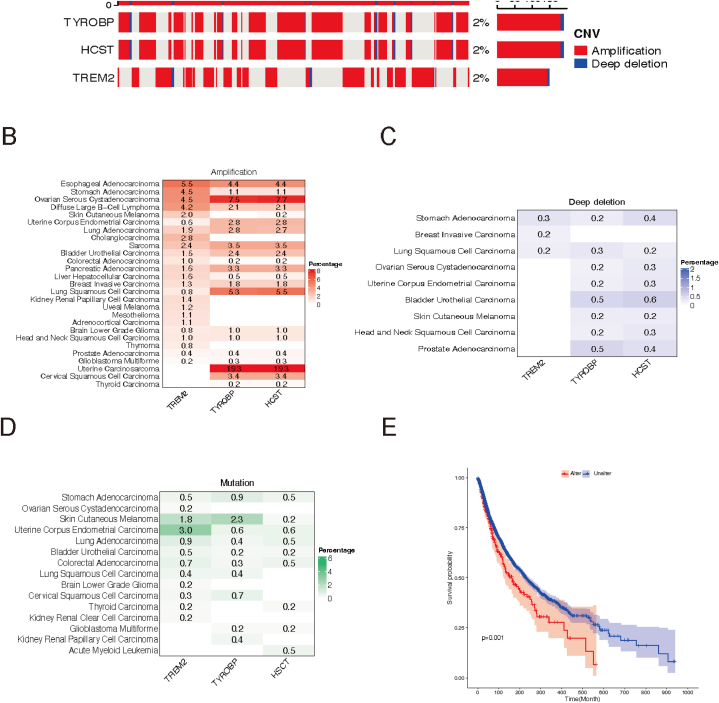
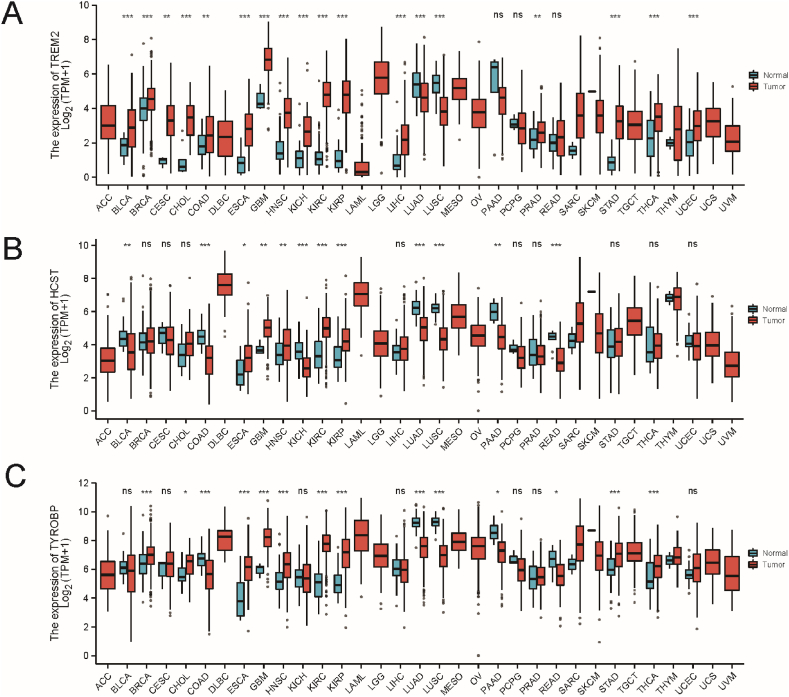
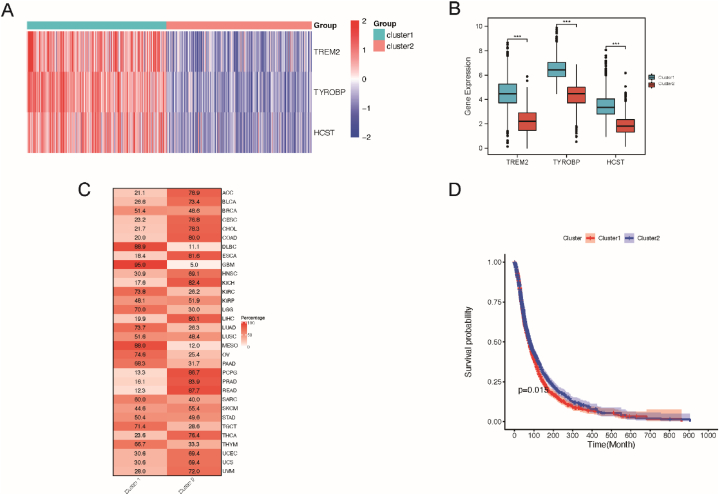
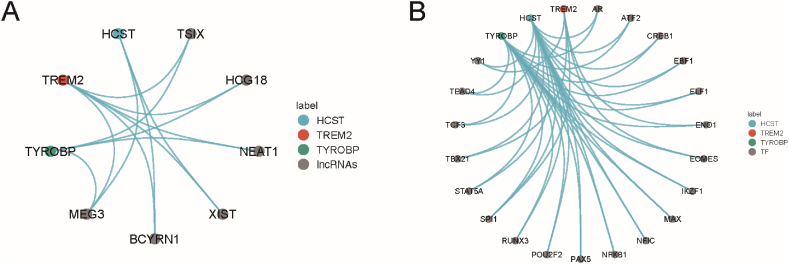
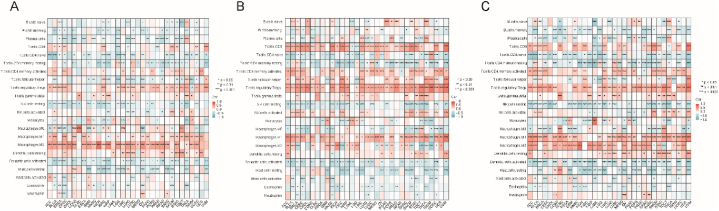
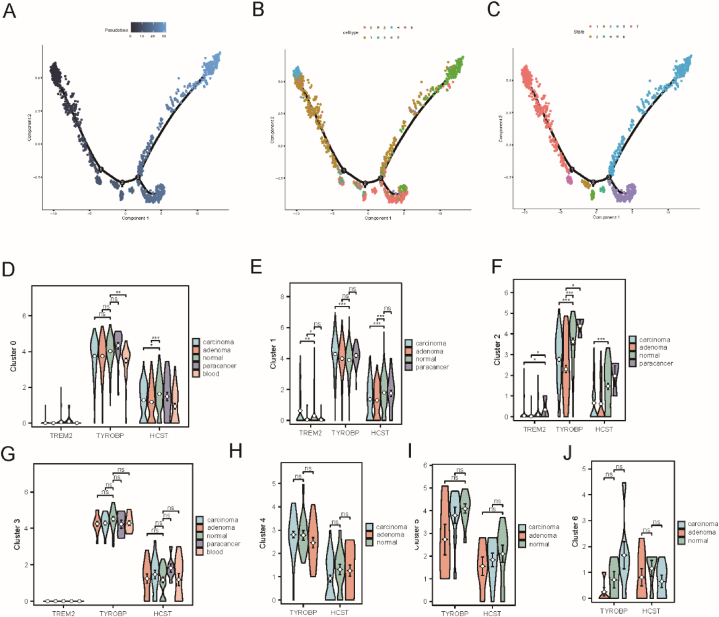
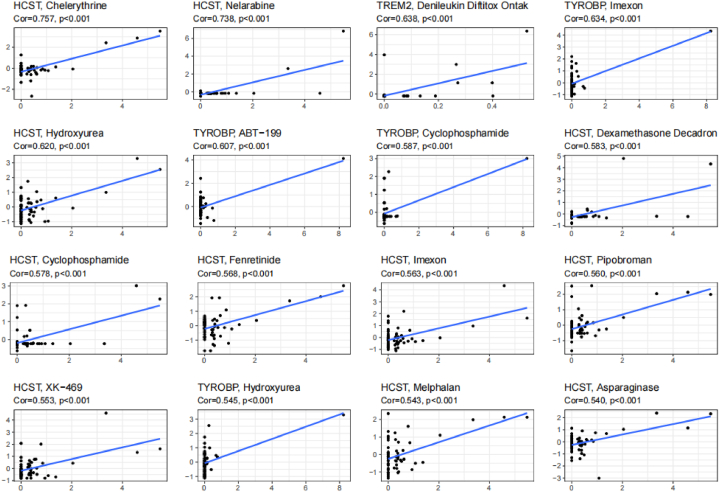
Results: TREM2, HCST, and TYROBP displayed extensive somatic changes across numerous tumors, and their mRNA expression and methylation levels influenced patient outcomes across multiple cancer types. long non-coding RNA (lncRNA) -messenger RNA (mRNA) and TF-mRNA regulatory networks involving TREM2, HCST, and TYROBP were identified, with lncRNA MEG3 and the transcription factor SIP1 emerging as potential key regulators. Further immune analyses indicated that TREM2, HCST, and TYROBP play critical roles in immune-related pathways and macrophage differentiation, and may be significantly associated with TGF-β and SMAD9. Furthermore, the expression of TREM2, HCST, and TYROBP correlated with the immunotherapy markers TMB and MSI, and influenced sensitivity to immune-targeted drugs, thereby indicating their potential as predictors of immunotherapy outcomes.

Conclusion: This study offers valuable insights into the roles of TREM2, HCST, and TYROBP in tumor immunotherapy, suggesting their potential as prognostic markers and therapeutic targets for various cancers.

Keywords: Hematopoietic cell signal transducer (HCST); Pan-cancer; TYRO protein tyrosine kinase-binding protein (TYROBP); Triggering receptor expressed on myeloid cells 2 (TREM2); Tumor immunity.


Conflict of interest statement

The authors declare that they have no known competing financial interests or personal relationships that could have appeared to influence the work reported in this paper.

Figures

Fig. 1
Fig. 1
Genomic alterations in TREM2, HCST and TYROBP. (A) CNV landscape of TREM2, HCST and TYROBP in tumors. Each row represents a gene, and each column represents a patient. Only patients with TREM2, HCST and TYROBP CNV alterations are shown. The mutation rate for each gene is shown in the right label. (B–D) Frequency distributions of amplifications (B), deep deletions (C), and mutations (D) in different cancer types. The numbers in the figure represent the specific mutation rate, and the intensity of the color is proportional to the frequency. (E) Kaplan–Meier curve showing the overall survival difference between wild-type and mutated samples. Wild-type samples (Unalter) is represented by a blue line and mutated samples (Alter) is represented by a red line. (For interpretation of the references to color in this figure legend, the reader is referred to the Web version of this article.)
Fig. 2
Fig. 2
Differences in mRNA expression between tumor samples and normal samples (***p< 0.001, **p< 0.01, *p< 0.05). (A) TREM2, (B) HCST, (C) TYROBP. ACC, adrenocortical carcinoma; BLCA, bladder urothelial carcinoma; BRCA, breast invasive carcinoma; CESC, cervical squamous cell carcinoma and endocervical adenocarcinoma; CHOL, cholangiocarcinoma; COAD, colon adenocarcinoma; DLBC, diffuse large B-cell lymphoma; EMT, epithelial-mesenchymal transition; ESCA, esophageal carcinoma; GBM, glioblastoma multiforme; HNSC, head and neck squamous cell carcinoma; KIRC, kidney renal clear cell carcinoma; KIRP, kidney renal papillary cell carcinoma; LAML, acute myeloid leukemia; LGG, low-grade glioma; LIHC, liver hepatocellular carcinoma; LUAD, lung adenocarcinoma; LUSC, lung squamous cell carcinoma; MESO, mesothelioma; OV, ovarian serous cystadenocarcinoma; PAAD, pancreatic adenocarcinoma; PCPG, pheochromocytoma and paraganglioma; PRAD, prostate adenocarcinoma; READ, rectum adenocarcinoma; SARC, sarcoma; SKCM, skin cutaneous melanoma; STAD, stomach adenocarcinoma; TGCT, testicular germ cell tumors; THCA, thyroid carcinoma; THYM, thymoma; UCEC, uterine corpus endometrial carcinoma; UCS, uterine carcinosarcoma; UVM, thymoma and uveal melanoma.
Fig. 3
Fig. 3
Unsupervised consensus clustering based on mRNA expression of TREM2, HCST and TYROBP. (A) Two distinct clusters of TREM2, HCST and TYROBP. Each row represents a cuprotosis regulator and each column represents a patient. Red indicates high expression; blue indicates low expression. Expression data were normalized by z-score. (B) Boxplots showing differences in TREM2, HCST and TYROBP gene expression in the two clusters. Differences were tested by Student's t-test. ***p < 0.001, (C) Sample distributions in two clusters. Each row represents a tumor type, and each column represents a cluster. The numbers and red intensity in each box indicate the percentage of samples classified in the corresponding cluster. (D) Kaplan–Meier curve showing the overall survival difference between cluster 1 and cluster 2. Cluster 1 is represented by a blue line and cluster 2 is represented by a red line. (For interpretation of the references to color in this figure legend, the reader is referred to the Web version of this article.)
Fig. 4
Fig. 4
Prognostic analysis of TREM2, HCST and TYROBP. (A) OS, (B) PFI, (C) DFI. *p < 0.05, **p < 0.01, ***p < 0.001. Only statistically significant tumor types are shown. Red squares indicate that high gene expression is associated with worse prognosis, and blue dotted squares indicate that low gene expression or high score is associated with worse prognosis. (D) Survival analysis of the TREM2, HCST and TYROBP across cancers. (For interpretation of the references to color in this figure legend, the reader is referred to the Web version of this article.)
Fig. 5
Fig. 5
Methylation analysis of TREM2, HCST and TYROBP. (A–C) Differences in mRNA methylation between tumor samples and normal samples. (A) TREM2, (B) TYROBP, (C) HCST. (D) Correlation between methylation and mRNA expression. Blue squares represent negative correlation, red squares represent positive correlation, and the darker the color, the higher the correlation. *p < 0.05, **p < 0.01, ***p < 0.001. (E) Relationship between TREM2, HCST, TYROBP methylation and survival. Red squares indicate that high methylation is associated with decreased survival, and blue squares indicate that high methylation is associated with increased survival. *p < 0.05, **p < 0.01, ***p < 0.001. Only statistically significant tumor types are shown. (For interpretation of the references to color in this figure legend, the reader is referred to the Web version of this article.)
Fig. 6
Fig. 6
LncRNA, and TF regulatory networks of TREM2, HCST and TYROBP. (A–C) Differences in mRNA methylation between (A) The lncRNA–mRNA regulatory network showing lncRNAs target at least two of TREM2, HCST and TYROBP. (B) The TF–mRNA regulatory network showing TFs target at least two of TREM2, HCST and TYROBP.
Fig. 7
Fig. 7
Heatmap of correlations with the abundance of 22 immune cells in each cancer type. Each column is a cancer type, and each row is a type of immune cell. Red represents positive correlation; blue represents negative correlation. (A) TREM2, (B) HCST, (C) TYROBP. (For interpretation of the references to color in this figure legend, the reader is referred to the Web version of this article.)
Fig. 8
Fig. 8
Heatmap of correlations with the immunomodulators in each cancer type. Each column is a cancer type, and each row is a type of immunomodulator. Red represents positive correlation; blue represents negative correlation. (A) TREM2, (B) HCST, (C) TYROBP. (For interpretation of the references to color in this figure legend, the reader is referred to the Web version of this article.)
Fig. 9
Fig. 9
Differences in TREM2, HCST and TYROBP activity between immune subtypes (C1–C6). (A) Box plot of differences in TREM2, HCST and TYROBP activity between immune subtypes. The p-values between each of the two immune subtypes were less than 0.001. (B)Stacked bar graph showing the proportion of 33 tumor types in each immune subtype.
Fig. 10
Fig. 10
Pathway analyses of TREM2, HCST and TYROBP. (A)Pathways enriched in more than 20 cancers in single-gene GSEA (TREM2, HCST, TYROBP). (B) Venn Diagram visualizing the interaction of enriched pathways in more than 20 cancers between TREM2, HCST and TYROBP.
Fig. 11
Fig. 11
Tmb and MSI correlation of TREM2, HCST and TYROBP. (A) Correlation between TREM2 and TBM, (B) correlation between HCST and TBM, (C) correlation between TYROBP and TBM, (D) correlation between TREM2 and MSI (E) correlation between HCST and MSI, (F) correlation between TYROBP and MSI.
Fig. 12
Fig. 12
Single-cell analysis of TREM2, HCST and TYROBP. (A) UMAP map of GSE161277 cell clusters. (B) Most important 5 marker genes of 8 cell types. (C) AUC scores of TREM2, HCST and TYROBP across cell types. (D) UMAP plot of AUC score for each cell. (E) Venn diagram visualizing the intersection between GSVA results of differential pathways of macrophages between normal tissue and adenoma tissue and the enriched pathways of TREM2, HCST and TYROBP in single-gene gene set enrichment pathways (F) Bar graph visualizing the t value of GSVA of intersecting pathways.
Fig. 13
Fig. 13
Analysis of macrophage differentiation time of TREM2, HCST and TYROBP. (A) Cell differentiation time axis, (B) Distribution of macrophages in different clusters on the cell trajectory curve (C) Distribution of macrophages in different states on the cell trajectory curve (D–J) The expression of TREM2, HCST and TYROBP in cluster 0–6, and Wilcoxon test was performed between normal tissues and other pathological tissues(*p < 0.05, **p < 0.01, ***p < 0.001).
Fig. 14
Fig. 14
Drug Sensitivity Analysis of TREM2, HCST and TYROBP. Scatter plot of drug sensitivity results in the top 16 of significance.

Similar articles

Cited by

References

    1. Lancet T. Global cancer: overcoming the narrative of despondency. Lancet. 2023;401(10374):319. - PubMed
    1. Sung H., et al. Global cancer Statistics 2020: GLOBOCAN Estimates of Incidence and Mortality worldwide for 36 cancers in 185 Countries. CA Cancer J Clin. 2021;71(3):209–249. - PubMed
    1. Maiorino L., et al. Innate immunity and cancer Pathophysiology. Annu. Rev. Pathol. 2022;17:425–457. - PMC - PubMed
    1. Fu T., et al. Spatial architecture of the immune microenvironment orchestrates tumor immunity and therapeutic response. J. Hematol. Oncol. 2021;14(1):98. - PMC - PubMed
    1. Hammond T.R., Marsh S.E., Stevens B. Immune signaling in neurodegeneration. Immunity. 2019;50(4):955–974. - PMC - PubMed