. 2024 Mar 1;10(5):e27159.
doi: 10.1016/j.heliyon.2024.e27159. eCollection 2024 Mar 15.

GTP binding protein 2 maintains the quiescence, self-renewal, and chemoresistance of mouse colorectal cancer stem cells via promoting Wnt signaling activation

Affiliations

GTP binding protein 2 maintains the quiescence, self-renewal, and chemoresistance of mouse colorectal cancer stem cells via promoting Wnt signaling activation

Chao Ke et al. Heliyon. .

Abstract

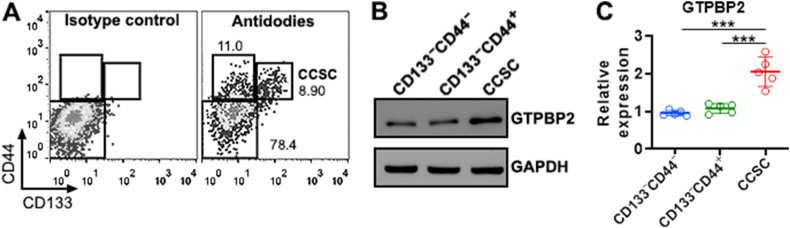
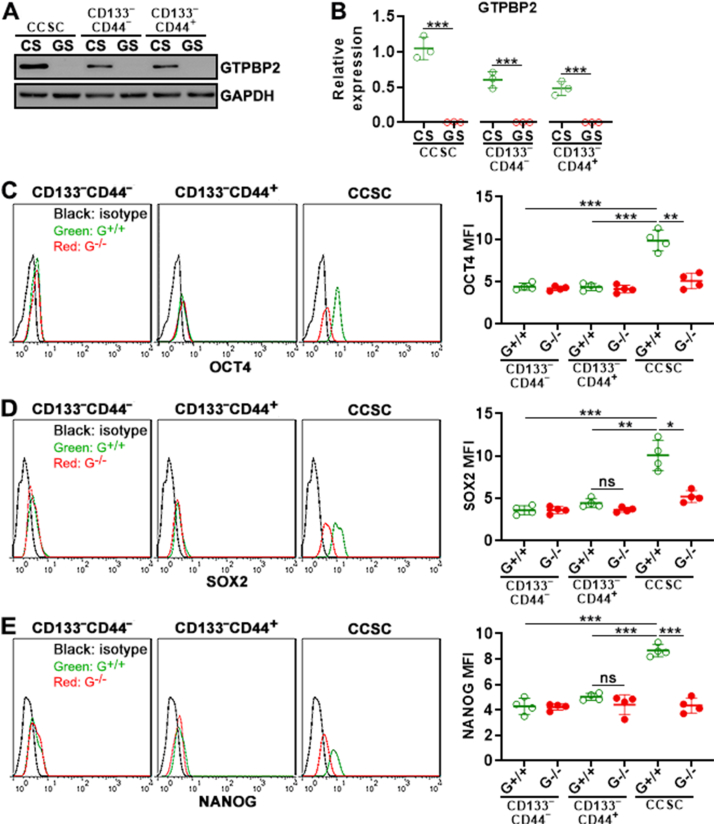
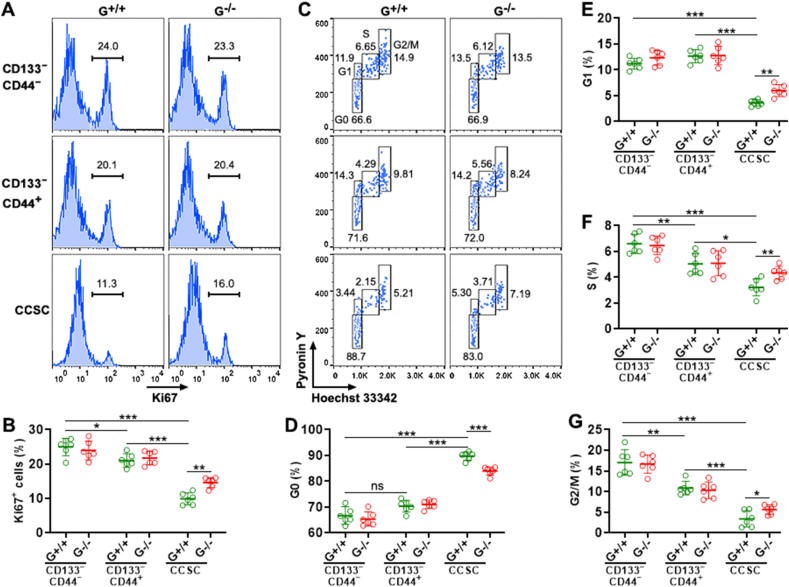
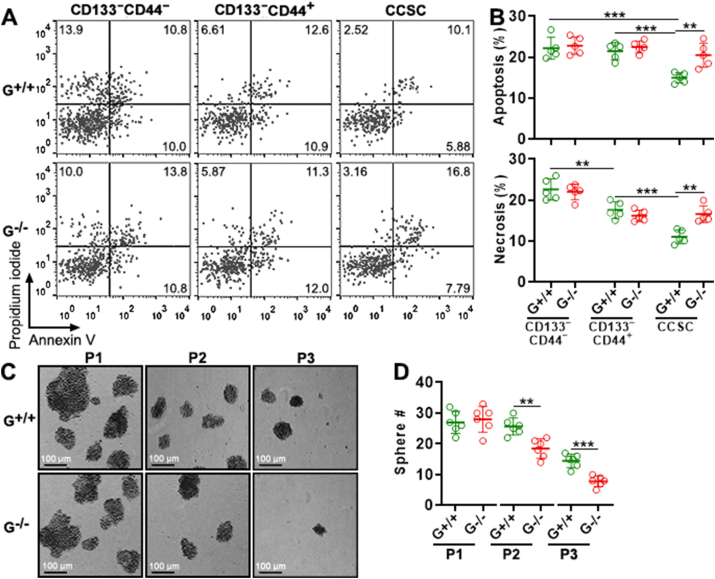
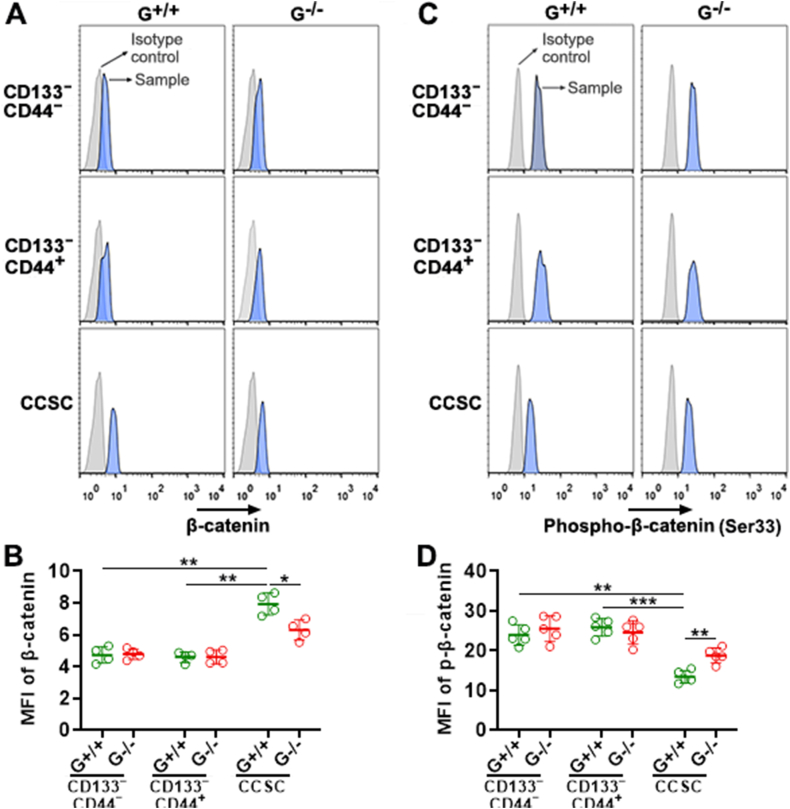
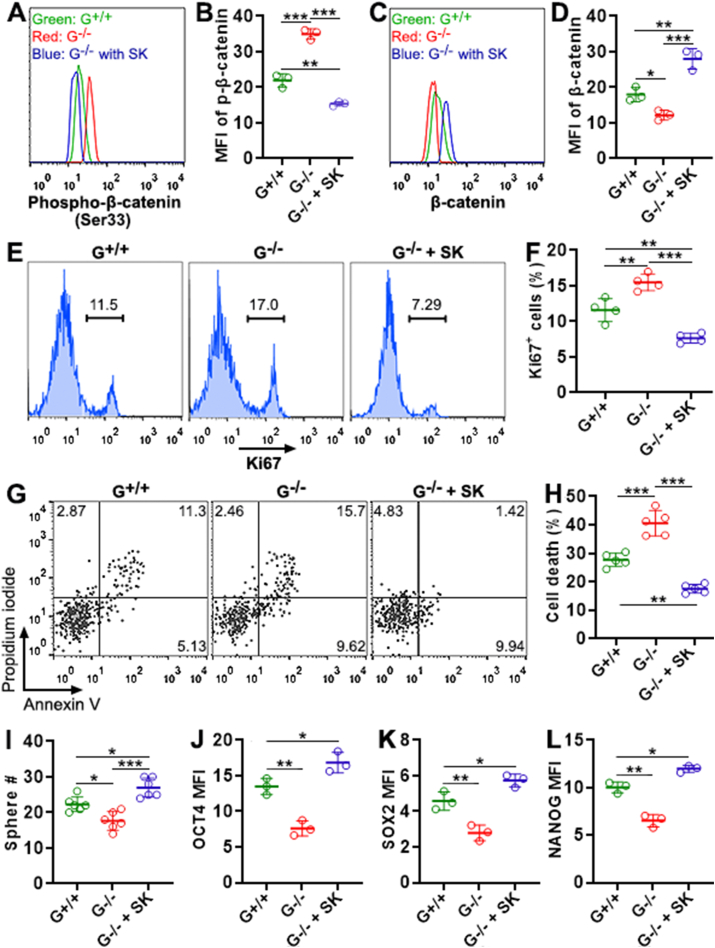
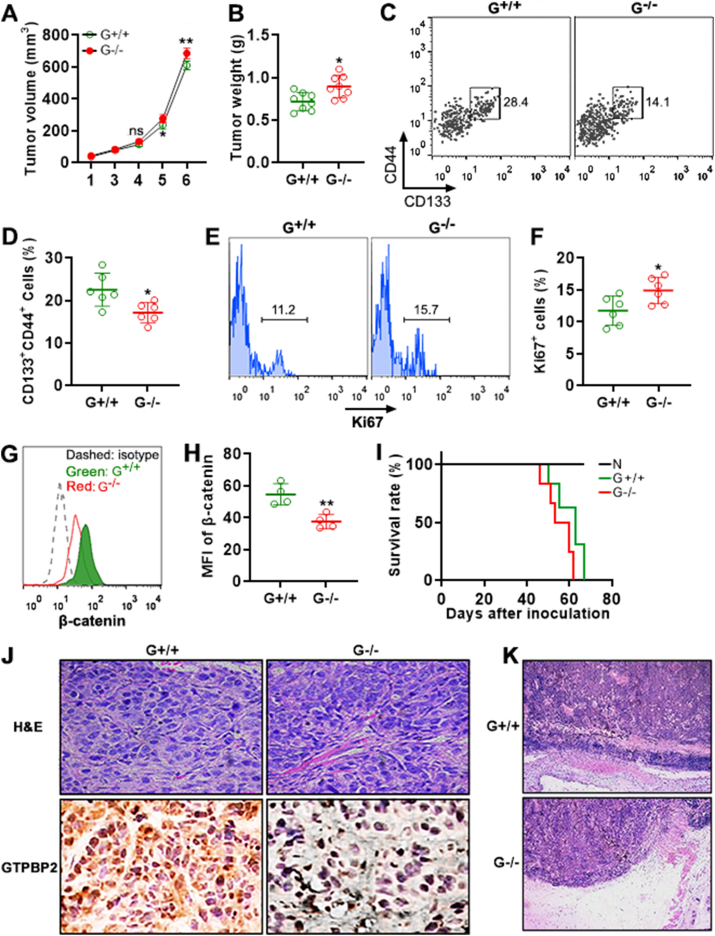
Colorectal cancer (CRC) is one of the most common cancers and the second most deadly cancer across the globe. Colorectal cancer stem cells (CCSCs) fuel CRC growth, metastasis, relapse, and chemoresistance. A complete understanding of the modulatory mechanisms of CCSC biology is essential for developing efficacious CRC treatment. In the current study, we characterized the expression and function of GTP binding protein 2 (GTPBP2) in a chemical-induced mouse CRC model. We found that GTPBP2 was expressed at a higher level in CD133+CD44+ CCSCs compared with other CRC cells. Using a lentivirus-based Cas9/sgRNA system, GTPBP2 expression was ablated in CRC cells in vitro. GTPBP2 deficiency caused the following effects on CCSCs: 1) Significantly accelerating proliferation and increasing the proportions of cells at G1, S, and G2/M phase; 2) Impairing resistance to 5-Fluorouracil; 3) Weakening self-renewal but not impacting cell migration. In addition, GTPBP2 deficiency remarkably decreased β-catenin expression while increasing β-catenin phosphorylation in CCSCs. These effects of GTPBP2 were present in CCSCs but not in other CRC cell populations. The Wnt agonist SKL2001 completely abolished these changes in GTPBP2-deficient CCSCs. When GTPBP2-deficient CCSCs were implanted in nude mice, they exhibited consistent changes compared with GTPBP2-expressing CCSCs. Collectively, this study indicates that GTPBP2 positively modulates Wnt signaling to reinforce the quiescence, self-renewal, and chemoresistance of mouse CCSCs. Therefore, we disclose a novel mechanism underlying CCSC biology and GTPBP2 could be a therapeutic target in future CRC treatment.

Keywords: Chemoresistance; Colorectal cancer stem cells; GTP binding protein 2; Proliferation; Self-renewal; Stemness.


Conflict of interest statement

The authors declare that they have no known competing financial interests or personal relationships that could have appeared to influence the work reported in this paper.

Figures

Fig. 1
Fig. 1
GTPBP2 expression in primary CRC cells. (A) Representative dot plots showing CRC cell subsets. CCSC: colorectal cancer stem cells. (B and C) GTPBP2 expression in sorted CRC cell subsets. Representative Immunoblotting images are shown in (B) and statistics are shown in (C). N = 5 independent samples per group. Each sample contains cells pooled from five mice. ***: P < 0.001. One-way ANOVA.
Fig. 2
Fig. 2
Lentivirus-mediated Gtpbp2 knockout in primary CRC cells. (A) GTPBP2 protein in GFP+ cells of CRC cell subsets on post-infection day 2. CS: control lentivirus encoding a scrambled sgRNA. GS: lentivirus encoding the Gtpbp2 sgRNA. CCSC: colorectal cancer stem cells. (B) Statistics of GTPBP2 protein in GFP+ cells. (C to E) OCT4 (C), SOX2 (D), and NANOG (E) expression in GFP+ cells of CRC cell subsets on post-infection day 2. Left panels: representative histograms. Right panels: Statistics of the mean fluorescence of each marker. Isotype: isotype control. G+/+: Gtpbp2+/+ cells. G−/−: Gtpbp2−/− cells. N = 3 or 4 independent samples (no replicates) per group. Student's t-test for (B) and One-way ANOVA for (C to E). ns: not significant.
Fig. 3
Fig. 3
The effect of Gtpbp2 knockout on CRC cell proliferation. (A and B) Ki67 expression in Gtpbp2+/+ and Gtpbp2−/− CRC cell subpopulations. Representative histograms are shown in (A). Statistics of the frequencies of Ki67+ cells are shown in (B). I: subset I. II: subset II. CCSC: colorectal cancer stem cells. G+/+: Gtpbp2+/+ cells. G−/−: Gtpbp2−/− cells. (C to G) Hoechst 33342 and Pyronin Y staining showing the cell cycle status. Representative dot plots are shown in (C). Statistics of the frequencies of cells at each cell cycle phase are shown in (D to G). N = 6 independent samples per group. *: P < 0.05. **: P < 0.01. ***: P < 0.001. One-way ANOVA.
Fig. 4
Fig. 4
The effect of Gtpbp2 knockout on chemoresistance, migration, and self-renewal of CRC cells. (A and B) Apoptosis and necrosis of Gtpbp2+/+ and Gtpbp2−/− CRC cell subsets after 48-h 5-FU treatment. Representative dot plots are in (A) and statistics are in (B). G+/+: Gtpbp2+/+ cells. G−/−: Gtpbp2−/− cells. (C and D) Sphere formation by Gtpbp2+/+ and Gtpbp2−/− CCSCs. Representative tumor sphere images are in (C). Statistics of sphere numbers are in (D). P1: passage 1. P2: passage 2. P3: passage 3. Original magnification: 50 × . N = 5 independent samples per group. **: P < 0.01. ***: P < 0.001. One-way ANOVA.
Fig. 5
Fig. 5
The effect of Gtpbp2 knockout on β-catenin expression. (A and B) β-catenin expression in Gtpbp2+/+ and Gtpbp2−/− CRC cell subsets on post-infection day 2. Representative histograms are in (A). Statistics of the mean fluorescence of β-catenin are in (B). G+/+: Gtpbp2+/+ cells. G−/−: Gtpbp2−/− cells. (C and D) Phosphorylated β-catenin on post-infection day 2. Representative histograms are in (C). Statistics of the mean fluorescence of phosphorylated β-catenin are in (D). N = 4 or 5 independent samples (no replicates) per group. *: P < 0.05. **: P < 0.01. ***: P < 0.001. One-way ANOVA.
Fig. 6
Fig. 6
The effect of Wnt agonist SKL2001 on Gtpbp2−/− CCSCs. (A and B) Phosphorylated β-catenin after Gtpbp2−/− CCSCs were treated with 20 μM SKL2001 for 24 h. G+/+: Gtpbp2+/+ CCSCs. G−/−: Gtpbp2−/− CCSCs. G−/− with SK: Gtpbp2−/− CCSCs treated with SKL2001. Representative histograms are in (A). Statistics of the mean fluorescence of phosphorylated β-catenin are in (B). (C and D) β-catenin expression after Gtpbp2−/− CCSCs were treated with SKL2001 for 24 h. Representative histograms are in (C). Statistics are in (D). (E and F) Ki67 expression after Gtpbp2−/− CCSCs were treated with SKL2001 for 24 h. Representative histograms are in (E). Statistics are in (F). (G and H) Apoptosis and necrosis of Gtpbp2−/− CCSCs in the presence of SKL2001 and 5-FU. Representative dot plots are in (G). Statistics of total cell death (apoptosis + necrosis) are in (H). (I) Passage-2 sphere formation. (J to L) The mean fluorescence of OCT4, SOX2, and NANOG in Gtpbp2−/− CCSCs. N = 3 to 6 independent samples (no replicates) per group in (B, D, F, H, and I). Three samples in duplicate were shown in each group in (J). *: P < 0.05. **: P < 0.01. ***: P < 0.001. One-way ANOVA.
Fig. 7
Fig. 7
Gtpbp2 knockout effects in vivo. (A) Subcutaneous tumor volume. G+/+: Gtpbp2+/+ CCSC-derived tumor. G−/−: Gtpbp2−/− CCSC-derived tumor. (B) Tumor weight at week 6. (C and D) Frequencies of CD133+CD44+ cells in Gtpbp2+/+ CCSC-derived tumor cells and Gtpbp2−/− CCSC-derived tumor cells, respectively. Representative dot plots are in (C). Statistics are in (D). (E and F) Ki67 expression in Gtpbp2+/+ CCSC-derived or Gtpbp2−/− CCSC-derived CD133+CD44+ cells. Representative histograms are in (E). Statistics are in (F). (G and H) β-catenin expression in Gtpbp2+/+ CCSC-derived or Gtpbp2−/− CCSC-derived CD133+CD44+ cells. Representative histograms are in (G). Statistics are in (H). (I) Survival curve of Gtpbp2+/+ CCSC-inoculated mice or Gtpbp2−/− CCSC-inoculated mice. N = 4 to 10 mice (each dot represents an individual mouse) per group. *: P < 0.05. **: P < 0.01. Student's t-test. (J) Histological analysis of tumor implants derived from Gtpbp2+/+ CCSCs and Gtpbp2−/− CCSCs. Upper panel: H&E staining. Lower panel: GTPBP2 staining in tumors. Original magnification = 400 × . (K) Representative H&E staining images showing the edges of tumor implants. Original magnification = 100 × .

Similar articles

References

    1. Hervieu C., et al. The role of cancer stem cells in colorectal cancer: from the basics to novel clinical trials. Cancers. 2021;13(5):1092. - PMC - PubMed
    1. Angius A., et al. Portrait of cancer stem cells on colorectal cancer: molecular biomarkers, signaling pathways and miRNAome. Int. J. Mol. Sci. 2021;22(4):1603. - PMC - PubMed
    1. Haraguchi N., et al. CD133+CD44+ population efficiently enriches colon cancer initiating cells. Ann. Surg. Oncol. 2008;15(10):2927–2933. - PubMed
    1. Sahlberg S.H., et al. Evaluation of cancer stem cell markers CD133, CD44, CD24: association with AKT isoforms and radiation resistance in colon cancer cells. PLoS One. 2014;9(4) - PMC - PubMed
    1. Tsunekuni K., et al. CD44/CD133-Positive colorectal cancer stem cells are sensitive to trifluridine exposure. Sci. Rep. 2019;9(1) - PMC - PubMed