. 2024 Feb 26:15:1354435.
doi: 10.3389/fendo.2024.1354435. eCollection 2024.

Transcriptome profiling reveals superovulation with the gonadotropin-releasing hormone agonist trigger impaired embryo implantation in mice

Affiliations

Transcriptome profiling reveals superovulation with the gonadotropin-releasing hormone agonist trigger impaired embryo implantation in mice

Meng Li et al. Front Endocrinol (Lausanne). .

Abstract

Introduction: Superovulation is a critical step in assisted reproductive technology, but the use of human chorionic gonadotropin (hCG) as a trigger for superovulation can result in ovarian hyperstimulation. Thus, the use of Gonadotropin-releasing hormone agonist (GnRHa) trigger has been increasingly adopted, although it has been associated with a higher rate of pregnancy failure compared to natural cycles. This study aimed to investigate the effect of GnRHa trigger on embryo implantation in a mouse model.

Methods: Mice in the superovulation (PG) group were administered 7.5 IU of PMSG, followed by the injection of 3.5 μg of GnRHa (Leuprorelin) 48 h later, while mice in the control group (CTR) mated naturally. We compared the number of oocytes, blastocysts, and corpus luteum between the two groups and the implantation sites after the transfer of natural blastocysts. Ovaries, uterus, and serum 2 and 4 days after mating were collected for qRT-PCR, transcriptome sequencing, and hormone assays.

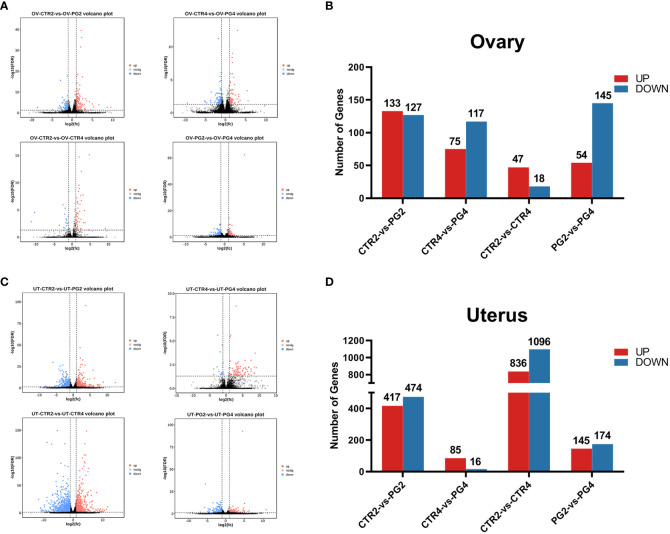
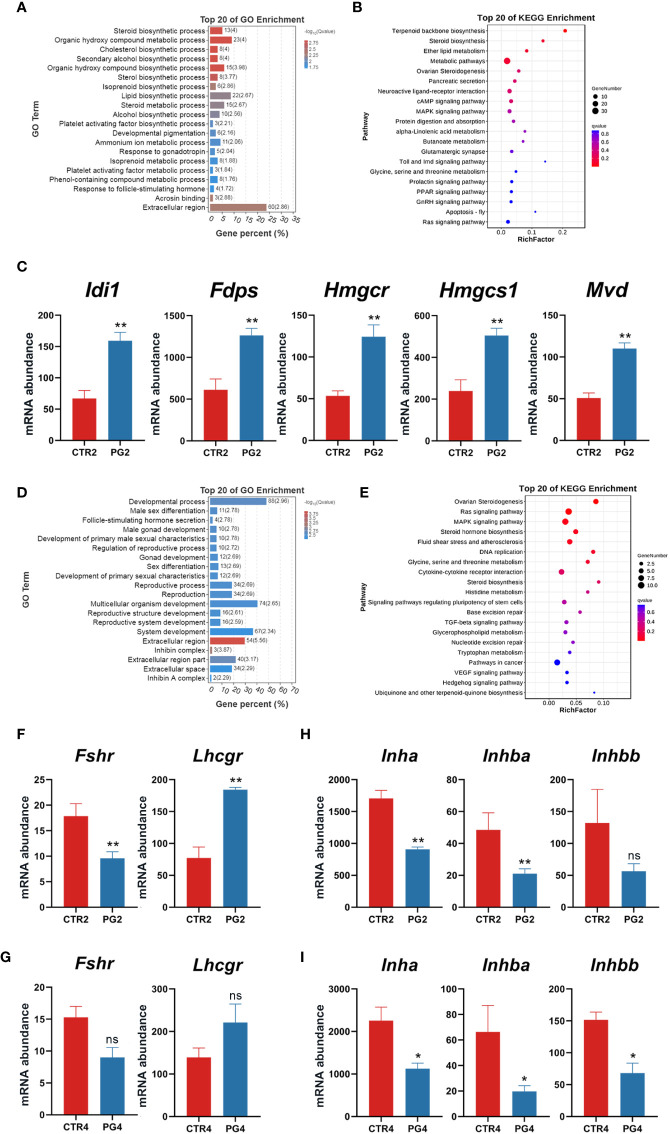
Results: The PG group had more oocytes, blastocysts, and corpus luteum after superovulation than the CTR group. However, the mRNA expression of leukemia inhibitory factor (Lif) and the number of implantation sites were reduced in the PG group. The ELISA assay revealed that superovulation increased ovarian estrogen secretion. The transcriptome analysis showed that superphysiological estrogen led to a response of the uterus to a high estrogen signal, resulting in abnormal endometrium and extracellular matrix remodeling and up-regulation of ion transport and inflammation-related genes.

Conclusion: Our findings suggest that a combination of PMSG and GnRHa trigger impaired embryo implantation in mice, as the excessive uterine response to superphysiological estrogen levels can lead to the change of gene expression related to endometrial remodeling, abnormal expression of uterine ion transport genes and excessive immune-related genes.

Keywords: gonadotropin-releasing hormone agonist; ovary; superovulation; transcriptome; uterine receptivity.


Conflict of interest statement

The authors declare that the research was conducted in the absence of any commercial or financial relationships that could be construed as a potential conflict of interest.

Figures

Figure 1
Figure 1
Superovulation led to impaired implantation in mice. (A) The difference of ovulations in control (CTR) and superovulation (PG) groups on 1 dpc. (n = 7). (B) The difference of blastocysts in CTR and PG groups on 4 dpc. (n = 7). (C) The difference of corpus luteum (CL) in CTR and PG groups on 4 dpc. (n = 3). (D) Implantation sites in CTR and PG groups on 8 dpc. (n = 29). (E) Uterine receptivity related gene mRNA expression in CTR and PG groups on 4 dpc. (n = 3). Lif, leukemia inhibitory factor. Hoxa10, homeobox A10. Itgb3, integrin beta 3. CTR4, control group on 4 dpc. PG4, superovulation group on 4 dpc. *p < 0.05. ns, no significance. Scale bar: (A, B) is 200 µm; (C) is 500 µm; (D) is 1 cm.
Figure 2
Figure 2
Transcriptome differences in mice ovary and uterus by superovulation and different time points after mating. (A, B) Volcano plots and bar plots of differentially expressed genes (DEGs) in ovaries between different groups. (C, D) Volcano plots and bar plots of differentially expressed genes in the uterus between different groups. CTR2, control group on 2 dpc. PG2, superovulation group on 2 dpc. CTR4, control group on 4 dpc. PG4, superovulation group on 4 dpc. (n = 3).
Figure 3
Figure 3
Superovulation caused the abnormal ovarian response to gonadotropins. (A) The top 20 of Gene Ontology (GO) analysis of differentially expressed genes (DEGs) between CTR2 and PG2 groups. (B) The top 20 of Kyoto Encyclopedia of Genes and Genomes (KEGG) pathway analysis of DEGs between CTR2 and PG2 groups. (C) DEGs enriched in terpenoid backbone biosynthesis between CTR2 and PG2 groups. (D) The top 20 of GO analysis of DEGs between CTR4 and PG4 groups. (E) The top 20 of KEGG pathway analysis of DEGs between CTR4 and PG4 groups. (F) Follicle-stimulating hormone receptor (Fshr) and luteinizing hormone/choriogonadotropin receptor (Lhcgr) mRNA expression between CTR2 and PG2 groups. (G) Fshr and Lhcgr mRNA expression between CTR4 and PG4 groups. (H) Inhibin-related gene mRNA expression between CTR2 and PG2 groups. (I) Inhibin-related gene mRNA expression between CTR4 and PG4 groups. Idi1, isopentenyl-diphosphate delta isomerase. Mvd, mevalonate (diphospho) decarboxylase. Hmgcs1, 3-hydroxy-3-methylglutaryl-Coenzyme A synthase 1. Hmgcr, 3-hydroxy-3-methylglutaryl-Coenzyme A reductase. Fdps, farnesyl diphosphate synthetase. Inha, inhibin alpha. Inhba, inhibin beta-A. Inhbb, inhibin beta-B. CTR2, control group on 2 dpc. PG2, superovulation group on 2 dpc. CTR4, control group on 4 dpc. PG4, superovulation group on 4 dpc. *FDR < 0.05. **FDR < 0.01. ns, no significance. (n = 3).
Figure 4
Figure 4
Superovulation led to abnormal ovarian steroid hormone synthesis and secretion. (A) Estrogen (E2) and progesterone (P4) concentrations between CTR2 and PG2 groups. (B) Estrogen (E2) and progesterone (P4) concentrations between CTR4 and PG4 groups. (C) The mRNA expression of key enzymes for steroid hormone synthesis between CTR2 and PG2 groups in the ovary. (D) The mRNA expression of key enzymes for steroid hormone synthesis between CTR4 and PG4 groups in the ovary. (E) Estrogen receptor 1 (Esr1) and progesterone receptor (Pgr) mRNA expression between CTR2 and PG2 groups in the uterus. (F) Esr1 and Pgr mRNA expression between CTR4 and PG4 groups in the uterus. (G) DEGs of E2-responsive gene mRNA expression between CTR4 and PG4 groups in the uterus. Cyp11a1, cytochrome P450, family 11, subfamily a, polypeptide 1. Star, steroidogenic acute regulatory protein. Hsd3b1, hydroxy-delta-5-steroid dehydrogenase, 3 beta and steroid deltaisomerase 1. Cyp17a1, cytochrome P450, family 17, subfamily a, polypeptide 1. Cyp19a1, cytochrome P450, family 19, subfamily a, polypeptide 1. Hsd17b1, hydroxysteroid (17-beta) dehydrogenase 1. Lif, leukemia inhibitory factor. Cftr, cystic fibrosis transmembrane conductance regulator. Prap1, proline-rich acidic protein 1. Ltf, lactotransferrin. CTR2, control group on 2 dpc. PG2, superovulation group on 2 dpc. CTR4, control group on 4 dpc. PG4, superovulation group on 4 dpc. (A, B) **p < 0.01. (C-G) *FDR < 0.05. **FDR < 0.01. ns, no significance. (n = 3).
Figure 5
Figure 5
Abnormal remodeling of extracellular matrix and epithelial remodeling in the uterus after superovulation. (A) The top 20 of Gene Ontology (GO) analysis of differentially expressed genes (DEGs) in cell components between CTR2 and PG2 groups. (B) The top 20 of Kyoto Encyclopedia of Genes and Genomes (KEGG) pathway analysis of DEGs between CTR2 and PG2 groups. (C) DEGs of claudin (Clnd) family mRNA expression in CTR2 vs. PG2 groups and CTR4 vs. PG4 groups. (D) DEGs of gap junction protein family and tight junction protein 3 (Tjp3) mRNA expression in CTR2 vs. PG2 groups and CTR4 vs. PG4 groups. (E) DEGs of cadherin (Cdh) family mRNA expression in CTR2 vs. PG2 groups and CTR4 vs. PG4 groups. (F) DEGs of mucin (Muc) family mRNA expression in CTR2 vs. PG2 groups and CTR4 vs. PG4 groups. (G) Adherens junction-associated protein 1 (Ajap1) and junctional cadherin complex regulator (Jhy) mRNA expression in CTR2 vs. PG2 groups and CTR4 vs. PG4 groups. (H) DEGs of extracellular matrix component proteins mRNA expression between CTR2 and PG2 groups. (I) DEGs of matrix metallopeptidase (Mmp) family mRNA expression in CTR2 vs. PG2 groups and CTR4 vs. PG4 groups. Gjb, gap junction protein, beta. Gja3, gap junction protein, alpha 3. Ecm1, extracellular matrix protein 1. Efemp1, epidermal growth factor-containing fibulin-like extracellular matrix protein 1. Spon1, spondin 1, (f-spondin) extracellular matrix protein. CTR2, control group on 2 dpc. PG2, superovulation group on 2 dpc. CTR4, control group on 4 dpc. PG4, superovulation group on 4 dpc. *FDR < 0.05. **FDR < 0.01. ns, no significance. (n = 3).
Figure 6
Figure 6
Superovulation results in abnormal ion transport and an excessive immune environment in the uterus. (A) The top 20 of Gene Ontology (GO) analysis of differentially expressed genes (DEGs) between CTR4 and PG4 groups. (B) The top 20 of Kyoto Encyclopedia of Genes and Genomes (KEGG) pathway analysis of DEGs between CTR4 and PG4 groups. (C) DEGs of ion transport-related gene for the heatmap between CTR4 and PG4 groups in the uterus. (D) All DEGs were donut-mapped between CTR4 and PG4 groups in the uterus. (E) The top 20 DEGs donut map between CTR4 and PG4 groups in the uterus. (F) The top 20 of DEGs heatmap between CTR4 and PG4 groups in the uterus. (G, H) The mRNA expression level of differentially expressed genes (DEGs) in the ovary and uterus was ascertained by RNA sequencing (RNA-Seq) and quantitative real-time PCR (qRT-PCR). *Immune-related genes. Each color represents the percentage of each part of the total (target genes number/total genes number) in the donut map. Inhba, inhibin beta-A. Hsd17b7, hydroxysteroid (17-beta) dehydrogenase 7. Cyp17a1, cytochrome P450, family 17, subfamily a, polypeptide 1. Lif, leukemia inhibitory factor. Prap1, proline-rich acidic protein 1. H2-Ea, histocompatibility 2, class II antigen E alpha. (n = 3).

Similar articles

Cited by

References

    1. Wang H, Dey SK. Roadmap to embryo implantation: clues from mouse models. Nat Rev Genet (2006) 7:185–99. doi: 10.1038/nrg1808 - DOI - PubMed
    1. Monsivais D, Nagashima T, Prunskaite-Hyyryläinen R, Nozawa K, Shimada K, Tang S, et al. . Endometrial receptivity and implantation require uterine BMP signaling through an ACVR2A-SMAD1/SMAD5 axis. Nat Commun (2021) 12:3386. doi: 10.1038/s41467-021-23571-5 - DOI - PMC - PubMed
    1. Finn CA, Martin L. The role of the oestrogen secreted before oestrus in the preparation of the uterus for implantation in the mouse. J Endocrinol (1970) 47:431–8. doi: 10.1677/joe.0.0470431 - DOI - PubMed
    1. Tamura H, Yoshida H, Kikuchi H, Josaki M, Mihara Y, Shirafuta Y, et al. . The clinical outcome of Dienogest treatment followed by in vitro fertilization and embryo transfer in infertile women with endometriosis. J Ovarian Res (2019) 12:123. doi: 10.1186/s13048-019-0597-y - DOI - PMC - PubMed
    1. Opøien HK, Fedorcsak P, Omland AK, Abyholm T, Bjercke S, Ertzeid G, et al. . In vitro fertilization is a successful treatment in endometriosis-associated infertility. Fertil Steril (2012) 97:912–8. doi: 10.1016/j.fertnstert.2012.01.112 - DOI - PubMed

LinkOut - more resources