. 2024 Feb 26:15:1342404.
doi: 10.3389/fimmu.2024.1342404. eCollection 2024.

Histidine-rich glycoprotein in metabolic dysfunction-associated steatohepatitis-related disease progression and liver carcinogenesis

Affiliations

Histidine-rich glycoprotein in metabolic dysfunction-associated steatohepatitis-related disease progression and liver carcinogenesis

Beatrice Foglia et al. Front Immunol. .

Abstract

Background: Metabolic dysfunction-associated steatotic liver disease (MASLD), previously non-alcoholic fatty liver disease (NAFLD), is a leading cause of chronic liver disease worldwide. In 20%-30% of MASLD patients, the disease progresses to metabolic dysfunction-associated steatohepatitis (MASH, previously NASH) which can lead to fibrosis/cirrhosis, liver failure as well as hepatocellular carcinoma (HCC). Here we investigated the role of histidine-rich glycoprotein (HRG), a plasma protein produced by hepatocytes, in MASLD/MASH progression and HCC development.

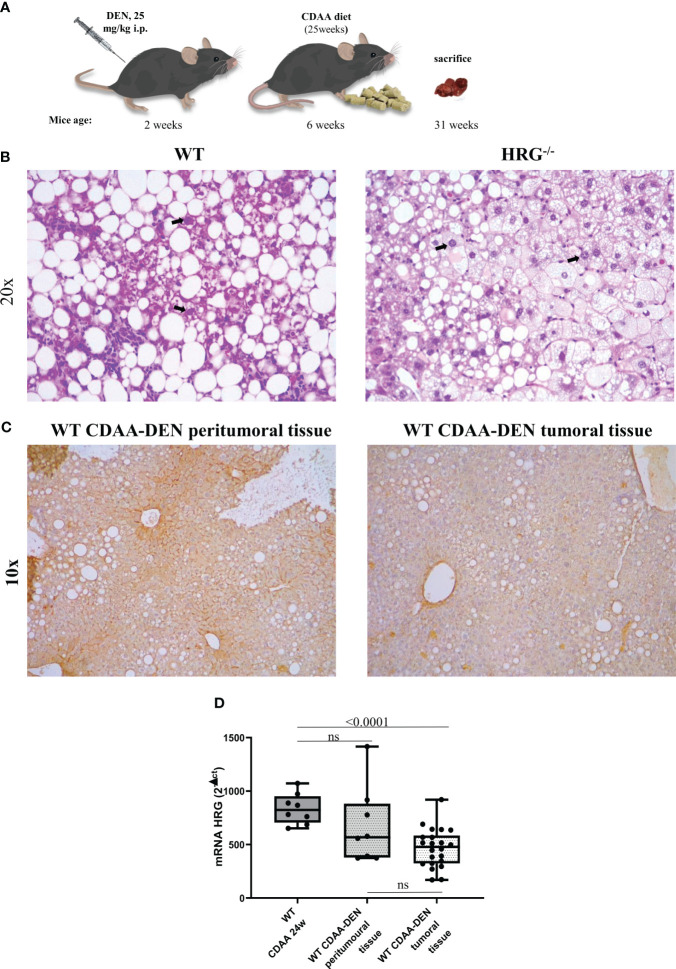
Methods: The role of HRG was investigated by morphological, cellular, and molecular biology approaches in (a) HRG knock-out mice (HRG-/- mice) fed on a CDAA dietary protocol or a MASH related diethyl-nitrosamine/CDAA protocol of hepatocarcinogenesis, (b) THP1 monocytic cells treated with purified HRG, and (c) well-characterized cohorts of MASLD patients with or without HCC.

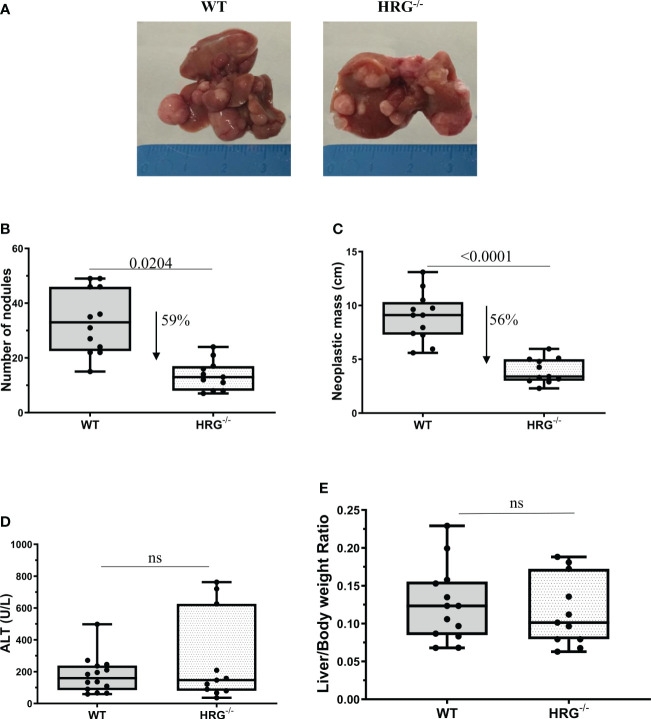
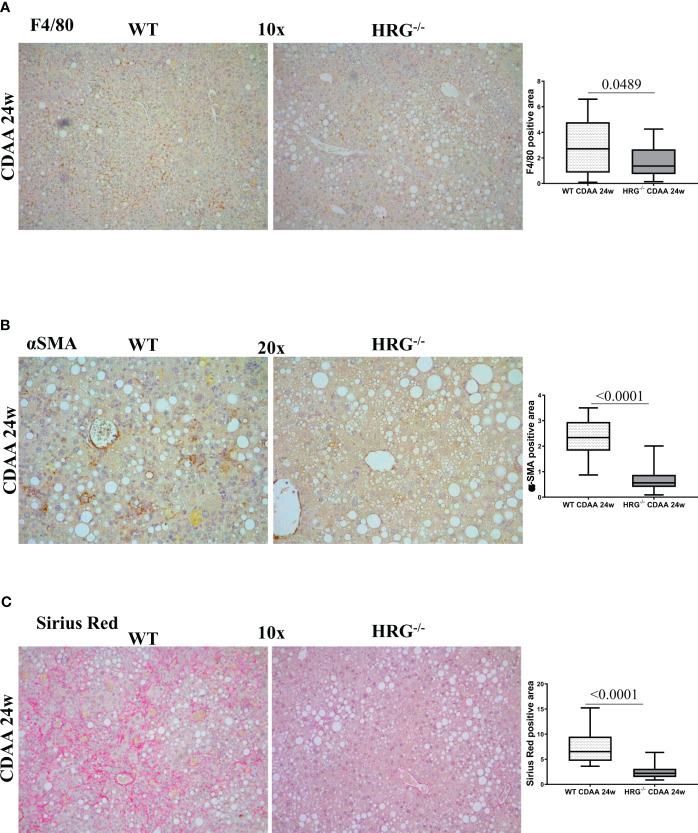
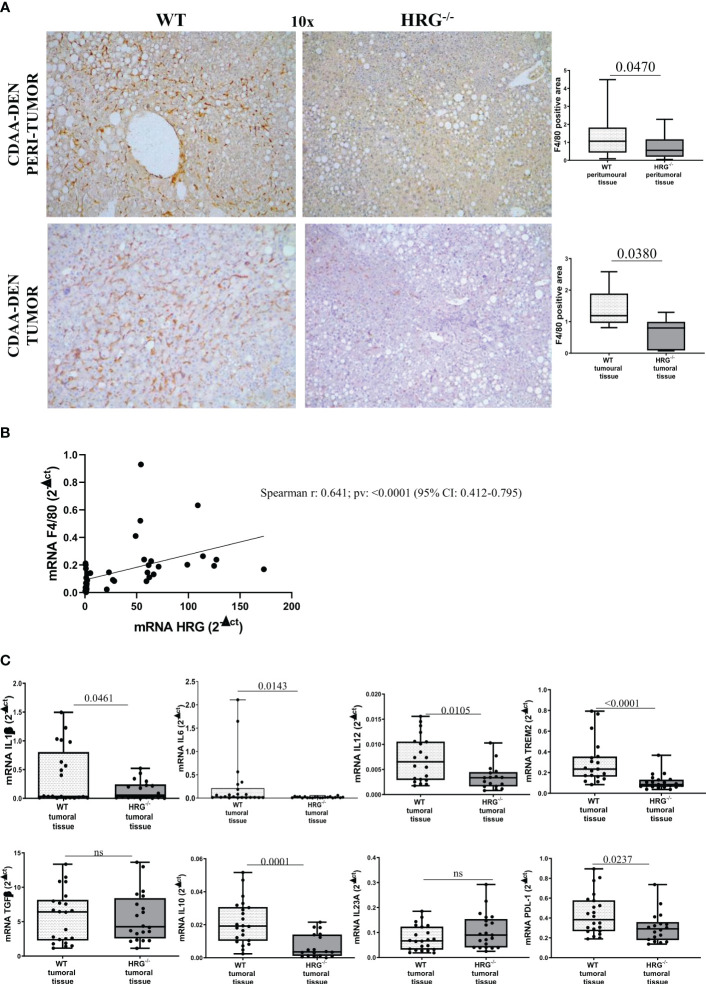
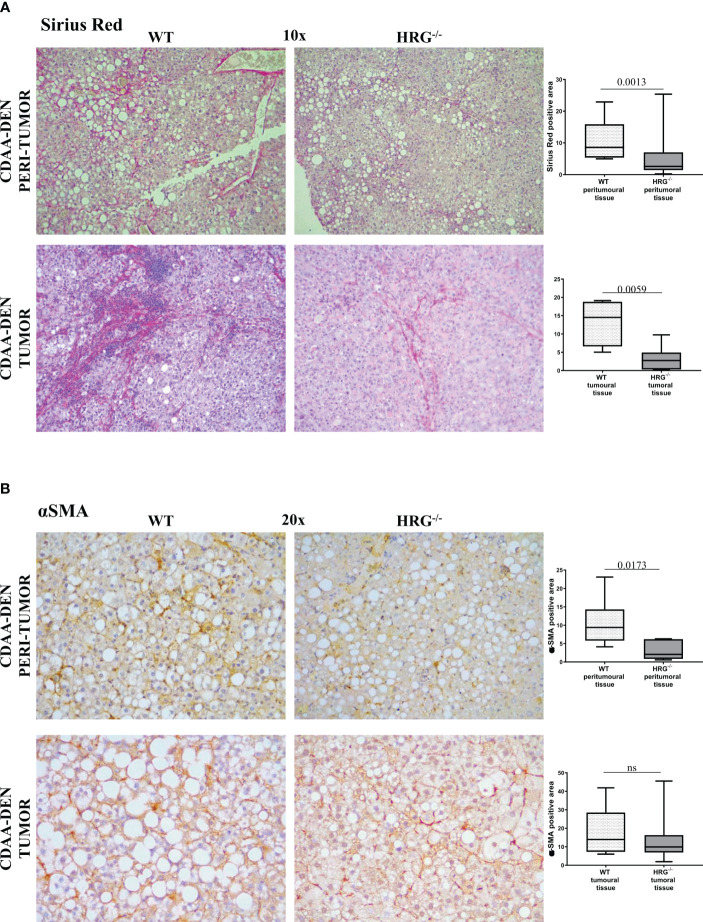
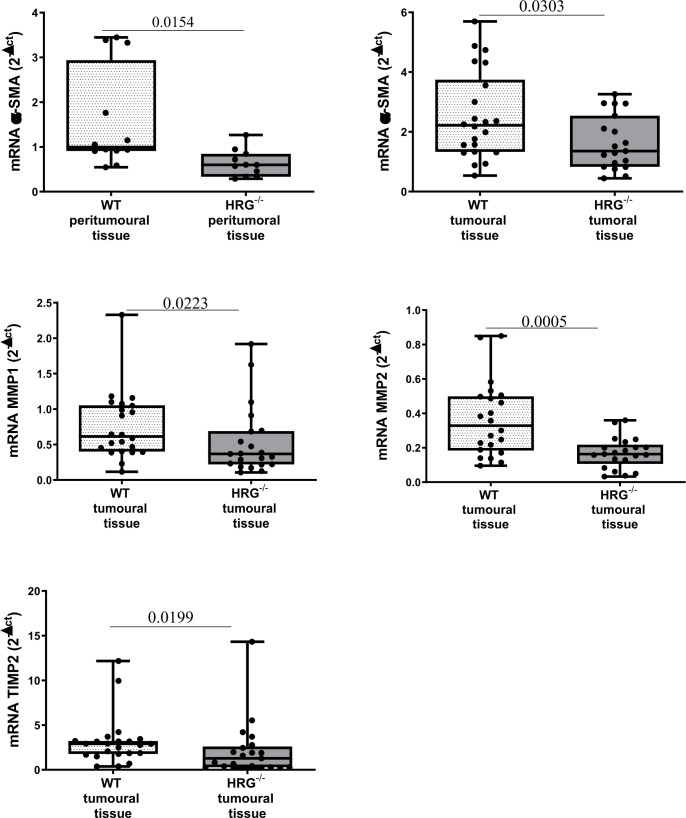
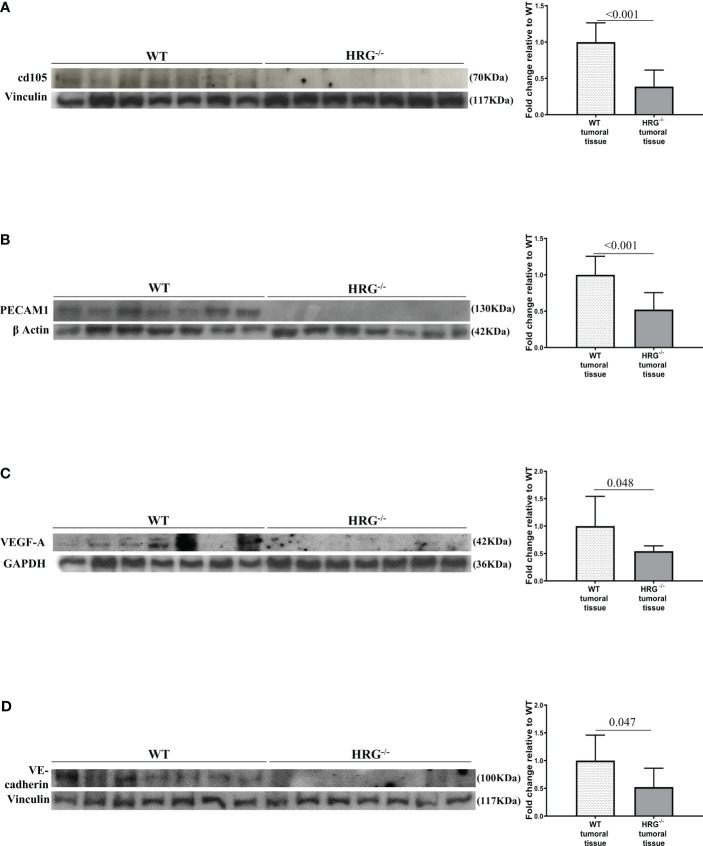
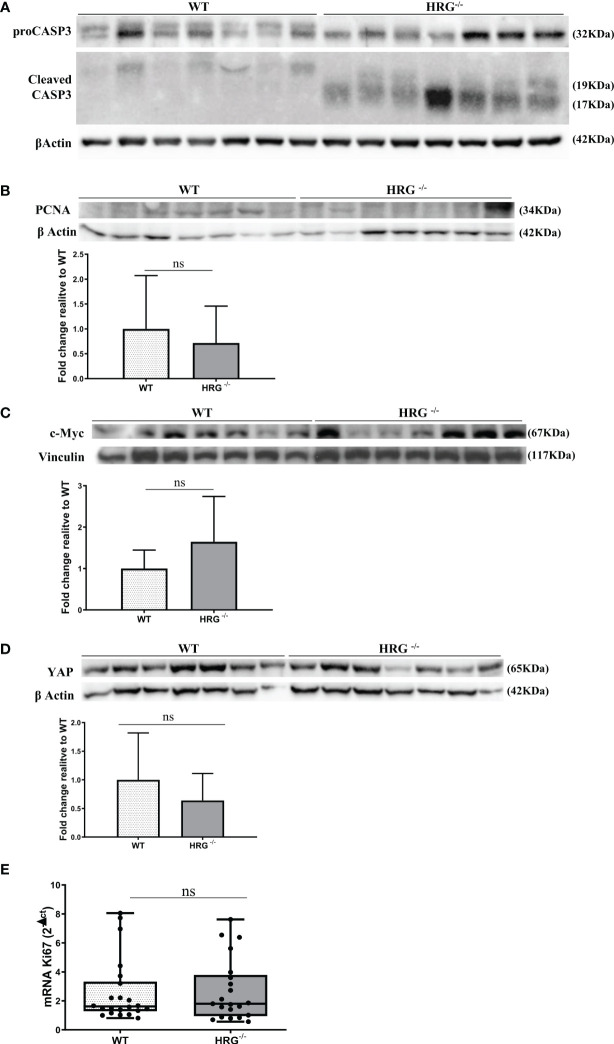
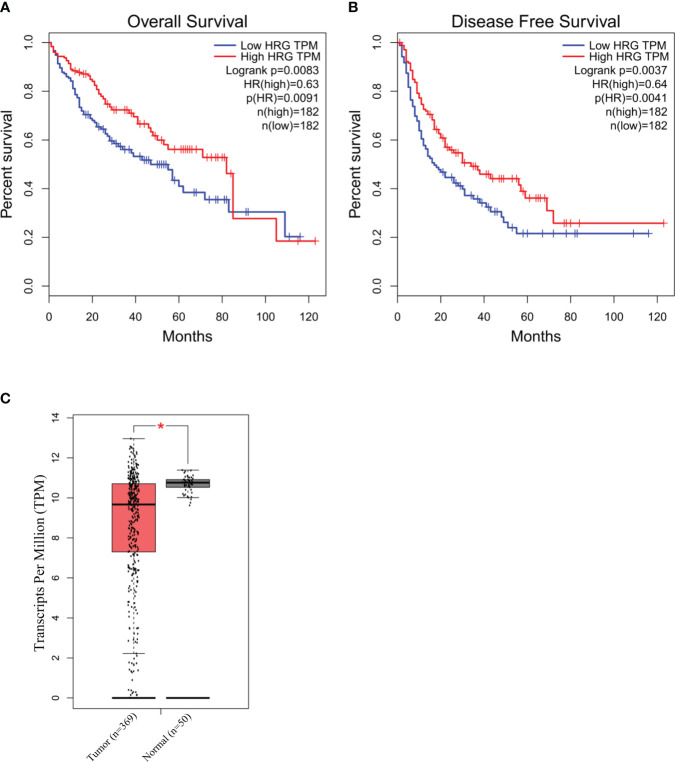
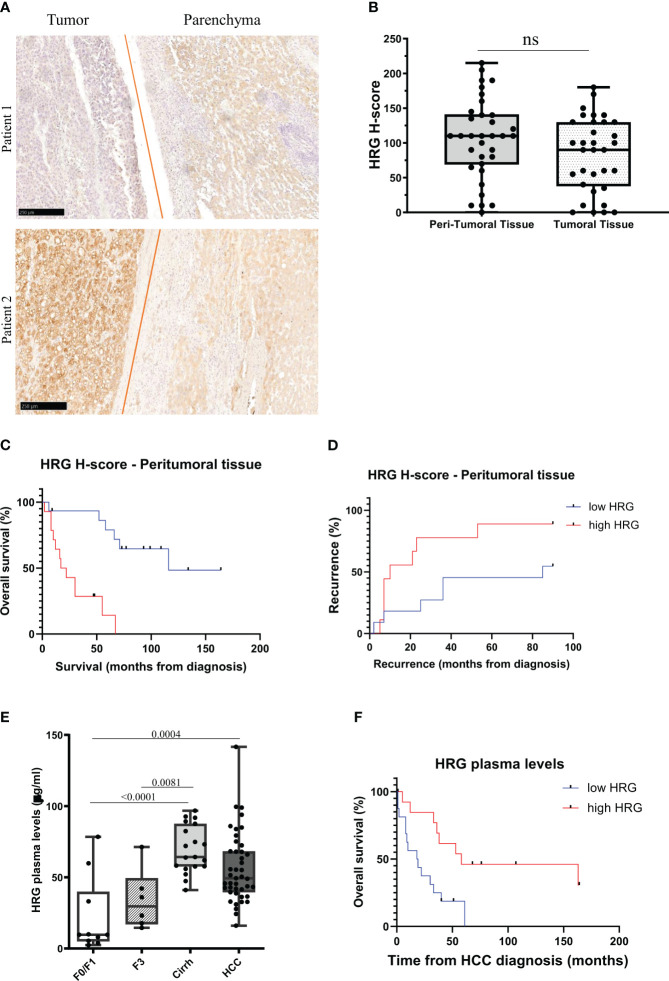
Results: In non-neoplastic settings, murine and clinical data indicate that HRG increases significantly in parallel with disease progression. In particular, in MASLD/MASH patients, higher levels of HRG plasma levels were detected in subjects with extensive fibrosis/cirrhosis. When submitted to the pro-carcinogenic protocol, HRG-/- mice showed a significant decrease in the volume and number of HCC nodules in relation to decreased infiltration of macrophages producing pro-inflammatory mediators, including IL-1β, IL-6, IL-12, IL-10, and VEGF as well as impaired angiogenesis. The histopathological analysis (H-score) of MASH-related HCC indicate that the higher HRG positivity in peritumoral tissue significantly correlates with a lower overall patient survival and an increased recurrence. Moreover, a significant increase in HRG plasma levels was detected in cirrhotic (F4) patients and in patients carrying HCC vs. F0/F1 patients.

Conclusion: Murine and clinical data indicate that HRG plays a significant role in MASLD/MASH progression to HCC by supporting a specific population of tumor-associated macrophages with pro-inflammatory response and pro-angiogenetic capabilities which critically support cancer cell survival. Furthermore, our data suggest HRG as a possible prognostic predictor in HCC patients with MASLD/MASH-related HCCs.

Keywords: HCC; MASH; chronic liver diseases; fibrogenesis; hepatocellular carcinoma; histidine-rich glycoprotein; inflammation; liver carcinogenesis.


Conflict of interest statement

The authors declare that the research was conducted in the absence of any commercial or financial relationships that could be construed as a potential conflict of interest.

Figures

Figure 1
Figure 1
Experimental MASLD/MASH-related HCC: the DEN-CDAA murine model. Graphic representation of the rodent model of MASLD-associated hepatocarcinogenesis based on a single injection of diethyl-nitrosamine (DEN) at 2 weeks of age and the subsequent induction of steatohepatitis by the administration of a CDAA diet for 25 weeks (A). Hematoxylin–eosin staining performed on paraffin-embedded HCC tumor masses from wild-type mice (WT) (n = 12) or from HRG knock-out mice (HRG–/–) (n = 11). IHC analysis for HRG performed on paraffin-embedded HCC tumor masses and peri-tumoral tissue from 12 wild-type mice (WT). The bold arrows indicate nuclear pleomorphism. Original magnification as indicated (B, C). HRG expression analyzed by q-PCR in WT mice subjected to CDAA diet for 24 weeks or DEN-CDAA protocol (D). The mRNA values are expressed as fold increase over control values after normalization to the TBP gene expression (D). ns, not significant.
Figure 2
Figure 2
HRG deletion significantly affects the development of experimental liver tumors. Reduction of number and of neoplastic mass measured in HCC tumors from 12 wild-type mice (WT) or 11 from HRG knock-out mice (HRG–/–) (A–C). The results are expressed as means ± SD. The boxes include the values within the 25th and 75th percentile, whereas the horizontal bars represent the medians. The extremities of the vertical bars (10th–90th percentile) comprise 80% of the values. Statistical differences were assessed by Student’s t-test (B, C). Parenchymal injury estimated by measuring the circulating levels of alanine (ALT) is reported in WT and HRG-/- mice (D). Liver/body weight ratio measured in WT and HRG-/- mice (E). The results are expressed as means ± SD. The boxes include the values within the 25th and 75th percentile, whereas the horizontal bars represent the medians. The extremities of the vertical bars (10th–90th percentile) comprise 80% of the values. Statistical differences were assessed by Student’s t-test or Mann–Whitney test for non-parametric values (D, E). ns, not significant.
Figure 3
Figure 3
HRG deletion affects the development of experimental MASH by downregulating inflammatory response and fibrogenesis. IHC analysis for F4/80 (A), αSMA (B) and Sirius Red staining (C) performed on paraffin-embedded liver samples from six wild-type mice (WT) or from nine HRG knock-out mice (HRG–/–) fed with CDAA diet for 24 weeks. ImageJ software analysis was performed to evaluate the amount of positivity. The data are means ± SD of 6/9 animals per group. The boxes include the values within the 25th and 75th percentile, whereas the horizontal bars represent the medians. The extremities of the vertical bars (10th–90th percentile) comprise 80% of the values. Statistical differences were assessed by unpaired parametric t-test or Mann–Whitney non-parametric t-test. Original magnification as indicated (A–C).
Figure 4
Figure 4
HRG deletion significantly affects inflammatory response. IHC analysis of F4/80 performed on paraffin-embedded HCC tumor masses and peri-tumoral tissue (A) from 12 wild-type mice (WT) or from 11 HRG knock-out mice (HRG–/–). ImageJ software analysis was performed to evaluate the amount of positivity. The data are means ± SD of 11/12 animals per group. The boxes include the values within the 25th and 75th percentile, whereas the horizontal bars represent the medians. The extremities of the vertical bars (10th–90th percentile) comprise 80% of the values. Statistical differences were assessed by unpaired parametric t-test or Mann–Whitney non-parametric t-test. Original magnification as indicated (A). Relationship between HRG and F4/80 mRNA in HCCs from WT mice. The values represent the relative mRNA content. The correlation analysis was performed with Pearson r test (B). qPCR analysis of IL1β, IL6, IL12, TREM2, TGFβ, IL10, IL23A, and PDL-1 (C) transcripts performed in HCCs from 12 WT mice or from 11 HRG–/– mice. The mRNA values are expressed as fold increase over control values after normalization to the TBP gene expression. The results are expressed as means ± SD. The boxes include the values within the 25th and 75th percentile, whereas the horizontal bars represent the medians. The extremities of the vertical bars (10th–90th percentile) comprise 80% of the values. Statistical differences were assessed by Student’s t-test or Mann–Whitney test for non-parametric values (C). ns, not significant.
Figure 5
Figure 5
HRG deletion affects the development of experimental MASH-HCC by downregulating inflammatory response and fibrogenesis. Sirius Red staining (A) and IHC analysis for αSMA (B) performed on paraffin-embedded HCC tumor masses and peri-tumoral tissue from 12 wild-type mice (WT) or from 11 HRG knock-out mice (HRG–/–). ImageJ software analysis was performed to evaluate the amount of positivity. The data are means ± SD of 11/12 animals per group. The boxes include the values within the 25th and 75th percentile, whereas the horizontal bars represent the medians. The extremities of the vertical bars (10th–90th percentile) comprise 80% of the values. Statistical differences were assessed by unpaired parametric t-test or Mann–Whitney non-parametric t-test. Original magnification as indicated (A, B). ns, not significant.
Figure 6
Figure 6
HRG deletion affects the development of experimental MASH-HCC by downregulating fibrogenesis. qPCR analysis of αSMA, MMP1, MMP2, and TIMP2 transcripts performed in HCC tumor masses or peri-tumoral tissue from 12 WT mice or from 11 HRG–/– mice. The mRNA values are expressed as fold increase over control values after normalization to the TBP gene expression. The results are expressed as means ± SD. The boxes include the values within the 25th and 75th percentile, whereas the horizontal bars represent the medians. The extremities of the vertical bars (10th–90th percentile) comprise 80% of the values. Statistical differences were assessed by Student’s t-test or Mann–Whitney test for non-parametric values.
Figure 7
Figure 7
HRG deletion impact on HCC angiogenesis. WB analysis for cd105 (A), PECAM1 (B), VEGF-A (C), and VE-cadherin (D) performed in HCCs from wild-type mice (WT) or from HRG knock-out mice (HRG–/–). BIORAD Quantity One software was used to perform the densitometric analysis (data are expressed as fold change relative to the normalized WT expression). Equal loading was evaluated by re-probing membranes for vinculin (A, D), β-actin (B), and GAPDH (C). Statistical differences were assessed by Student’s t-test or Mann–Whitney test for non-parametric values.
Figure 8
Figure 8
HRG deletion affects apoptosis but not proliferation. WB analysis for proCASP3 and cleaved CASP3 (A), PCNA (B), c-MYC (C), and YAP (D) performed in HCCs from wild-type mice (WT) or from HRG knock-out mice (HRG–/–). BIORAD Quantity One software was used to perform the densitometric analysis (data are expressed as fold change relative to the normalized WT expression). Equal loading was evaluated by re-probing membranes for β-actin (A, B, D) or vinculin (C). Statistical differences were assessed by Student’s t-test or Mann–Whitney test for non-parametric values (A–D). qPCR analysis of Ki67 transcripts performed in HCC tumor masses from 12 WT mice or from 11 HRG–/– mice (E). The mRNA values are expressed as fold increase over control values after normalization to the TBP gene expression. The results are expressed as means ± SD. The boxes include the values within the 25th and 75th percentile, whereas the horizontal bars represent the medians. The extremities of the vertical bars (10th–90th percentile) comprise 80% of the values. Statistical differences were assessed by Student’s t-test or Mann–Whitney test for non-parametric values (E). ns, not significant.
Figure 9
Figure 9
HRG in human HCC of mixed etiology. Survival and disease-free survival (log rank Mantel–Cox test) in high- vs. low-HRG-expressing HCC patients in the TCGA-LIHC cohort accessed using GEPIA webserver (A, B). GEPIA analysis of HRG gene expression in the non-tumoral (n = 50) areas and in the tumor samples (n = 369) from the TCGA-LIHC cohort. *p-value <0.0001 (C).
Figure 10
Figure 10
HRG protein expression in MASLD/MASH-related HCC patients. IHC analysis of HRG performed on paraffin-embedded human liver specimens from MASLD/MASH-related HCC patients (n = 37, grades G2 to G3). Original magnification as indicated (A). HRG expression was semi-quantitatively scored blinded by a pathologist by means of histological score (H-score) (B). Kaplan–Meier curves of overall survival (C) and recurrence (D) according to HRG peritumoral H-score in MASLD/MASH-related HCC patients (C, D). Statistical analysis was performed using log-rank (Mantel–Cox) test (C, D). Plasma concentration of HRG measured in a cohort of patients (N = 78) with different stages of disease progression including 10 patients with a F0/F1 score, 25 patients with a F3/F4 score (six F3 and 19 F4) and 43 MASLD/MASH patients carrying HCC. Cirrh, cirrhotic liver; F, fibrosis score (E). Kaplan–Meier curves of overall survival according to HRG plasma levels in MASLD/MASH-related HCC patients (F). Statistical analysis was performed using log-rank (Mantel–Cox) test (F). ns, not significant.

Similar articles

Cited by

References

    1. Rinella ME, Lazarus JV, Ratziu V, Francque SM, Sanyal AJ, Kanwal F, et al. . NAFLD Nomenclature consensus group, 2023. A multi-society Delphi consensus statement on new fatty liver disease nomenclature. J Hepatol. (2023) 79:1542–56. doi: 10.1016/j.jhep.2023.06.003 - DOI - PubMed
    1. Loomba R, Sanyal AJ. The global NAFLD epidemic. Nat Rev Gastroenterol Hepatol. (2013) 10:686–90. doi: 10.1038/nrgastro.2013.171 - DOI - PubMed
    1. Younossi ZM, Koenig AB, Abdelatif D, Fazel Y, Henry L, Wymer M. Global epidemiology of nonalcoholic fatty liver disease-Meta-analytic assessment of prevalence, incidence, and outcomes. Hepatology. (2016) 64:73–84. doi: 10.1002/hep.28431 - DOI - PubMed
    1. Younossi Z, Anstee QM, Marietti M, Hardy T, Henry L, Eslam M, et al. . Global burden of NAFLD and NASH: trends, predictions, risk factors and prevention. Nat Rev Gastroenterol Hepatol. (2018) 15:11–20. doi: 10.1038/nrgastro.2017.109 - DOI - PubMed
    1. Younossi Z, Tacke F, Arrese M, Chander Sharma B, Mostafa I, Bugianesi E, et al. . Global perspectives on nonalcoholic fatty liver disease and nonalcoholic steatohepatitis. Hepatology. (2019) 69:2672–82. doi: 10.1002/hep.30251 - DOI - PubMed

Publication types