. 2024 Feb 26:15:1360716.
doi: 10.3389/fimmu.2024.1360716. eCollection 2024.

Abnormal functional lymphoid tolerance and enhanced myeloid exocytosis are characteristics of resting and stimulated PBMCs in cystic fibrosis patients

Affiliations

Abnormal functional lymphoid tolerance and enhanced myeloid exocytosis are characteristics of resting and stimulated PBMCs in cystic fibrosis patients

Clémence Gaudin et al. Front Immunol. .

Abstract

Introduction: Cystic Fibrosis (CF) is the commonest genetically inherited disease (1 in 4,500 newborns) and 70% of people with CF (pwCF) harbour the F508Del mutation, resulting in misfolding and incorrect addressing of the channel CFTR to the epithelial membrane and subsequent dysregulation of fluid homeostasis. Although studies have underscored the importance and over-activation of myeloid cells, and in particular neutrophils in the lungs of people with CF (pwCF), relatively less emphasis has been put on the potential immunological bias in CF blood cells, at homeostasis or following stimulation/infection.

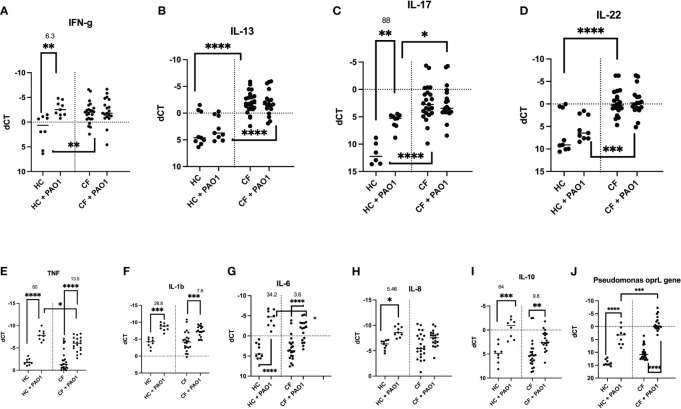
Methods: Here, we revisited, in an exhaustive fashion, in pwCF with mild disease (median age of 15, median % FEV1 predicted = 87), whether their PBMCs, unprimed or primed with a 'non specific' stimulus (PMA+ionomycin mix) and a 'specific' one (live P.a =PAO1 strain), were differentially activated, compared to healthy controls (HC) PBMCs.

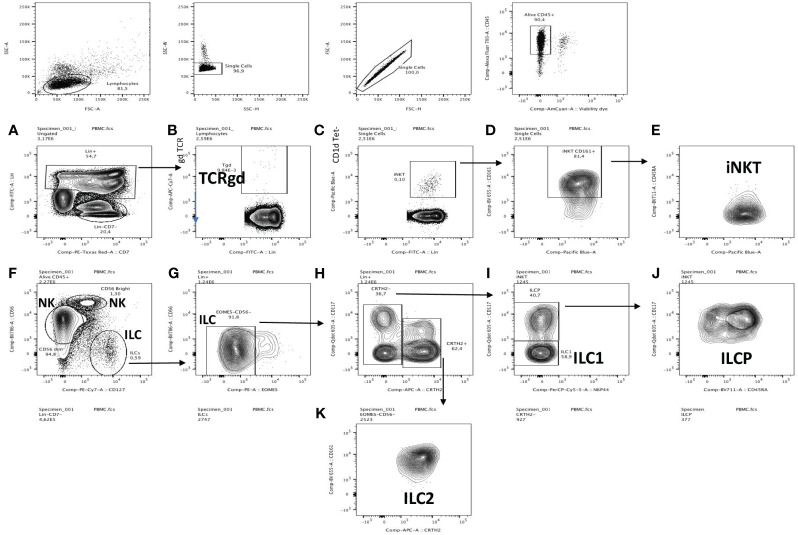
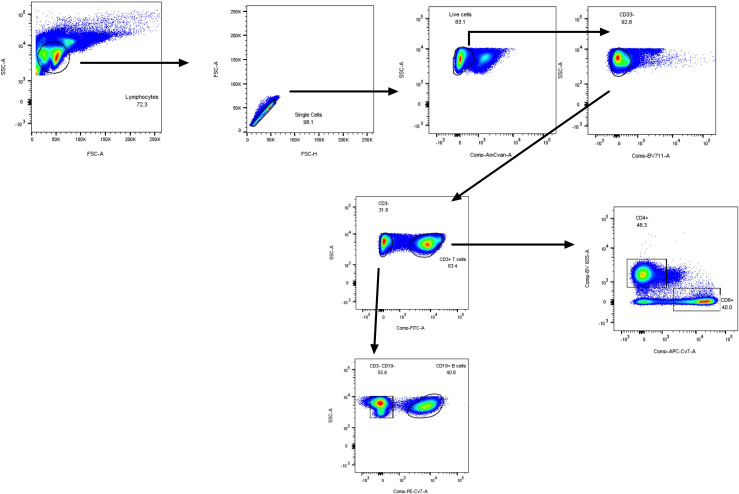
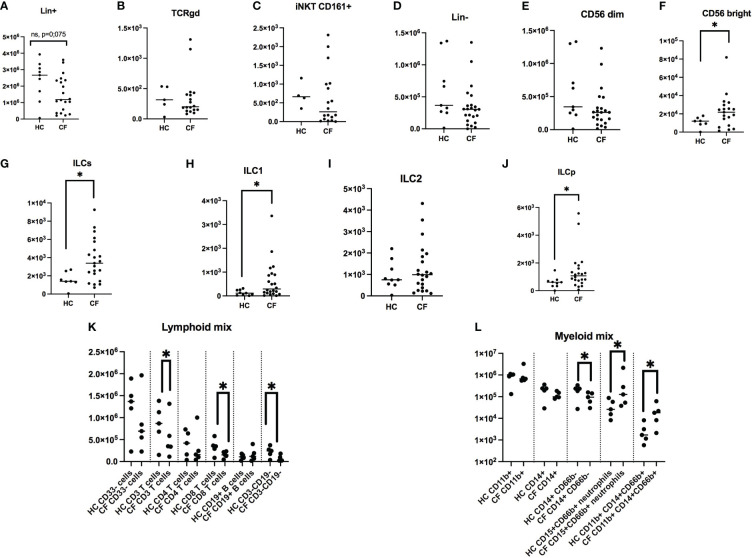
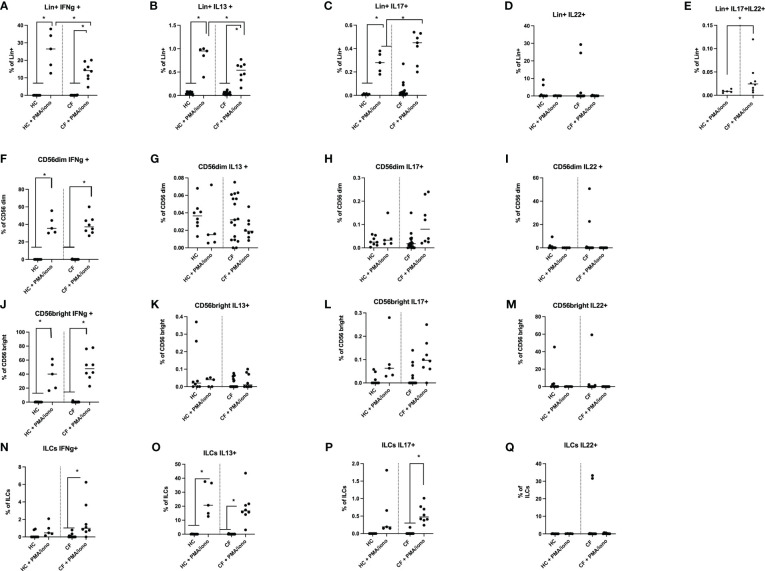
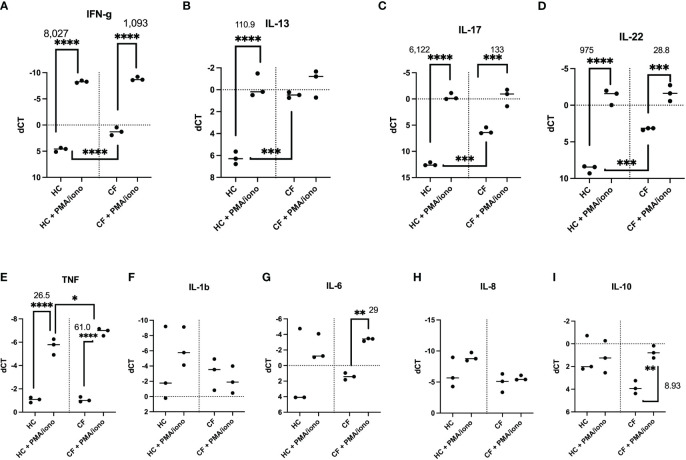
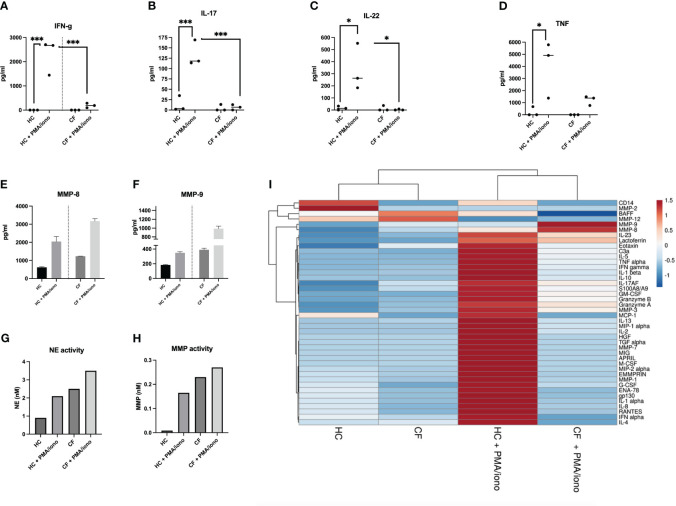
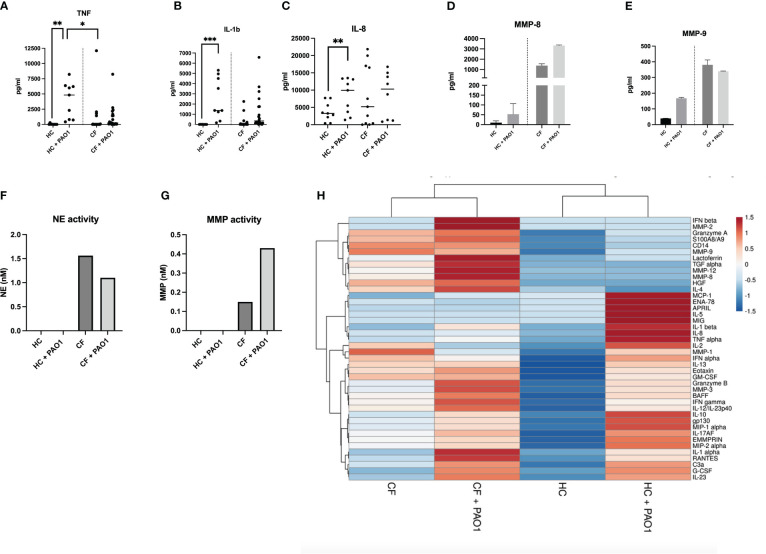
Results: 1) we analysed the lymphocytic and myeloid populations present in CF and Control PBMCs (T cells, NKT, Tgd, ILCs) and their production of the signature cytokines IFN-g, IL-13, IL-17, IL-22. 2) By q-PCR, ELISA and Luminex analysis we showed that CF PBMCs have increased background cytokines and mediators production and a partial functional tolerance phenotype, when restimulated. 3) we showed that CF PBMCs low-density neutrophils release higher levels of granule components (S100A8/A9, lactoferrin, MMP-3, MMP-7, MMP-8, MMP-9, NE), demonstrating enhanced exocytosis of potentially harmful mediators.

Discussion: In conclusion, we demonstrated that functional lymphoid tolerance and enhanced myeloid protease activity are key features of cystic fibrosis PBMCs.

Keywords: PBMCs; Pseudomonas aeruginosa; cystic fibrosis; low-density neutrophils; lymphocyte; proteases; tolerance.


Conflict of interest statement

Author IS-G reports support for the present manuscript from Vaincre la Mucoviscidose and Mucoviscidose ABCF2. Author IS-G also reports, outside the submitted work, grants from Agence Nationale pour la Recherche, Assistance Publique– Hôpitaux de Paris and Vertex Innovation Award, and consulting fees and travel support from Vertex therapeutics. The remaining authors declare that the research was conducted in the absence of any commercial or financial relationships that could be construed as a potential conflict of interest. The author(s) declared that they were an editorial board member of Frontiers, at the time of submission. This had no impact on the peer review process and the final decision.

Figures

Figure 1
Figure 1
PBMC FACS gating strategy for the detection of total lymphocytes and monocytes (Lin +), TCRgd, NKT cells, NK dim, NK bright, ILC and ILCP cells. Singlets from a FSC/SSC lymphocytic gate were first selected, then gated for CD45+/viability, followed by cellular characterization using specific markers for lymphocytes and monocytes (Lin +, A), TCRgd (B), NKT cells (C–E), NK dim, NK bright (F), ILC (G–I, K) and ILCP cells (J). See Material and Methods for the detailed procedure.
Figure 2
Figure 2
PBMC FACS gating strategy (lymphoid mix used in Figure 3L ) for the specific detection of total T CD3+ lymphocytes, CD4+, CD8+ lymphocytes, and CD19+ B cells.
Figure 3
Figure 3
FACS analysis of PBMCs markers in healthy controls (HC) and people with CF. HC (n= 9) and CF (n= 22) PBMCs were analysed by FACS (see Materials and Methods). Numbers of Lin + cells (CD14+, CD3+, CD19+, all FITC-labelled) are shown in (A). Within this population, the numbers of γδ T cells and NKT cells are depicted in (B, C). Within Lin- cells (D), the numbers of NK CD56 dim and CD56 bright are shown in (E, F), respectively. Total ILCs and their sub-populations are shown in (G–J). With independent antibody mixes, the of CD3+, CD4+, CD8+, CD19+ lymphocytes numbers are illustrated in (K), whereas monocytes and neutrophils were analysed as shown in (L) (see Supplementary Figure S1 for the gating strategy). Statistical analysis was performed with either t-tests, followed by non-parametric Mann-Whitney tests when two groups were compared, or by Kruskal Wallis tests, followed by post-hoc Dunn’s multi-comparison tests when several groups were studied. *: P<0.05; **: P<0.01; ***: P<0.001; ****: P<0.0001.
Figure 4
Figure 4
FACS analysis of HC and CF key ‘lymphocytic’ cytokines (IFN-g, IL-13, IL-17, IL-22) following PMA/ionomycin stimulation of PBMCs. HC (n=3-8) and CF (n=15-19) PBMCs were stimulated with a PMA/iono mix during 4hrs (see Materials and Methods) and analysed by FACS (see Supplementary Figure S2 for the gating strategy). The intra-cellular production of IFN-γ, IL-13, IL-17 and IL-22 was assessed in Lin+ cells (A–E), CD56 dim cells (F–I), CD56 bright cells (J–M) and in total ILCs (N–Q). Statistical analysis was performed with Kruskal Wallis tests, followed by post-hoc Dunn’s multi comparison tests. *: P<0.05; **: P<0.01; ***: P<0.001; ****: P<0.0001.
Figure 5
Figure 5
Transcriptional analysis of HC and CF PBMCs key cytokines post PMA/ionomycin stimulation. HC (n= 3) and CF (n= 3) PBMCs were either non-treated or stimulated with a PMA/iono mix during 4hrs, as in Figure 4 . After cell lysis and RNA preparation (see Materials and Methods), IFN-γ, IL-13, IL-17, IL-22 (A–D), TNF, IL-1b, IL-6, IL-8, IL-10 (E–I) RNA expression was measured by q-PCR. Gene expression is expressed as: dCT = CT gene of interest – CT house keeping gene. Because dCT values are inversely correlated with gene expression levels, the Y axis of the PRISM panels are reversed, for a more intuitive visualisation of RNA expression (i.e higher expression: ‘up’, lower expression: ‘down’). Statistical analysis was performed using either t-tests (when comparing +/- PMA/iono groups), or Kruskal Wallis tests, followed by post-hoc Dunn’s multi comparison tests, when all groups were compared, regardless of the treatment. *: P<0.05; **: P<0.01; ***: P<0.001; ****: P<0.0001. Numbers over the *symbols depict fold increase over HC- or CF- unstimulated cells.
Figure 6
Figure 6
Protein analysis of HC and CF PBMCs post PMA/iono stimulation (A–D) HC (n=3) and CF (n= 3) PBMCs were stimulated with PMA/iono as in Figure 4 . Cytokine levels for IFN-g, IL-17, IL-22, TNF were measured by ELISA in cell supernatants. Statistical analysis was performed using either t-tests (when comparing +/- PMA/iono groups), or Kruskal Wallis tests, followed by post-hoc Dunn’s multi comparison tests, when all groups were compared, regardless of the treatment. *: P<0.05; **: P<0.01; ***: P<0.001; ****: P<0.0001. Numbers over the *symbols depict fold increase over HC- or CF- unstimulated cells (E, F) HC (n=3) and CF (n= 3) PBMCs were stimulated as above. All supernatants from each category (either HC or CF) were harvested, pooled together and analysed by Luminex for MMP-8 and MMP-9 levels. (G, H) The same supernatants (as in E, F) were assessed for neutrophil elastase (NE) and metalloprotease (MMP) enzymatic activity, as described in M@M. (I): The same supernatants (as in E, F) were analysed for a wide array of analytes (see Supplementary Figures S6 - S8 ). A Cluster heatmap was then performed as described in M&M. Rows are centered, unit variance scaling being applied to rows. Both rows and columns are clustered using correlation distance and average linkage.
Figure 7
Figure 7
Transcriptional analysis of HC and CF PBMCs key cytokines, post live PAO1 infection. HC (n= 9) and CF (n= 22) PBMCs were either non-treated or infected with live P.a PAO1 strain (multiplicity of infection/MOI =1) during 4hrs. After cell lysis and RNA preparation (see Materials and Methods), IFN-γ, IL-13, IL-17, IL-22, TNF, IL-1b, IL-6, IL-8, IL-10 RNA expression was measured by q-PCR. (A–I) The levels of expression of the P.a gene opRL was used (J) as a read-out of PAO1 survival in PBMCs, as validated previously (27). Gene expression is represented as: dCT = CT gene of interest – CT house keeping gene (HPRT). Because dCT values are inversely correlated with gene expression levels, the Y axis of the PRISM panels are reversed, for a more intuitive visualisation of RNA expression (i.e higher expression: ‘up’, lower expression: ‘down’). Statistical analysis was performed as described in Figure 5 legend. *: P<0.05; **: P<0.01; ***: P<0.001; ****: P<0.0001. Numbers over the *symbols depict fold increase over HC- or CF- unstimulated cells.
Figure 8
Figure 8
Protein analysis of HC and CF PBMCs post live PAO1 infection. (A–C) HC (n=3) and CF (n= 3) PBMCs were infected with live P.a PAO1 strain as in Figure 7 . Cytokine levels for TNF, IL-1b, IL-8 were measured by ELISA in cell supernatants. Statistical analysis was performed as described in Figure 5 legend. (D–E) HC (n=9) and CF (n= 22 PBMCs) were infected as above. All supernatants from each category (either HC or CF) were harvested, pooled together and analysed by Luminex for MMP-8 and MMP-9 levels. (F, G) The same supernatants (as in D-E) were assessed for neutrophil elastase (NE) and metalloprotease (MMP) enzymatic activity, as described in M@M. (H) The same supernatants (as in D, E) were analysed for a wide array of analytes (see Supplementary Figures S9 - S11 ). A Cluster heatmap was then performed as described in M&M. Rows are centered, unit variance scaling being applied to rows. Both rows and columns are clustered using correlation distance and average linkage.

Similar articles

Cited by

References

    1. Riordan JR, Rommens M, Kerem B, Alon N, Rozmahel R, Grzelczak Z, et al. . Identification of the cystic fibrosis gene: cloning and characterization of complementary DNA. Science (1989) 245:1066–73. doi: 10.1126/science.2475911 - DOI - PubMed
    1. Rosenstein BJ, Zeitlin PL. Cystic fibrosis. Lancet (1998) 351:277–82. doi: 10.1016/S0140-6736(97)09174-5 - DOI - PubMed
    1. Cheng SH, Gregory RJ, Marshall J, Paul S, Souza DW, White GA, et al. . Defective intracellular transport and processing of CFTR is the molecular basis of most cystic fibrosis. Cell (1990) 63:827–34. doi: 10.1016/0092-8674(90)90148-8 - DOI - PubMed
    1. Gadsby DC, Vergani P, Csanády L. The ABC protein turned chloride channel whose failure causes cystic fibrosis. Nature (2006) 440:477–83. doi: 10.1038/nature04712 - DOI - PMC - PubMed
    1. Rosen BH, Moll SR, Gray JS, Liang B, Sun X, Zhang Y, et al. . Infection is not required for mucoinflammatory lung disease in CFTR-knockout ferrets. Am J Respir Crit Care Med (2018) 197:1308–18. doi: 10.1164/rccm.201708-1616OC - DOI - PMC - PubMed

Publication types

Substances