

Gene-edited Mtsoc1 triple mutant Medicago plants do not flower
- PMID: 38469328
- PMCID: PMC10926907
- DOI: 10.3389/fpls.2024.1357924
Gene-edited Mtsoc1 triple mutant Medicago plants do not flower
Abstract
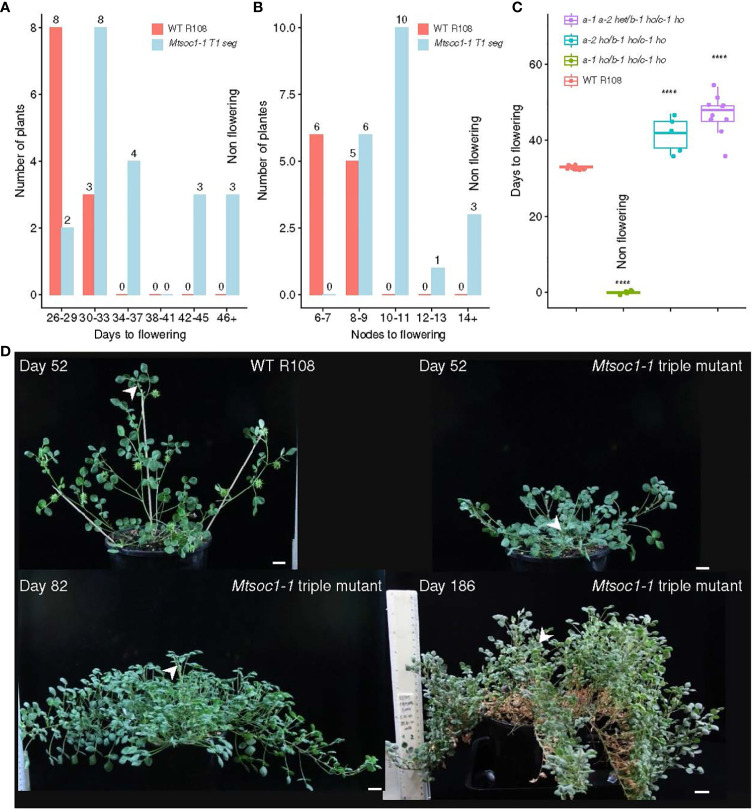
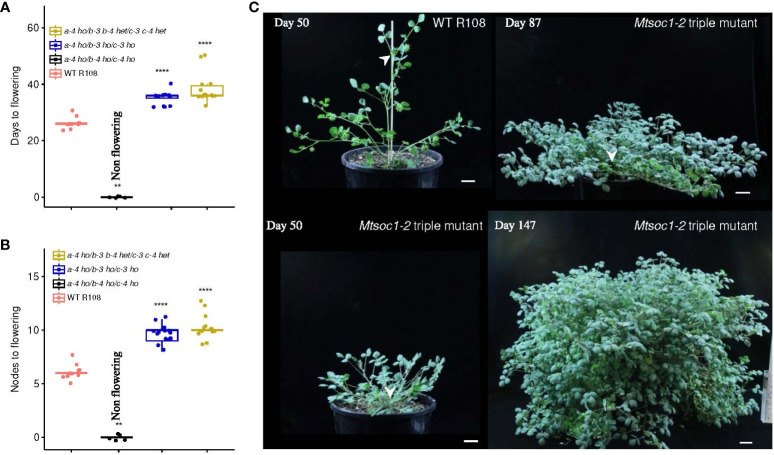
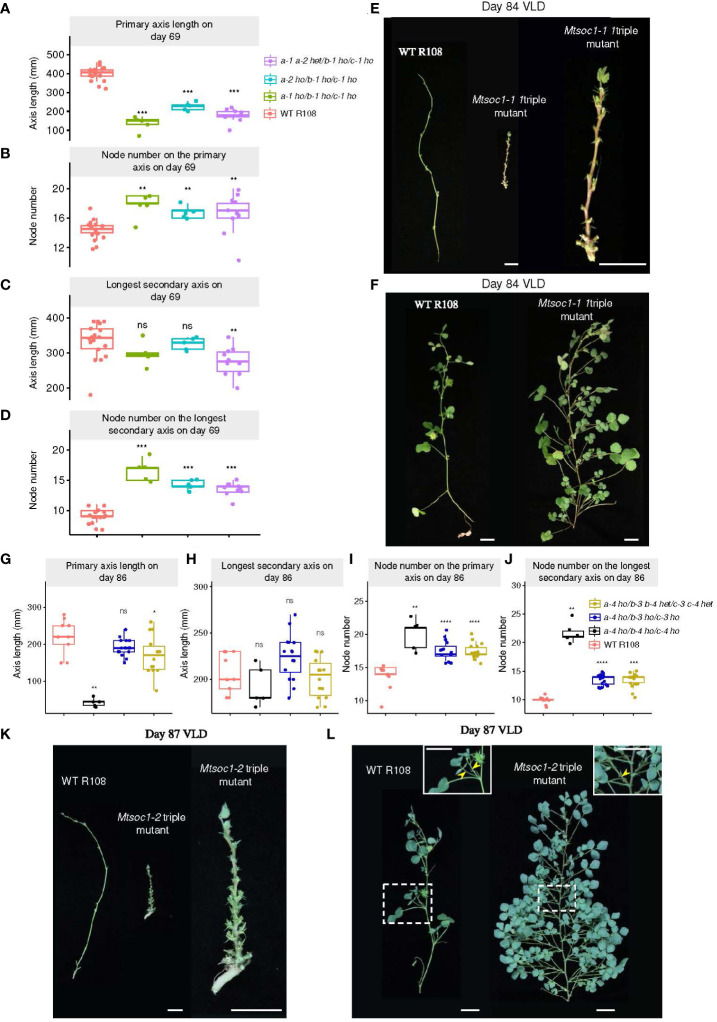
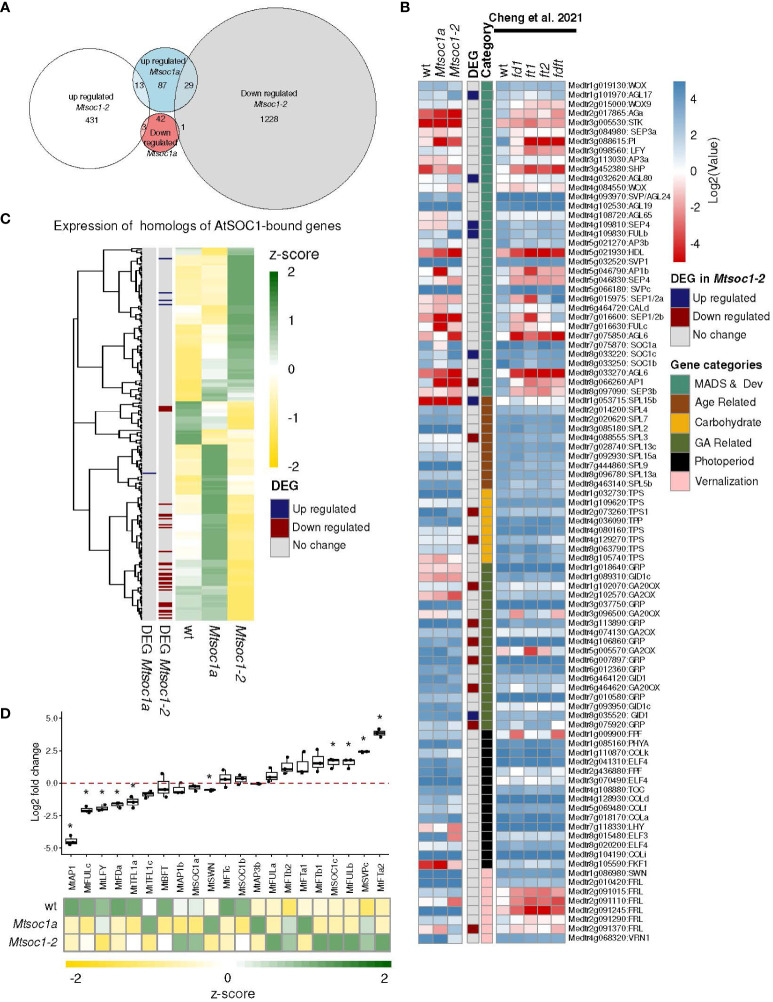
Optimized flowering time is an important trait that ensures successful plant adaptation and crop productivity. SOC1-like genes encode MADS transcription factors, which are known to play important roles in flowering control in many plants. This includes the best-characterized eudicot model Arabidopsis thaliana (Arabidopsis), where SOC1 promotes flowering and functions as a floral integrator gene integrating signals from different flowering-time regulatory pathways. Medicago truncatula (Medicago) is a temperate reference legume with strong genomic and genetic resources used to study flowering pathways in legumes. Interestingly, despite responding to similar floral-inductive cues of extended cold (vernalization) followed by warm long days (VLD), such as in winter annual Arabidopsis, Medicago lacks FLC and CO which are key regulators of flowering in Arabidopsis. Unlike Arabidopsis with one SOC1 gene, multiple gene duplication events have given rise to three MtSOC1 paralogs within the Medicago genus in legumes: one Fabaceae group A SOC1 gene, MtSOC1a, and two tandemly repeated Fabaceae group B SOC1 genes, MtSOC1b and MtSOC1c. Previously, we showed that MtSOC1a has unique functions in floral promotion in Medicago. The Mtsoc1a Tnt1 retroelement insertion single mutant showed moderately delayed flowering in long- and short-day photoperiods, with and without prior vernalization, compared to the wild-type. In contrast, Mtsoc1b Tnt1 single mutants did not have altered flowering time or flower development, indicating that it was redundant in an otherwise wild-type background. Here, we describe the generation of Mtsoc1a Mtsoc1b Mtsoc1c triple mutant lines using CRISPR-Cas9 gene editing. We studied two independent triple mutant lines that segregated plants that did not flower and were bushy under floral inductive VLD. Genotyping indicated that these non-flowering plants were homozygous for the predicted strong mutant alleles of the three MtSOC1 genes. Gene expression analyses using RNA-seq and RT-qPCR indicated that these plants remained vegetative. Overall, the non-flowering triple mutants were dramatically different from the single Mtsoc1a mutant and the Arabidopsis soc1 mutant; implicating multiple MtSOC1 genes in critical overlapping roles in the transition to flowering in Medicago.
Keywords: CRISPR-Cas9; Medicago; MtSOC1a; MtSOC1b; MtSOC1c; flowering time; gene editing; legume.
Copyright © 2024 Poulet, Zhao, Peng, Tham, Jaudal, Zhang, van Wolfswinkel and Putterill.
Conflict of interest statement
The remaining authors declare that the research was conducted in the absence of any commercial or financial relationships that could be construed as a potential conflict of interest.
Figures
Similar articles
-
Medicago truncatula SOC1 Genes Are Up-regulated by Environmental Cues That Promote Flowering.Front Plant Sci. 2018 Apr 27;9:496. doi: 10.3389/fpls.2018.00496. eCollection 2018. Front Plant Sci. 2018. PMID: 29755488 Free PMC article.
-
A SOC1-like gene MtSOC1a promotes flowering and primary stem elongation in Medicago.J Exp Bot. 2018 Sep 14;69(20):4867-4880. doi: 10.1093/jxb/ery284. J Exp Bot. 2018. PMID: 30295903 Free PMC article.
-
Medicago PHYA promotes flowering, primary stem elongation and expression of flowering time genes in long days.BMC Plant Biol. 2020 Jul 11;20(1):329. doi: 10.1186/s12870-020-02540-y. BMC Plant Biol. 2020. PMID: 32652925 Free PMC article.
-
Mechanisms of Vernalization-Induced Flowering in Legumes.Int J Mol Sci. 2022 Aug 31;23(17):9889. doi: 10.3390/ijms23179889. Int J Mol Sci. 2022. PMID: 36077286 Free PMC article. Review.
-
Regulation and function of SOC1, a flowering pathway integrator.J Exp Bot. 2010 May;61(9):2247-54. doi: 10.1093/jxb/erq098. Epub 2010 Apr 22. J Exp Bot. 2010. PMID: 20413527 Review.
Cited by
-
Modeling Floral Induction in the Narrow-Leafed Lupin Lupinus angustifolius Under Different Environmental Conditions.Plants (Basel). 2024 Dec 19;13(24):3548. doi: 10.3390/plants13243548. Plants (Basel). 2024. PMID: 39771246 Free PMC article.
-
Medicago Mting1 Mting2 double knockout mutants are extremely dwarfed and never flower implicating essential MtING functions in growth and flowering.BMC Plant Biol. 2025 Apr 1;25(1):410. doi: 10.1186/s12870-025-06432-x. BMC Plant Biol. 2025. PMID: 40169950 Free PMC article.
-
Unraveling the Complexities of Flowering in Ornamental Plants: The Interplay of Genetics, Hormonal Networks, and Microbiome.Plants (Basel). 2025 Apr 6;14(7):1131. doi: 10.3390/plants14071131. Plants (Basel). 2025. PMID: 40219203 Free PMC article. Review.
-
Longer Internode with Same Cell Length: LcSOC1-b2 Gene Involved in Height to First Pod but Not Flowering in Lentil (Lens culinaris Medik.).Plants (Basel). 2025 Apr 8;14(8):1157. doi: 10.3390/plants14081157. Plants (Basel). 2025. PMID: 40284045 Free PMC article.
References
-
- Benlloch R., d’Erfurth I., Ferrandiz C., Cosson V., Beltran J. P., Canas L. A., et al. . (2006). Isolation of mtpim proves Tnt1 a useful reverse genetics tool in Medicago truncatula and uncovers new aspects of AP1-like functions in legumes. Plant Physiol. 142, 972–983. doi: 10.1104/pp.106.083543 - DOI - PMC - PubMed
LinkOut - more resources
Full Text Sources
Molecular Biology Databases