

Estimation of the Ultraviolet-C Doses from Mercury Lamps and Light-Emitting Diodes Required to Disinfect Surfaces
- PMID: 38469433
- PMCID: PMC10857788
- DOI: 10.6028/jres.vol.126.025
Estimation of the Ultraviolet-C Doses from Mercury Lamps and Light-Emitting Diodes Required to Disinfect Surfaces
Abstract
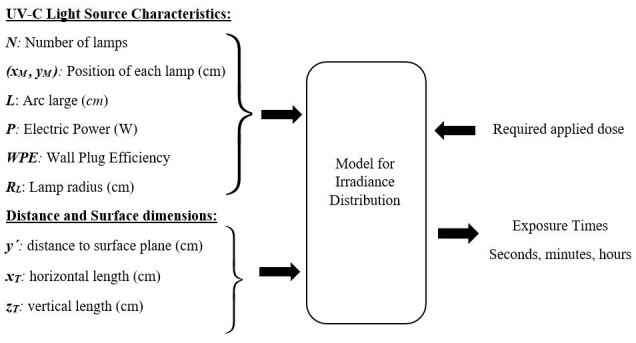
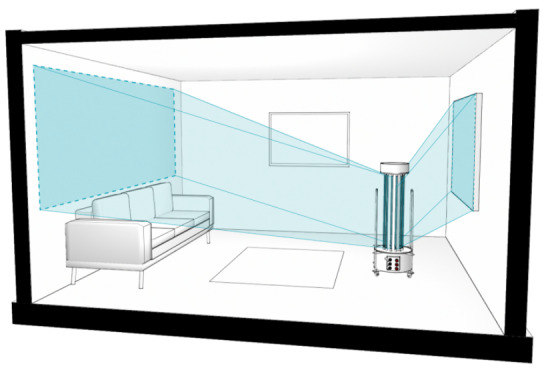
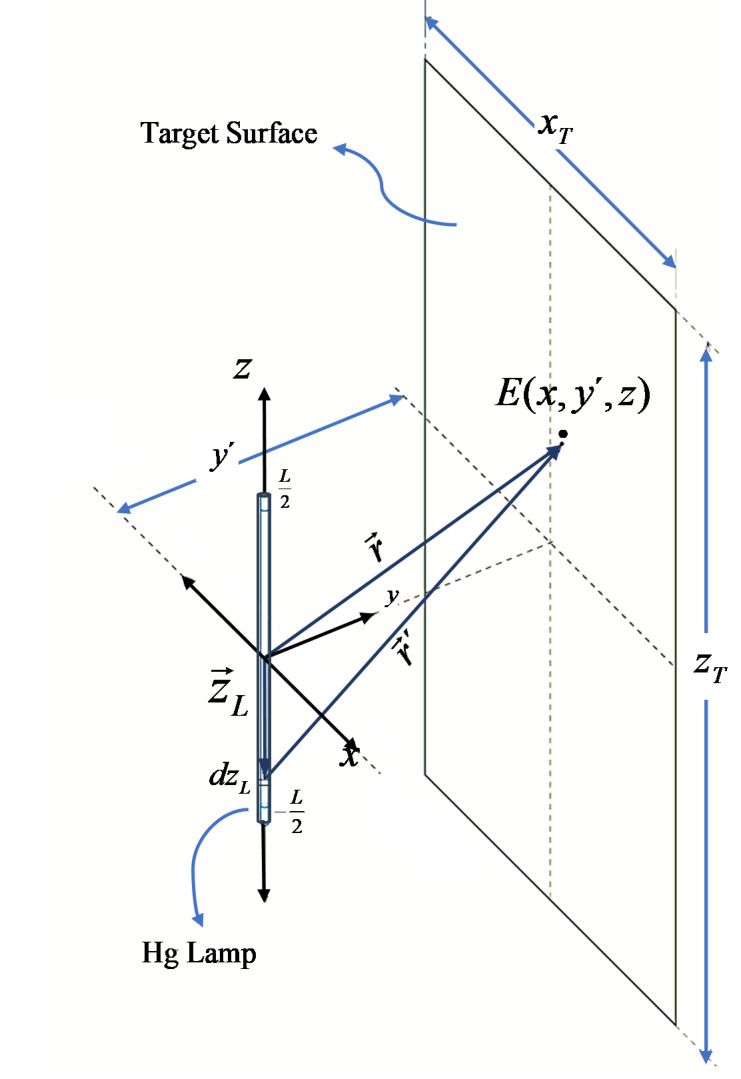
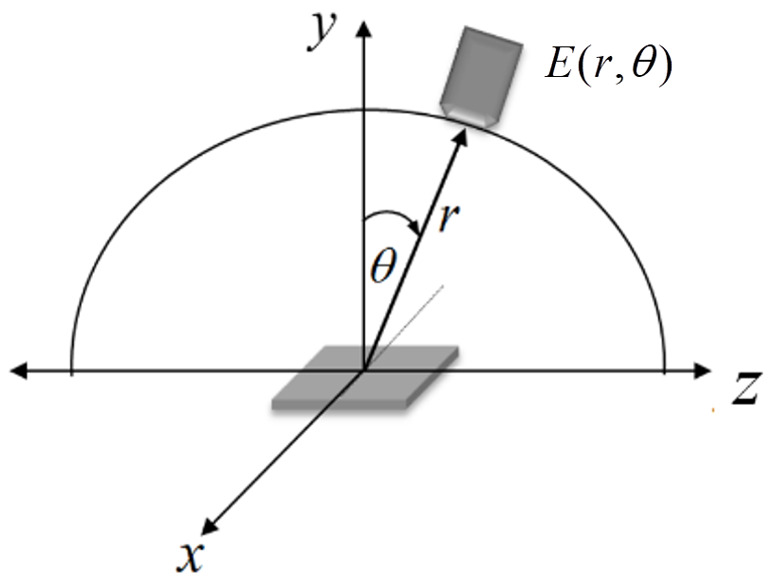
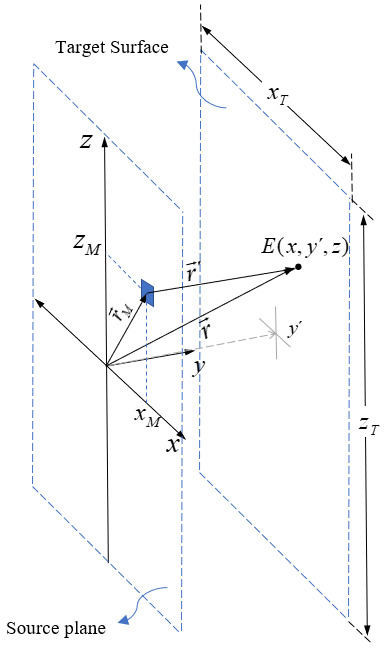
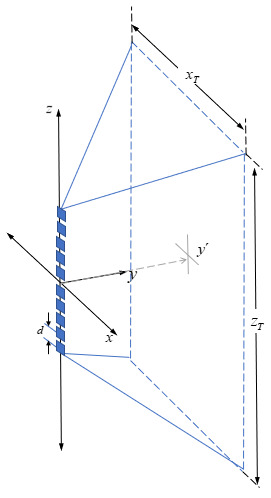
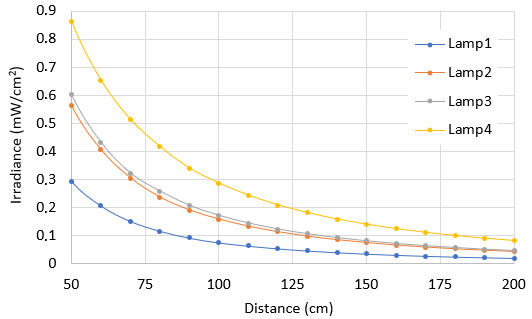
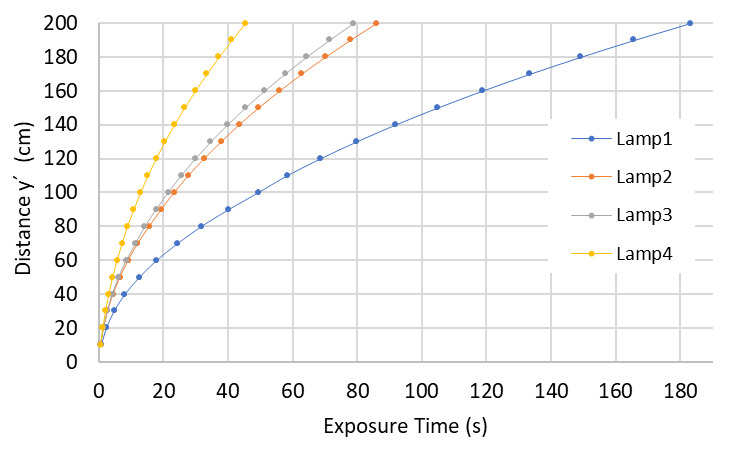
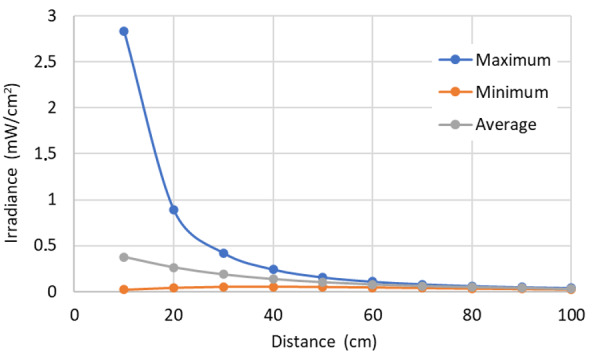
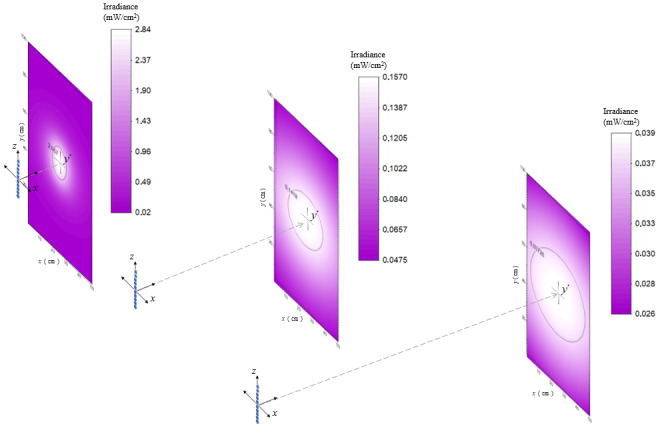
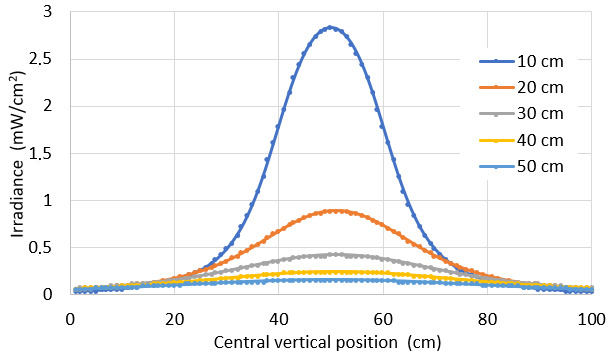
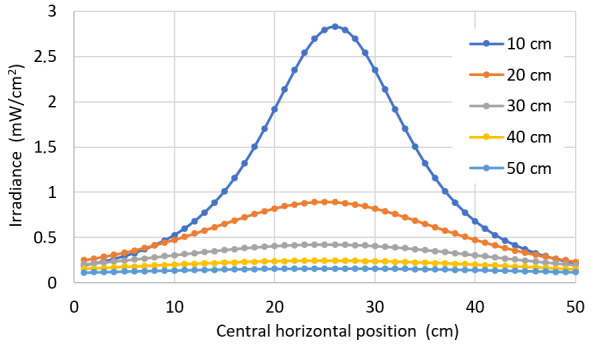
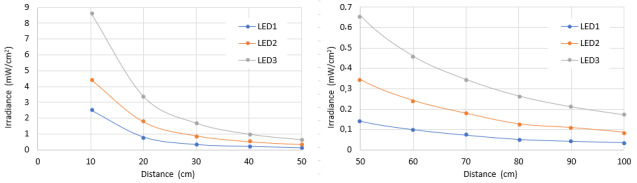
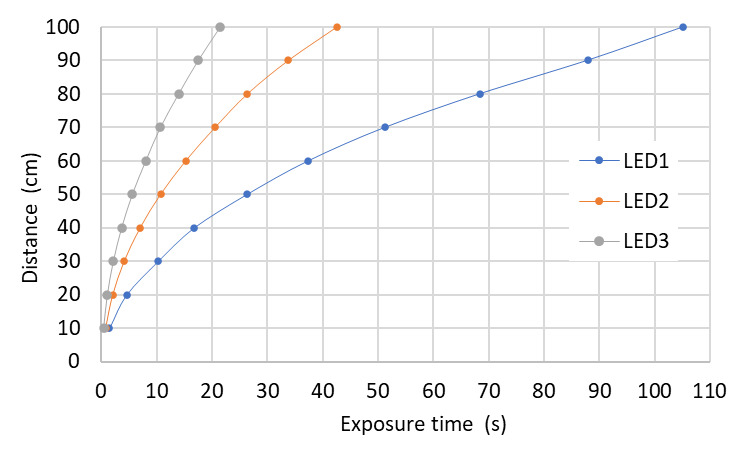
Disinfection of surfaces by ultraviolet-C (UV-C) radiation is gaining importance in diverse applications. However, there is generally no accepted computational procedure to determine the minimum irradiation times and UV-C doses required for reliable and secure disinfection of surfaces. UV-C dose distributions must be comparable for devices presently on the market and future ones, as well as for the diverse surfaces of objects to be disinfected. A mathematical model is presented to estimate irradiance distributions. To this end, the relevant parameters are defined. These parameters are the optical properties of the UV-C light sources, such as wavelength and emitted optical power, as well as electrical features, like radiant efficiency and consumed power. Furthermore, the characteristics and geometry of the irradiated surfaces as well as the positions of the irradiated surfaces in relation to the UV-C light sources are considered. Because mercury (Hg) lamps are competitive with UV-C light-emitting diodes, a comparative analysis between these two light sources based on the simulation results is also discussed.
Keywords: disinfection; dose; dose distribution; light-emitting diodes; modeling; simulation; surface disinfection; ultraviolet-C.
Figures
Similar articles
-
UV-C disinfection of ultrasound probes: Challenges of uneven irradiance on complex surfaces.PLoS One. 2024 Oct 30;19(10):e0312931. doi: 10.1371/journal.pone.0312931. eCollection 2024. PLoS One. 2024. PMID: 39476107 Free PMC article.
-
Synergy of MS2 disinfection by sequential exposure to tailored UV wavelengths.Water Res. 2018 Oct 15;143:292-300. doi: 10.1016/j.watres.2018.06.017. Epub 2018 Jun 18. Water Res. 2018. PMID: 29986239
-
Comparison of ultraviolet light-emitting diodes and low-pressure mercury-arc lamps for disinfection of water.Environ Technol. 2016 Sep;37(17):2183-8. doi: 10.1080/09593330.2016.1144798. Epub 2016 Feb 22. Environ Technol. 2016. PMID: 26888599
-
Considerations for determining the performance of ultraviolet light emitting diode fluid disinfection systems.Water Environ Res. 2023 Nov;95(11):e10947. doi: 10.1002/wer.10947. Water Environ Res. 2023. PMID: 38014702 Review.
-
Ozone Generation by Ultraviolet Lamps†.Photochem Photobiol. 2021 May;97(3):471-476. doi: 10.1111/php.13391. Epub 2021 Feb 22. Photochem Photobiol. 2021. PMID: 33534912 Review.
Cited by
-
UV surface disinfection in a wearable drug delivery device.Biomed Opt Express. 2022 Mar 16;13(4):2144-2155. doi: 10.1364/BOE.453270. eCollection 2022 Apr 1. Biomed Opt Express. 2022. PMID: 35519282 Free PMC article.
-
Ultraviolet Radiation Technologies and Healthcare-Associated Infections: Standards and Metrology Needs.J Res Natl Inst Stand Technol. 2021 Aug 20;126:126014. doi: 10.6028/jres.126.014. eCollection 2021. J Res Natl Inst Stand Technol. 2021. PMID: 38469449 Free PMC article.
-
Disinfection of Respirators with Ultraviolet Radiation.J Res Natl Inst Stand Technol. 2022 Mar 25;126:126058. doi: 10.6028/jres.126.058. eCollection 2021. J Res Natl Inst Stand Technol. 2022. PMID: 39359738 Free PMC article.
-
Models for an Ultraviolet-C Research and Development Consortium.J Res Natl Inst Stand Technol. 2022 Mar 25;126:126055. doi: 10.6028/jres.126.055. eCollection 2021. J Res Natl Inst Stand Technol. 2022. PMID: 38469448 Free PMC article.
References
-
- Poster DL, Miller CC, Obeng Y, Postek MT, Cowan TE, Martinello RA (2018) Innovative approaches to combat healthcare associated infections using efficacy standards developed through industry and federal collaboration. Nanoengineering: Fabrication, Properties, Optics, and Devices XV. Proceedings SPIE 10730:107301L. - PMC - PubMed
-
- Boyce J (2020) Use of Light for HAI Reduction. NIST Workshop on Ultraviolet Disinfection Technologies and Healthcare Associated Infections: Defining Standards and Metrology Needs, (National Institute of Standards and Technology, Gaithersburg, MD: ), January 14, 2020.
-
- Nottingham M, Peterson G, Doern C, Doll M, Masroor N, Sanogo K, Stevens M, Bearman G (2017) Ultraviolet-C light as a means of disinfecting anesthesia workstations. American Journal of Infection Control 45:1011–1013. - PubMed
LinkOut - more resources
Full Text Sources