. 2024 Mar 11;5(3):e512.
doi: 10.1002/mco2.512. eCollection 2024 Mar.

Hypoxia-activated ADCC-enhanced humanized anti-CD147 antibody for liver cancer imaging and targeted therapy with improved selectivity

Affiliations

Hypoxia-activated ADCC-enhanced humanized anti-CD147 antibody for liver cancer imaging and targeted therapy with improved selectivity

Fang-Zheng Qi et al. MedComm (2020). .

Abstract

Therapeutic antibodies (Abs) improve the clinical outcome of cancer patients. However, on-target off-tumor toxicity limits Ab-based therapeutics. Cluster of differentiation 147 (CD147) is a tumor-associated membrane antigen overexpressed in cancer cells. Ab-based drugs targeting CD147 have achieved inadequate clinical benefits for liver cancer due to side effects. Here, by using glycoengineering and hypoxia-activation strategies, we developed a conditional Ab-dependent cellular cytotoxicity (ADCC)-enhanced humanized anti-CD147 Ab, HcHAb18-azo-PEG5000 (HAP18). Afucosylated ADCC-enhanced HcHAb18 Ab was produced by a fed-batch cell culture system. Azobenzene (Azo)-linked PEG5000 conjugation endowed HAP18 Ab with features of hypoxia-responsive delivery and selective targeting. HAP18 Ab potently inhibits the migration, invasion, and matrix metalloproteinase secretion, triggers the cytotoxicity and apoptosis of cancer cells, and induces ADCC, complement-dependent cytotoxicity, and Ab-dependent cellular phagocytosis under hypoxia. In xenograft mouse models, HAP18 Ab selectively targets hypoxic liver cancer tissues but not normal organs or tissues, and has potent tumor-inhibiting effects. HAP18 Ab caused negligible side effects and exhibited superior pharmacokinetics compared to those of parent HcHAb18 Ab. The hypoxia-activated ADCC-enhanced humanized HAP18 Ab safely confers therapeutic efficacy against liver cancer with improved selectivity. This study highlights that hypoxia activation is a promising strategy for improving the tumor targeting potential of anti-CD147 Ab drugs.

Keywords: cluster of differentiation 147; hypoxia activation; liver cancer; on‐target off‐tumor toxicity; therapeutic antibody.


Conflict of interest statement

The authors declare they have no conflicts of interest.

Figures

FIGURE 1
FIGURE 1
Schematic diagram illustrating the targeted therapy of hypoxia‐activated humanized HAP18 Ab.
FIGURE 2
FIGURE 2
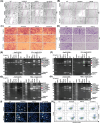
Development of conditionally activated HAP18 Ab. (A) Diagram of developing Ab‐dependent cellular cytotoxicity (ADCC)‐enhanced humanized HcHAb18 Ab. (B) Roadmap for producing defucosylated HcHAb18 Ab. After random mutagenesis induced by ICR‐191 and ethyl methanesulfonate (EMS), limiting dilution, and Lens culinaris agglutinin (LCA)‐resistance‐based cell cloning, CHO‐K1 cell lines deficient in a 1,6‐fucosyltransferase (FUT8), the only enzyme capable of Ab fucosylation in native cells, were selected. The HcHAb18 Ab was expressed in FUT8‐deficient CHO cells which produced defucosylated Ab. (C) Parameters of HcHAb18 expressing FUT8‐deficient CHO cells cultured in fed‐batch mode with 50 L of serum‐free medium. (D) Cation‐exchange chromatography analysis of HcHAb18 Ab captured by STREAMLINE expanded bed adsorption. A 510 cm inner diameter settled bed height Streamline 50 column was used. (E) SDS–PAGE analysis of the fractions from sample application (1), washing (2), and elution (3) steps during expended bed absorption purification. (F) Size‐exclusion high‐performance liquid chromatography (SEC‐HPLC) analysis of the purified HcHAb18 Ab. (G) Glycans were released from the Abs by PNGase F treatment and analyzed by high‐performance anion exchange chromatography with pulsed amperometric detection (HPAEC‐PAD). Glycans released from HcHAb18 (top) and cHAb18 (bottom) are shown. G0F, G1F, and G2F represent fucosylated biantennary complex‐type N‐glycans with 0, 1, and 2 terminal galactose residues, respectively; G1′F represents the fucosylated G1 positional isomer. (H) Synthesis scheme of the PEG5000‐azo‐NHS ester (compound #7). (I) Mass spectrum of the PEG5000‐azo‐NHS ester (compound #7). (J) HPLC absorbance spectrum of PEG5000‐azo‐NHS ester (compound #7). (K and L) The VL (magenta) and VH (blue) structures of HcHAb18 Ab were predicted by PIGS programs, and accessible lysine (yellow bond) residues are shown. In a head‐on view with respect to the idiotope rotated 90° (E), the VH and VL structures of HcHAb18 were rendered to show the surface feature that contributes to its idiotope by its complementarity determining regions (CDRs) (green characters as shown below). (M) SDS–PAGE analysis of HAP18 Ab with/without Na2S2O4 pretreatment. Ab samples were loaded under nonreducing and reducing conditions.
FIGURE 3
FIGURE 3
In vitro targeted delivery of the hypoxia‐activated HAP18 Ab. Surface plasmon resonance (SPR) determining the affinity of HcHAb18 (A), HAP18 (B), and Na2S2O4‐cleaved act HAP18 (C) Abs to CD147 Ag. (D) ELISA analysis of different Abs bound to CD147 Ag. n = 3. (E and F) Flow cytometry analysis of different Abs bound to HepG2 cells cultured under hypoxia or normoxia. Statistically difference compared with that of immunoglobulin G (IgG) (control) is shown (F). n = 3. (G and H) Confocal imaging of different Abs bound to HepG2 cells under hypoxia or normoxia. The Abs binding was quantified (H) and compared with that of IgG. Scale bar: 2 µm. n = 30. (I and J) Immunohistochemistry (IHC) staining of liver cancer samples from late‐stage liver cancer patients. Scale bar: 50 µm. Abs bound to liver cancer were quantified (J). IgG was used as a control. n = 10. (K) Confocal imaging of different Abs penetrating and bound to HepG2 MCTSs under hypoxia or normoxia. The fluorescence signal was collected at different levels from the top to the middle of spheroids on the z‐axis. Scale bar: 100 µm. n = 8. Representative data listed above are shown from at least two independent experiments. Significant differences compared with the control are shown. All the data are presented as mean ± standard deviation (SD). p‐Values (* p ≤ 0.05, ** p ≤ 0.01) were calculated two‐way via ANOVA and Student's t test.
FIGURE 4
FIGURE 4
In vitro immunological killing of hypoxia‐activated HAP18 Ab. Ab‐dependent cellular cytotoxicity (ADCC) activity mediated by HcHAb18, HAP18, and act HAP18 Abs in LDH release assays. Peripheral blood mononuclear cells (PBMCs) were used as effectors, and HepG2 cells cultured under normoxia (A–C) or hypoxia (I and J) were used as targets at different effector/target ratios (A, 1:1; B and I, 5:1; C and J, 25:1). n = 3. (D and K) Complement‐dependent cytotoxicity (CDC) activity mediated by different Abs in HepG2 cells cultured under normoxia (D) or hypoxia (K). n = 3. (E and L) Ab‐dependent cellular phagocytosis (ADCP) activity mediated by Abs on macrophages was tested by flow cytometry. Normoxic (E) or hypoxic (L) HepG2 cells were used as targets. n = 3. (F) Interferon‐γ (IFN‐γ) secretion from Ab‐treated effector cells (hPBMCs) with/without target cells (HepG2) was determined via ELISA. n = 3. (G and H) Proliferation efficiency of normoxic (G) or hypoxic (H) HepG2 cells inhibited by different Abs was tested by CCK‐8 assay. n = 3. All the data are presented as mean ± standard deviation (SD). p‐Values (* p ≤ 0.05, ** p ≤ 0.01) were calculated via one‐way ANOVA and two‐way ANOVA.
FIGURE 5
FIGURE 5
In vitro biological activity of the hypoxia‐activated HAP18 Ab. (A and B) Motility inhibition by different Abs in normoxic (A) or hypoxic (B) HepG2 cells was tested by scratch‐migration assays. n = 3. (C and D) Invasion efficiency of different Abs on normoxic (C) or hypoxic (D) HepG2 cells was tested by Matrigel‐coated transwell assays. Scale bars: 20 µm. n = 3. (E–H) Gelatin zymography was used to determine the activity of secreted MMPs in the concentrated culture medium (CCM) after the cells were exposed to different Abs for 24 h. Monoculture of HepG2 cells and coculture of HepG2 cells with 3T3 cells (E and F) or with hPBMCs (G and H) are presented. n = 2. (I) Hoechst 33342 staining of apoptotic HepG2 cells treated with different Abs. Apoptotic cell nuclei were deeply stained blue, and were dense and fragmented (marked with arrows). Scale bars: 20 µm. n = 3. (J) Flow cytometry was used to determine the degree of apoptosis in HepG2 cells triggered by different Abs for 24 h. Immunoglobulin G (IgG) was used as a control. n = 3. The representative data listed above are from at least two independent experiments. IgG was used as a control.
FIGURE 6
FIGURE 6
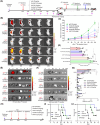
In vivo selective imaging and delivery of hypoxia‐activated HAP18 Ab for liver cancer targeted therapy. (A) Schedule of Ab imaging and therapy in human liver cancer‐xenografted mice model. To check the targeted selectivity, half of the mice (n = 6/group) received Abs (HcHAb18 and HAP18). Immunoglobulin G (IgG) was used as a control injection only once followed by dynamic fluorescence imaging. To check the hypoxia targeting, the other half of the mice (n = 6/group) received a second Ab injection followed by pimonidazole and Hoechst33342 injection for tissue‐section imaging. (B) Representative in vivo fluorescence imaging of tumor‐bearing mice injected with Cy7‐labeled Abs through the tail vein. (C) Growth curve of liver cancer volume during Ab treatment at low and high doses; bars represent the standard deviation (SD); n = 6/group. (D) Weights of excised tumors from the Ab‐treated groups; the bars represent the SDs; n = 6/group. (E and F) Representative ex vivo fluorescence signals from the main organs and liver cancer tissues of mice injected with Cy7‐labeled Abs through the tail vein. Heart (H), liver (Li), spleen (Sp), lung (Lu), kidney (K), stomach (St), and liver cancer tissues. n = 6/group. (G) Abs‐induced apoptotic signals from distinct tissues were quantified and analyzed; the bars represent the SDs; n = 6/group. (H) Schedule of HAP18 Ab‐based targeted therapy in liver cancer‐xenografted mice. (I and J) Survival rate after continuous Ab treatment (I: 5 mg/kg per mouse. J: 25 mg/kg per mouse) is illustrated by Kaplan–Meier curves. n = 8/group. All the data are presented as mean ± SD. p‐Values (* p ≤ 0.05, ** p ≤ 0.01) were calculated with Student's t test.
FIGURE 7
FIGURE 7
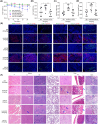
Ex vivo evaluation of the systemic toxicity of hypoxia‐activated HAP18 Ab. (A) Body weight curve of xenografted mice treated with different Abs (measured beginning on the 10th day postadministration with HepG2 cells); n = 8/group. (B–D) Liver, kidney, and stomach weights of mice treated with immunoglobulin G (IgG), HcHAb18, or HAP18 Abs. n = 8/group. All the data are presented as mean ± standard deviation (SD). p‐Values (* p ≤ 0.05, ** p ≤ 0.01) were calculated with Student's t test. (E) Representative colocalization signals of Cy7‐labeled Abs (red) with FITC‐pimonidazole (green), Hoechst 33342 (blue), or CD31 (green) in tissue sections of major organs from Ab‐treated mice. (F) Representative hematoxylin and eosin (H&E) staining of main organs and liver cancer tissues from Ab‐treated mice. Scale bar: 20 µm.

References

    1. Beck A, Goetsch L, Dumontet C, Corvaïa N. Strategies and challenges for the next generation of antibody–drug conjugates. Nat Rev Drug Discov. 2017;16(5):315‐337. doi:10.1038/nrd.2016.268 - DOI - PubMed
    1. Huang D, Rao D, Jin Q, et al. Role of CD147 in the development and diagnosis of hepatocellular carcinoma. Front Immunol. 2023;14:1149931. doi:10.3389/fimmu.2023.1149931 - DOI - PMC - PubMed
    1. Rahat MA. Mini‐review: can the metastatic cascade be inhibited by targeting CD147/EMMPRIN to prevent tumor recurrence? Front Immunol. 2022;13:855978. doi:10.3389/fimmu.2022.855978 - DOI - PMC - PubMed
    1. Bian H, Zheng JS, Nan G, et al. Randomized trial of [131I] metuximab in treatment of hepatocellular carcinoma after percutaneous radiofrequency ablation. J Natl Cancer Inst. 2014;106(9):dju239. doi:10.1093/jnci/dju239 - DOI - PubMed
    1. Xu J, Shen ZY, Chen XG, et al. A randomized controlled trial of Licartin for preventing hepatoma recurrence after liver transplantation. Hepatology. 2007;45(2):269‐276. doi:10.1002/hep.21465 - DOI - PubMed