. 2024 Feb 20;27(3):109300.
doi: 10.1016/j.isci.2024.109300. eCollection 2024 Mar 15.

sRNA-Effector: A tool to expedite discovery of small RNA regulators

Affiliations

sRNA-Effector: A tool to expedite discovery of small RNA regulators

Briana Wilson et al. iScience. .

Abstract

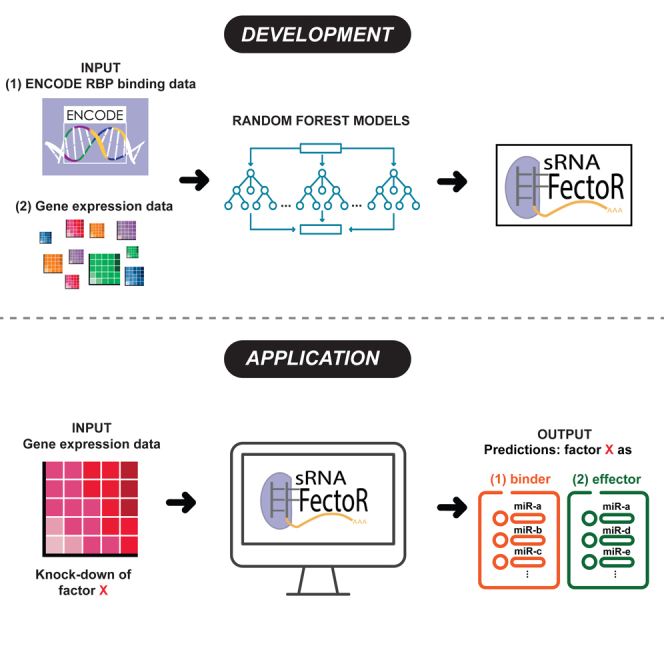
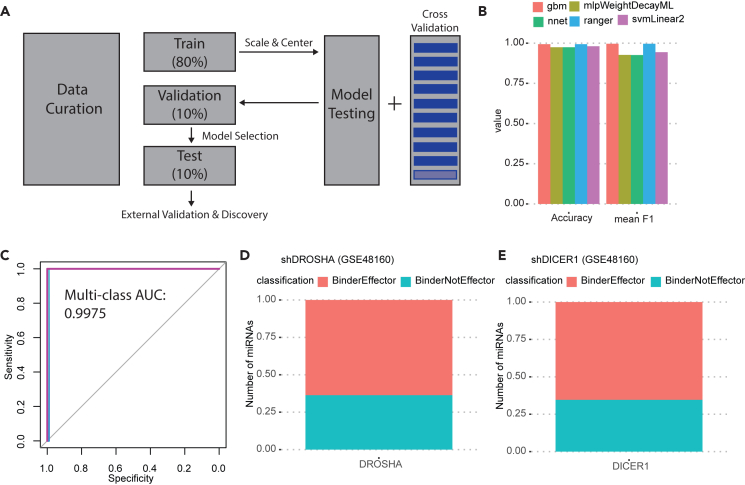
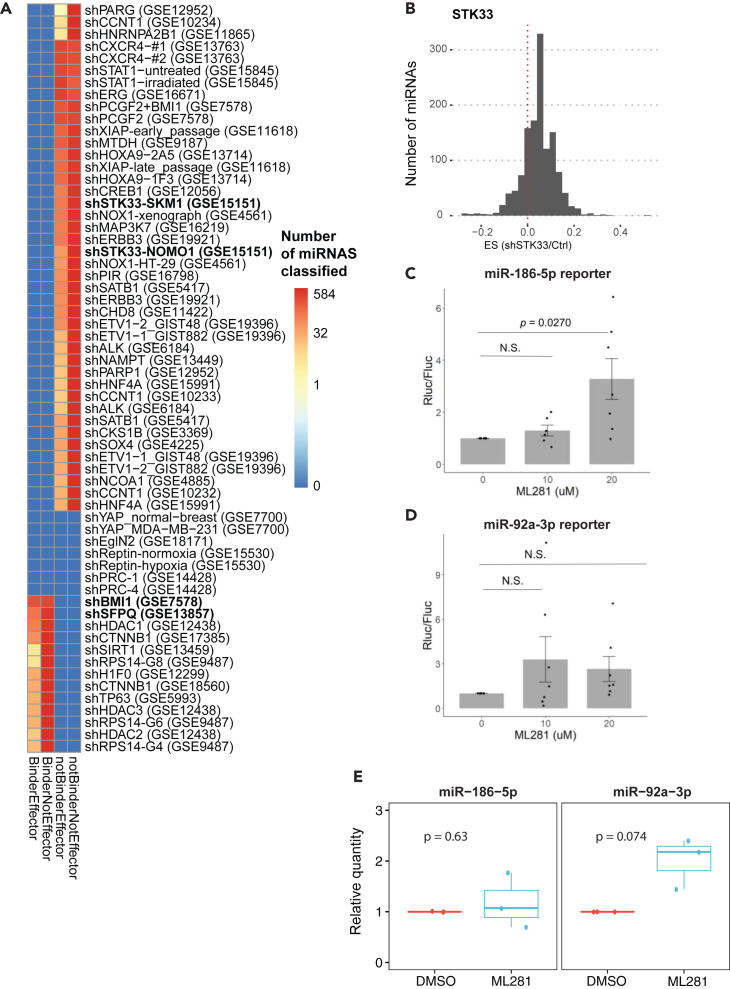
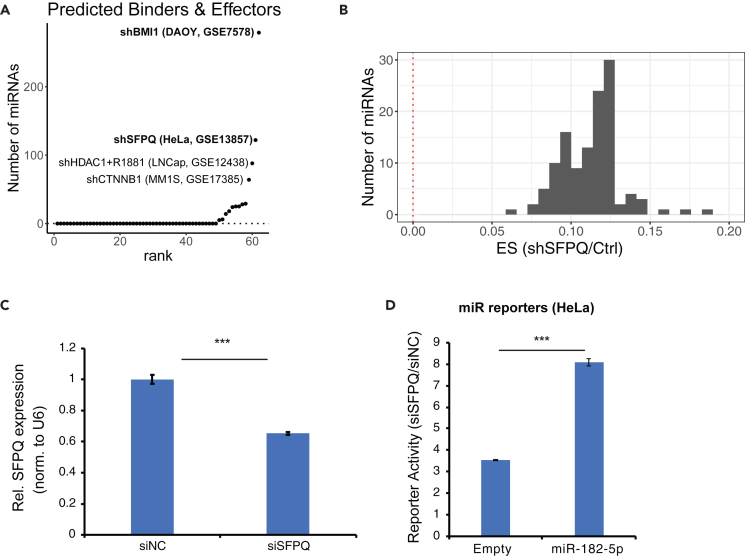
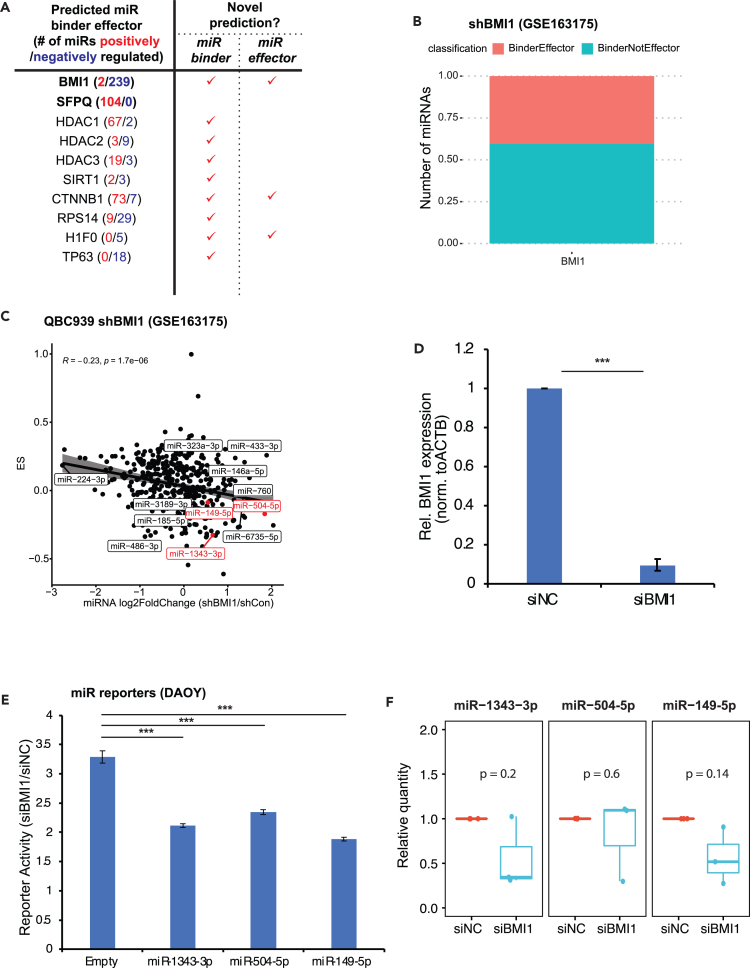
microRNAs (miRNAs) are small regulatory RNAs that repress target mRNA transcripts through base pairing. Although the mechanisms of miRNA production and function are clearly established, new insights into miRNA regulation or miRNA-mediated gene silencing are still emerging. In order to facilitate the discovery of miRNA regulators or effectors, we have developed sRNA-Effector, a machine learning algorithm trained on enhanced crosslinking and immunoprecipitation sequencing and RNA sequencing data following knockdown of specific genes. sRNA-Effector can accurately identify known miRNA biogenesis and effector proteins and identifies 9 putative regulators of miRNA function, including serine/threonine kinase STK33, splicing factor SFPQ, and proto-oncogene BMI1. We validated the role of STK33, SFPQ, and BMI1 in miRNA regulation, showing that sRNA-Effector is useful for identifying new players in small RNA biology. sRNA-Effector will be a web tool available for all researchers to identify potential miRNA regulators in any cell line of interest.

Keywords: Biocomputational method; Gene network; Machine learning; Nucleic acids.


Conflict of interest statement

The authors declare no competing interests.

Figures

None
Graphical abstract
Figure 1
Figure 1
Effect of depletion of known miRNA effectors on miRNA targets (A) Schematic overview of identification of miRNA effectors using gene expression data following perturbation of a gene of interest (GOI). Effect size (ES) is the horizontal shift of the target curve relative to the non-target curve at the 0.5 mark on the Y axis. (B) Effect sizes for miRNA targets after DROSHA depletion. (C and D) CDF plots of miR-19a-3p′s targets affected by DROSHA or DICER knockdown. (E) Heatmap of effect sizes for miRNA targets after depletion of other known miRNA effectors: DICER (HeLa), DGCR8 (HeLa), and AGO2 (HCT116). Each column corresponds to a different miRNA.
Figure 2
Figure 2
Effect sizes measured by RNA-seq after shRNA knockdown of different genes identify known and previously unknown putative miRNA effectors (A) Distribution of effect sizes for different miRNAs after DROSHA knockdown in HepG2. (B) Ranking of genes by fraction of miRNAs showing significant effect sizes after knockdown of the gene in HepG2. (C) Gene list as in (B) but by the average of significant effect size from negative ES to positive ES. (D–F) Same as (A–C) but in K562 cells. Red labels in F indicate genes that have the most extreme ES in either direction in HepG2 cells. Also in red is RBM39. ES, effect size.
Figure 3
Figure 3
eCLIP sequencing data complements miRNA effector identification based on shRNA sequencing results (A and B) eCLIP reads for putative miRNA effectors at the miR-20a (A) and miR-186 (B) locus shown on a gene browser. Each effector has two replicates in each cell type. Y axis indicates the effectors immunoprecipitated for the eCLIP reads. The thickness of the horizontal track is proportional to the read depth at that site. (C) Overlap of effectors and binders from ENCODE HepG2 shRNA sequencing and eCLIP, respectively. Effectors are genes whose knockdown leads to a significant ES in the CDF plots of targets vs. non-targets for at least one miRNA (Wilcoxon rank-sum test p < 0.05). Binders are genes that have a significant peak called by the ENCODE pipeline on at least one miRNA locus from eCLIP. Genes in red text are genes that are binders and effectors for the same miRNA.
Figure 4
Figure 4
A predictive model of miRNA effector discovery (A) Schematic showing the overall approach for development of a model to predict miRNA effectors. (B) Validation to evaluate the various models. Outcome metrics accuracy and mean F1 score (the average of the F1 scores for each predicted outcome) for the various tested models in the validation dataset. Gbm = gradient boosted machine, mlpWeightDecayML = multilayer perceptron with tunable hyperparameters weight and decay, nnet = neural network with a single layer, ranger = random forest, svmLinear2 = Support Vector Machines with Linear Kernel. (C) Receiver operator characteristic curve and average area under the curve results generated by the random forest model on the test dataset. There are four curves (representing each of the four possible classifications) that almost completely overlap. (D and E) External validation of the random forest model on shDROSHA and shDICER microarray data. 405 out of 636 high-confidence miRNAs were predicted to be bound and affected by DROSHA. 416 out of 636 high-confidence miRNAs were predicted to be bound and affected by DICER1.
Figure 5
Figure 5
Discovery of small RNA effectors using sRNA-Effector (A) Heatmap of sRNA-Effector predicted classifications for 55 microarray datasets from the GEO database. Note color is on log2 scale with a pseudocount of 0.001 added to avoid log2 of zero. The bold genes are the ones followed up for validation. (B–E) STK33 knockdown or inhibition derepresses specific miRNA targets. B) Distribution of effect size (ES) for miRNA targets after STK33 knockdown (GSE15151). (C and D) Luciferase reporter assay for miR-186-5p (C) and miR-92a-3p (D) after inhibition of STK33 with ML281 (p value by one-sample t test, n = 7; data are represented as mean ± SE). (E) miR-186-5p level is not altered by ML281 treatment (20 μM, 48 h). miR expression is normalized to spike-in control and DMSO treatment (p value by one-sample t test, n = 3).
Figure 6
Figure 6
sRNA-Effector identifies miRs affected by SFPQ (A) Ranking of the 55 datasets by the proportion of miRNAs predicted to be bound and affected by knocked-down genes. (B) Distribution of effect size (ES) for miRNA targets after SFPQ knockdown (GSE13857). (C) SFPQ is knocked down by siRNA in HeLa cells. Relative SFPQ expression is normalized to U6 small RNA. (D) SFPQ knockdown abrogated miR-182-5p repression activity, as measured by miRNA 3′ UTR dual-luciferase reporters (Y axis indicates siSFPQ versus siNC, p value by two-sample unpaired t test, n = 4, ∗∗∗p < 0.001). Data are represented as mean ± SD.
Figure 7
Figure 7
sRNA-Effector predicts miR binder effectors such as BMI1 (A) sRNA-Effector predicts both positive and negative miR binder effectors, including BMI1 as a novel negative regulator. See also Tables S7 and S8. (B) Classification results of sRNA-Effector on a separate shBMI RNA sequencing experiment (GSE163175). (C) Pearson correlation between effect size (ES) from shBMI1 RNA sequencing from (B) and the log2 fold change in miRNA after shBMI1 followed by small RNA sequencing (GSE163094) in QBC939 cells. Labeled points are a subset of points that have significant adjusted p values for both differential expression and ES, or (in red) the ones we validate experimentally in DAOY cells. (D) BMI1 is knocked down by siRNA in DAOY cells. Relative BMI1 expression is normalized to ACTB. (E) BMI1 knockdown enhanced miRNAs repression activity, as measured by miRNA 3′ UTR dual-luciferase reporters (Y axis indicates siBMI1 versus siNC, p value by two-sample unpaired t test, n = 4). (F) miR levels after BMI1 knockdown. miR expression is normalized to spike-in control and siRNA negative control (p value by one-sample t test, n = 3, ∗∗∗p < 0.001). Data are represented as mean ± SD.

Similar articles

References

    1. Lee Y.S., Shibata Y., Malhotra A., Dutta A. A novel class of small RNAs: tRNA-derived RNA fragments (tRFs) Genes Dev. 2009;23:2639–2649. doi: 10.1101/gad.1837609. - DOI - PMC - PubMed
    1. Cole C., Sobala A., Lu C., Thatcher S.R., Bowman A., Brown J.W.S., Green P.J., Barton G.J., Hutvagner G. Filtering of deep sequencing data reveals the existence of abundant Dicer-dependent small RNAs derived from tRNAs. RNA. 2009;15:2147–2160. doi: 10.1261/rna.1738409. - DOI - PMC - PubMed
    1. Bartel D.P. Metazoan MicroRNAs. Cell. 2018;173:20–51. doi: 10.1016/j.cell.2018.03.006. - DOI - PMC - PubMed
    1. Yang A., Shao T.-J., Bofill-De Ros X., Lian C., Villanueva P., Dai L., Gu S. AGO-bound mature miRNAs are oligouridylated by TUTs and subsequently degraded by DIS3L2. Nat. Commun. 2020;11:2765. doi: 10.1038/s41467-020-16533-w. - DOI - PMC - PubMed
    1. Heo I., Ha M., Lim J., Yoon M.-J., Park J.-E., Kwon S.C., Chang H., Kim V.N. Mono-uridylation of pre-microRNA as a key step in the biogenesis of group II let-7 microRNAs. Cell. 2012;151:521–532. doi: 10.1016/j.cell.2012.09.022. - DOI - PubMed

LinkOut - more resources