. 2024 Apr 10;15(4):e0049924.
doi: 10.1128/mbio.00499-24. Epub 2024 Mar 12.

The recruitment of TRiC chaperonin in rotavirus viroplasms correlates with virus replication

Affiliations

The recruitment of TRiC chaperonin in rotavirus viroplasms correlates with virus replication

Janine Vetter et al. mBio. .

Abstract

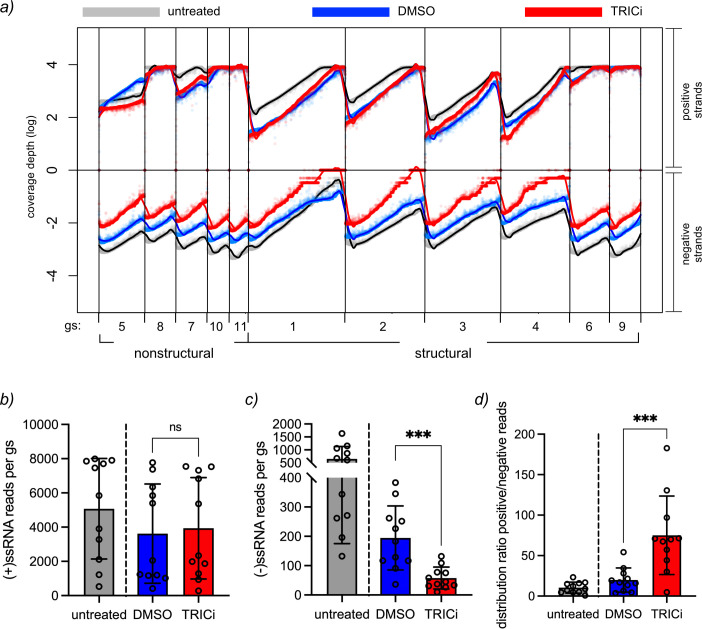
Rotavirus (RV) replication takes place in the viroplasms, cytosolic inclusions that allow the synthesis of virus genome segments and their encapsidation in the core shell, followed by the addition of the second layer of the virion. The viroplasms are composed of several viral proteins, including NSP5, which serves as the main building block. Microtubules, lipid droplets, and miRNA-7 are among the host components recruited in viroplasms. We investigated the interaction between RV proteins and host components of the viroplasms by performing a pull-down assay of lysates from RV-infected cells expressing NSP5-BiolD2. Subsequent tandem mass spectrometry identified all eight subunits of the tailless complex polypeptide I ring complex (TRiC), a cellular chaperonin responsible for folding at least 10% of the cytosolic proteins. Our confirmed findings reveal that TRiC is brought into viroplasms and wraps around newly formed double-layered particles. Chemical inhibition of TRiC and silencing of its subunits drastically reduced virus progeny production. Through direct RNA sequencing, we show that TRiC is critical for RV replication by controlling dsRNA genome segment synthesis, particularly negative-sense single-stranded RNA. Importantly, cryo-electron microscopy analysis shows that TRiC inhibition results in defective virus particles lacking genome segments and polymerase complex (VP1/VP3). Moreover, TRiC associates with VP2 and NSP5 but not with VP1. Also, VP2 is shown to be essential for recruiting TRiC in viroplasms and preserving their globular morphology. This study highlights the essential role of TRiC in viroplasm formation and in facilitating virion assembly during the RV life cycle.

Importance: The replication of rotavirus takes place in cytosolic inclusions termed viroplasms. In these inclusions, the distinct 11 double-stranded RNA genome segments are co-packaged to complete a genome in newly generated virus particles. In this study, we show for the first time that the tailless complex polypeptide I ring complex (TRiC), a cellular chaperonin responsible for the folding of at least 10% of the cytosolic proteins, is a component of viroplasms and is required for the synthesis of the viral negative-sense single-stranded RNA. Specifically, TRiC associates with NSP5 and VP2, the cofactor involved in RNA replication. Our study adds a new component to the current model of rotavirus replication, where TRiC is recruited to viroplasms to assist replication.

Keywords: NSP5; TRiC; VP2; chaperones; double-stranded RNA virus; rotavirus; viral replication; viroplasm.


Conflict of interest statement

The authors declare no conflict of interest.

Figures

Fig 1
Fig 1
Tandem mass spectrometry analysis of pull-down proteins recruited to NSP5-BioID2 in viroplasms. (a) Immunofluorescence images of RV-infected MA/NSP5-BioID2 cells treated with biotin either at 1 hpi (upper panel) or 5 hpi (lower panel) and fixed at 6 or 24 hpi, respectively. Viroplasms were immunostained with anti-VP2 (Alexa 594, red), and NSP5-BioID2 was detected with streptavidin-dylight488 (green). Nuclei were stained with DAPI (blue). Non-infected (NI) control cells are indicated at the top row. The scale bar is 10 µm. (b) Western blot of non-infected and RV-infected MA/NSP5-BioID2 cell extracts pulled down with streptavidin agarose beads. The cells were treated with 100 µM biotin for the indicated time post-infection (Tx). The membranes were incubated with anti-NSP5 (left) and streptavidin-HRP (right). Red brackets indicate the NSP5 hyperphosphorylation state. (c) Mass spectrometry of virus-infected and mock-infected cells. The log(I) values were normalized by subtracting the log(I) value of the NSP5 protein signal. The identified proteins were ranked according to the log of the normalized intensity signal from the mass spectrometry analysis. Proteins identified in the mock-infected samples were colored blue (c1 and c2), and proteins identified in virus-infected samples were colored red (v1 and v2). The sizes of the dots are inversely proportional to the log of the e-values from the mass spectrometry. (d) Western blot of streptavidin pull-down assay of non-infected and RV-infected NSP5-BioID2 cell lysates. As indicated in the upper scheme, the cells were treated at 1 hpi with biotin and lysed at 6 hpi. The input corresponds to 5% of cell lysates. The membrane was incubated with StAV-HRP and the indicated specific antibodies. Red brackets indicate the NSP5 hyperphosphorylation state.
Fig 2
Fig 2
TRiC subunits localize in viroplasms surrounding virus particles. (a) Immunofluorescence of RV-infected cells immunostained at 6 hpi for the detection of viroplasms (anti-NSP5, Alexa 488, green), microtubules (anti-alpha tubulin, Alexa 647, cyan), and TRiC subunits CCT1, CCT2, and CCT3 (Alexa 594, red). Nuclei were stained with DAPI (blue). The white-dashed box represents the enlarged image at the right. White arrows point to the co-localization of viroplasms with TRiC subunits. The scale bar is 10 µm. The plots in the right column correspond to the co-localization profile of the linear region of interest of NSP5 with the TRiC subunit. Immune electron microscopy of viroplasm fixed at 6 hpi. The thin sections were co-immunostained with either anti-NSP5 conjugated to 6 nm gold (b) or anti-VP6 conjugated to 6 nm gold (c) followed by anti-CCT3 conjugated to 12 nm gold. The white-dashed open boxes correspond to enlarged indicated images. Red arrowheads and white arrows point to the localization of CCT3 and NSP5 or VP6 surrounding DLPs. The scale bar is 200 nm.
Fig 3
Fig 3
TRiC inhibition impairs viroplasm morphology and virus progeny. (a) Immunofluorescence micrograph of OSU-infected MA104 cells untreated or treated with 1.25 or 2.5 mM TRICi and fixed at 6 hpi. The compound inhibitor was added at 1 or 5 hpi as indicated. Cells were immunostained to detect viroplasms (anti-NSP5, green). Nuclei were stained with DAPI (blue). An enlarged image of a single cell is provided in black and white. The scale bar is 10 µm. Plots for the quantification of numbers (b) and size (c) of viroplasms per cell after TRICi treatment from 1 to 6 hpi. Data represent the mean ± SD. n > 50 cells; ****P < 0.0001. (d) Plot for virus progeny of RV-infected cells treated with TRICi during the indicated time post-infection. Data represent the mean ± SD of three independent experiments; ****P < 0.0001. (e) Electropherotype of RV gs extracted at 6 hpi from RV-infected cells non-treated (NT) and treated with 1.25 or 2.5 mM TRICi for 5 h before cell lysis. (f) Immunofluorescence micrograph of OSU-infected cells showing the distribution of RV proteins after treatment with 1.25 mM TRICi since 1 hpi. At 6 hpi, cells were fixed and immunostained to detect viroplasms [anti-NSP5; guinea pig polyclonal (green) or mouse monoclonal (red) antibodies] and the indicated RV protein (using specific antibodies for each of them). Nuclei were stained with DAPI (blue). The capital letters in the upper right corner correlate with the analyzed protein: A, NSP2; B, NSP4; C, NSP3; D, VP1; E, VP2; F, VP6; G, VP7; and H, VP4. Each panel shows untreated (NT, left panel) and 1.25 mM TRICi-treated (TRICi, right panel) samples. The scale bar is 10 µm.
Fig 4
Fig 4
VP2 and NSP5 associate with TRiC. (a) Immunofluorescence of VLS induced with VP2 (left panel) or NSP2 (right panel) untreated (top row) or treated with TRICi (middle and bottom rows). The samples were fixed at 16 hpt and immunostained with specific antibodies for the visualization of NSP5 (green, Alexa 488), VP2 (red, Alexa 594), and NSP2 (red, Alexa 594). Nuclei were stained with DAPI (blue). Scale bar is 10 µm. Quantification of VLS plots induced by VP2 (b) or NSP2 (c) untreated or treated with TRICi at diverse concentrations. The data correspond to the mean ± SEM of >50 cells per experimental point. Welch-ANOVA where ****P < 0.0001. (d) Immunofluorescence images of VLSs composed of the indicated RV proteins. At 16 hpt, the cells were fixed and immunostained to detect CCT3 (anti-CCT3, Alexa 488, green), VLS (anti-NSP5, Alexa 594, red), and VP2 (anti-VP2, Alexa 647, cyan) or NSP2 (anti-NSP2, Alexa 647, cyan). Nuclei were stained with DAPI (blue). Scale bar is 10 µm. Plots for quantifying NSP5 (e) and CCT3 (f) localization in VLSs composed of the indicated RV proteins. The data means were compared using the Tukey method where *P < 0.05 and ****P < 0.0001. Immunoblotting of anti-TRiC immunoprecipitated from BHK/T7 cell lysates expressing NSP5 (g) and VP2 (h). The membranes were incubated with the indicated antibodies. The input corresponds to 5% of crude cell extract. IgG corresponds to immunoprecipitation with isotype control antibody. ** points to the light chain immunoglobulin.
Fig 5
Fig 5
Rotavirus negative-strand synthesis is hampered upon inhibition of TRiC. (a) ONT for direct sequencing of rotavirus positive- and negative-sense RNA of the 11 genome segments from RV-infected cells at 6 hpi, untreated (gray point and black lines) or treated with compound carrier (DMSO, blue lines) or 2.5 mM TRICi (red lines). The chemical compound was added at 1 hpi until cell lysis. The plot indicates the depth of the sequence coverage in the logarithmic scale of the positive- (top) and negative (bottom)-sense RNA for the 11 RV genome segments, where nonstructural and structural proteins are indicated. While the experiment with untreated cells corresponds to a methodologic pilot experiment performed separately, the DMSO- and TRICi-treated RV-infected cell samples were prepared simultaneously and, consequently, compared statistically. Plot for the distribution of the positive (b) and negative (c) RNA reads per genome segment from untreated, DMSO-, and TRICi-treated RV-infected cells. (d) Plot comparing the ratio between positive and negative RNA sequence reads of RV-infected cell extracts untreated or treated with DMSO or TRICi. RM one-way ANOVA was performed between samples where ***P > 0.001.
Fig 6
Fig 6
Inhibition of TRiC leads to empty DLPs. (a) High-definition electron microscopy of OSU-infected MA104 cells untreated and treated with TRICi at the indicated concentrations. The inhibitor was added at 1 hpi, and the samples were fixed at 6 hpi. The red, open arrowheads point to the endoplasmic reticulum surrounding viroplasms. The scale bar is 500 nm. (b) Image of purified OSU subviral particles with isopycnic cesium chloride gradient of infected cells untreated or treated at 1 hpi with 2.5 mM TRICi. The subviral particles were extracted at 8 hpi. The arrows point to the collected fractions. (c) Coomassie blue staining of subviral particles found in the indicated fractions. The arrows point to the corresponding structural proteins. (d) Analysis of dsRNA genome segments extracted from subviral particles of the indicated CsCl gradient fractions. Samples were detected with TapeStation Agilent using genomic DNAScreen Tape. (e) Negative staining of purified subviral particles from the indicated fractions of the CsCl gradient. (f) Plot corresponding to the size mean ± SD of the subviral particles fractions of CsCl gradient. One-way ANOVA, ****P-value < 0.001. (g) Cryo-EM structures of TLP and DLP derived from TRICi-treated cells. Cryo-EM 3D reconstructions of TRICi TLP (i), TRICi DLP (ii), and control TLP [iii, EMD-2574 (67)]. Surface-shaded representation of the outer (top row) and inner (middle row) surfaces viewed along an icosahedral twofold axis. The surfaces are radially color-coded to represent VP5*/VP8* spikes (red), VP7 (yellow), VP6 (blue), VP2 (green), and VP1/genome (purple). The lower row represents 2.74 Å thick central sections of the maps. The scale bar is 250 Å.

Similar articles

Cited by

References

    1. McNulty MS, Curran WL, McFerran JB. 1976. The morphogenesis of a cytopathic bovine rotavirus in Madin-Darby bovine kidney cells. J Gen Virol 33:503–508. doi:10.1099/0022-1317-33-3-503 - DOI - PubMed
    1. Saif LJ, Theil KW, Bohl EH. 1978. Morphogenesis of porcine rotavirus in porcine kidney cell cultures and intestinal epithelial cells. J Gen Virol 39:205–217. doi:10.1099/0022-1317-39-2-205 - DOI - PubMed
    1. Altenburg BC, Graham DY, Estes MK. 1980. Ultrastructural study of rotavirus replication in cultured cells. J Gen Virol 46:75–85. doi:10.1099/0022-1317-46-1-75 - DOI - PubMed
    1. Settembre EC, Chen JZ, Dormitzer PR, Grigorieff N, Harrison SC. 2011. Atomic model of an infectious rotavirus particle. EMBO J 30:408–416. doi:10.1038/emboj.2010.322 - DOI - PMC - PubMed
    1. Li Z, Baker ML, Jiang W, Estes MK, Prasad BVV. 2009. Rotavirus architecture at subnanometer resolution. J Virol 83:1754–1766. doi:10.1128/JVI.01855-08 - DOI - PMC - PubMed

LinkOut - more resources