. 2024 Sep;81(9-10):448-472.
doi: 10.1002/cm.21850. Epub 2024 Mar 12.

Sarcomeric tropomyosin expression during human iPSC differentiation into cardiomyocytes

Affiliations

Sarcomeric tropomyosin expression during human iPSC differentiation into cardiomyocytes

Dipak K Dube et al. Cytoskeleton (Hoboken). 2024 Sep.

Abstract

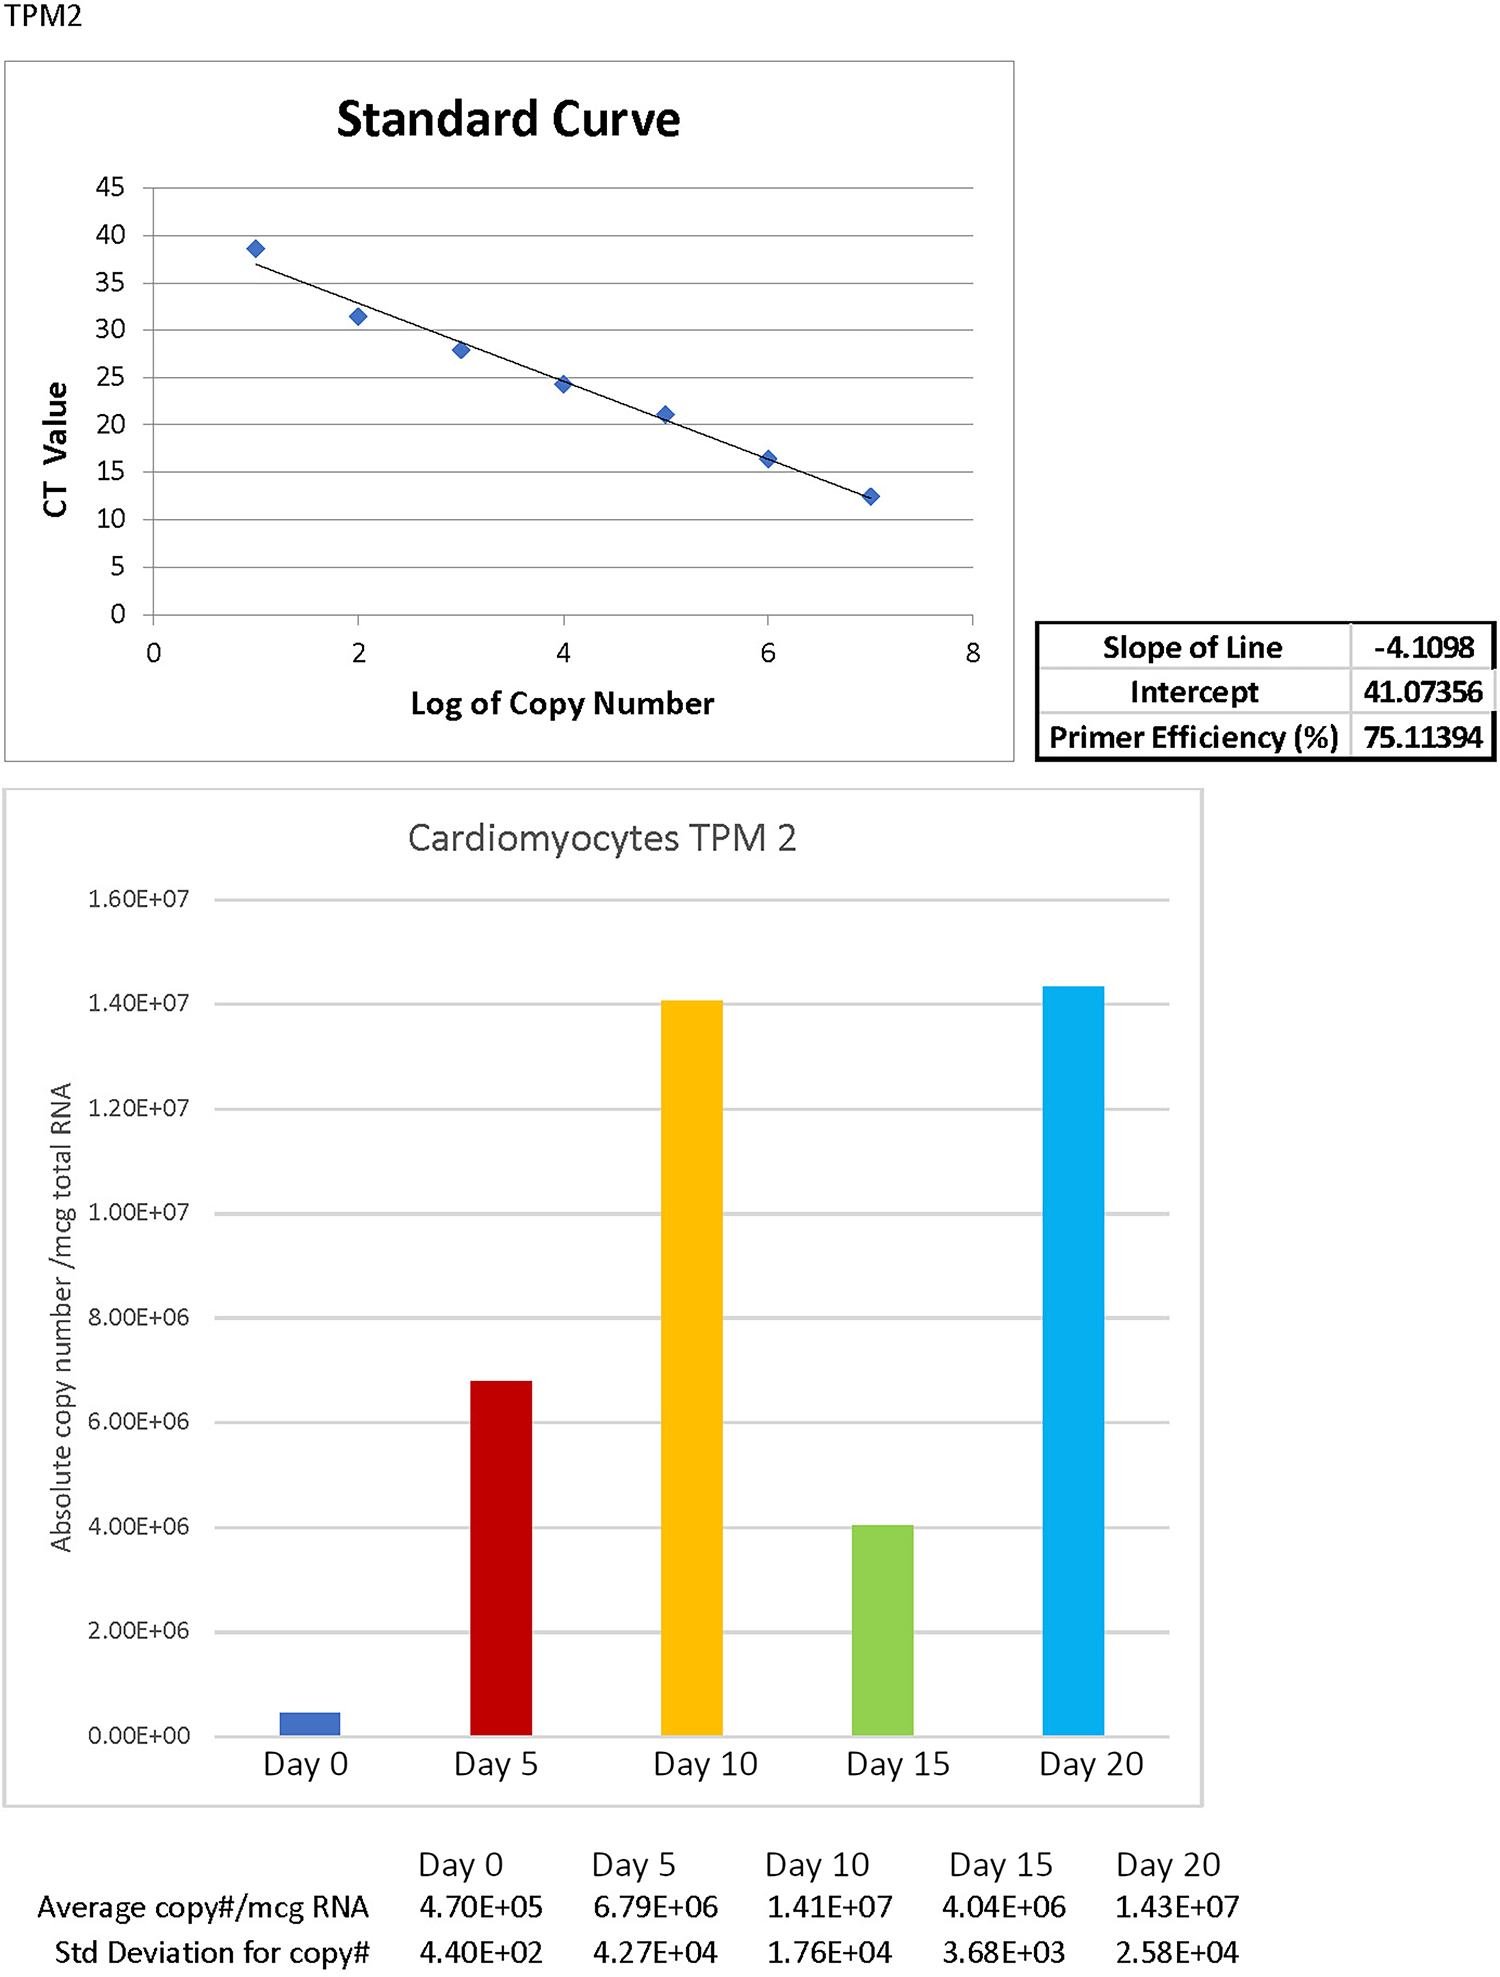
Tropomyosin (TPM) is an essential sarcomeric component, stabilizing the thin filament and facilitating actin's interaction with myosin. In mammals, including humans, there are four TPM genes (TPM1, TPM2, TPM3, and TPM4) each of which generates a multitude of TPM isoforms via alternative splicing and using different promoters. In this study, we have examined the expression of transcripts as well as proteins of various sarcomeric TPM isoforms during human inducible pluripotent stem cell differentiation into cardiomyocytes. During the differentiation time course, we harvested cells on Days 0, 5, 10, 15, and 20 to analyze for various sarcomeric TPM transcripts by qRT-PCR and for sarcomeric TPM proteins using two-dimensional Western blot with sarcomeric TPM-specific CH1 monoclonal antibody followed by mass spectra analyses. Our results show increasing levels of total TPM transcripts and proteins during the period of differentiation, but varying levels of specific TPM isoforms during the same period. By Day 20, the rank order of TPM transcripts was TPM1α > TPM1κ > TPM2α > TPM1μ > TPM3α > TPM4α. TPM1α was the dominant protein produced with some TPM2 and much less TPM1κ and μ. Interestingly, small amounts of two lower molecular weight TPM3 isoforms were detected on Day 15. To the best of our knowledge this is the first demonstration of TPM1μ non-muscle isoform protein expression before and during cardiac differentiation.

Keywords: LC‐MS/MS; TPM1α; TPM1μ; hiPSC‐derived cardiomyocytes; qRT‐PCR.


Conflict of interest statement

Conflict of Interest

No, there is no conflict of interest

Figures

Figure 1.
Figure 1.. Alternative splicing patterns of TPM genes in human/non-human primates that generate high molecular weight isoforms.
Tpm1α : Tpm1.1; Tpm1κ : Tpm1.2; TPM1μ: Tpm1.5; TPM1ξ : None
Figure 2.
Figure 2.. Conventional RT-PCR amplification of human Nkx-2.5, GATA-4, TNNT2, TNNI3, and GAPDH with RNA from hiPSCs (Day 0), hiPSC Day 5 CM, Day 10 CM, Day 15 CM, Day 20 CM
Panel A: Nkx-2.5; Panel B: GATA4; Panel C: TNNT2; Panel D: TNNI3; Panel E: GAPDH Lane 1: hiPSCs-Day 0; Lane 2: Day 5 CM; Lane 3: Day 10 CM; Lane 4: Day 15 CM; Lane 5: Day 20 CM
Figure 3.
Figure 3.. Absolute copy number determination of TPM1α transcripts during hiPSC cardiac differentiation. The standard curve for control RNAs is shown. Days in culture are shown.
Three replicate assays were performed. The averages and standard deviations are shown. We used Mann-Whitney U test (Mann and Whitney, 1947) to determine the statistical significance. The p values (0.1) comparing day 0 to any of the other days did not reach statistical significance.
Figure 4.
Figure 4.. Absolute copy number determination of TPM1μ transcripts during hiPSC cardiac differentiation. The standard curve for control RNAs is shown. Days in culture are shown.
Three replicate assays were performed. The averages and standard deviations are shown. We used Mann-Whitney U test to determine the statistical significance. The p values for none of the days is < or = to 0.05. Hence, the differences are not statistically significant
Figure 5.
Figure 5.. Absolute copy number determination of TPM1κ transcripts during hiPSC cardiac differentiation. The standard curve for control RNAs is shown. Days in culture are shown.
Three replicate assays were performed. The averages and standard deviations are shown. We used Mann-Whitney U test to determine the statistical significance. The p values (0.1) for comparisons of day 0 to any other day did not reach significance.
Figure 6.
Figure 6.. Absolute copy number determination of TPM2α transcripts during hiPSC cardiac differentiation. The standard curve for control RNAs is shown. Days in culture are shown.
Three replicate assays were performed. The averages and standard deviations are shown. We used Mann-Whitney U test to determine the statistical significance. The p values for none of the days is < or = to 0.05. Hence, the differences are not statistically significant
Figure 7.
Figure 7.. Absolute copy number determination of TPM3α transcripts during hiPSC cardiac differentiation. The standard curve for control RNAs is shown. Days in culture are shown.
Three replicate assays were performed. The averages and standard deviations are shown. We used Mann-Whitney U test to determine the statistical significance. The p values for none of the days is < or = to 0.05. Hence, the differences are not statistically significant
Figure 8.
Figure 8.. Absolute copy number determination of TPM4α transcripts during hiPSC cardiac differentiation. The standard curve for control RNAs is shown. Days in culture are shown.
Three replicate assays were performed. The averages and standard deviations are shown. We used Mann-Whitney U test to determine the statistical significance. The p values for none of the days is < or = to 0.05. Hence, the differences are not statistically significant
Figure 9.
Figure 9.. Conventional Western blot analyses of the extracts from hiPSC-CM cells grown for different days with antibodies against actin, high molecular weight TPM, and GAPDH.
Top Panel: Blot stained with Ponceau dye. Panel Actin. Signal with anti-actin monoclonal antibody, JLA-20. Panel TPM. Signal with anti-TPM monoclonal antibody TM311 Panel GAPDH. Signal with anti-GAPDH monoclonal antibody. Lane 1. Day 0 cells; Lane 2. Day 5 hiPSC-CM; Lane 3. Day 10 hiPSC-CM; Lane 4. Day 15 hiPSC-CM; Lane 5. Day 20 hiPSC-CM; Lane M. Molecular weight marker
Figure 10.
Figure 10.. 2D Western blot analyses with the extract from Day 0 hiPSC cells.
10a. Upper Left. The Coomassie stained blot of day 0 cell extract proteins. The square represents “The region of interest”. 10.b. The right side is the enlarged ROI. 10c. Bottom left: The PVDF filter was stained with CH1 monoclonal antibody followed by treatment with secondary antibody as mentioned in materials and methods, and subsequently treated with ECL and exposed to x-ray film for 3 minutes. Developed X-ray film was superimposed on the top of the Coomassie stained second gel as well as on the Coomassie stained PVDF filter. One spot (A) was marked, excised and used for extraction of protein for subsequent mass spectrometric analyses. 10d.Bottom right: The enlarged ROI.
Figure 11.
Figure 11.. TPM1μ amino acid sequences identified by LC-MS/MS analysis from the extracted peptides of Spot A after 2D Western blot analysis of day 0 hiPSC cell proteins with CH1 monoclonal antibody.
Red color letters indicate peptide sequences identified by mass spectra.
Figure 12.
Figure 12.. 2D Western blot analyses with the extract from Day 5 hiPSC-CM
12a. Upper Left: The Coomassie stained blot of day 5 cell extract proteins. The square represents the region of interest. 12b. Upper right: The enlarged ROI. 12c. Bottom left: The PVDF filter was stained with CH1 monoclonal antibody followed by treatment with a secondary antibody as stated in materials and methods, and subsequently treated with ECL and exposed for 3 minutes to x-ray film. Developed X-ray film was superimposed on the top of the Coomassie stained second gel as well as on the Coomassie stained PVDF filter. Four spots, A, B, C, and D were marked, excised and used for extraction of protein for subsequent mass spectra analyses. 12d. Bottom right: Enlarged ROI
Figure 13.
Figure 13.. Identification of amino acid sequences from the peptides extracted from Spots A, B, C, and D after 2D western blot analyses of day 5 hiPSC cell protein with CH1 monoclonal antibody.
Red color letters indicate peptide sequences identified by mass spectra.
Figure 14.
Figure 14.. 2D Western blot analyses with the extract from Day 10 hiPSC-CM
14a. Upper Left: The Coomassie stained blot of Day 10 cell extract proteins. The square represents “The region of Interest”. 14b. Upper Right: The enlarged ROI. 14c. Bottom Left: The PVDF filter was stained with CH1 monoclonal antibody followed by treatment with secondary antibody as stated in materials and methods, and subsequently treated with ECL and exposed to x-ray film for 3 minutes. Developed X-ray film was superimposed on the top of the Coomassie stained second gel as well as on the Coomassie stained PVDF filter. Three spots A, B, and C were marked, excised, and were used for extraction of protein for subsequent mass spectrometric analyses. 14d. Bottom Right: The enlarged ROI.
Figure 15.
Figure 15.. Identification of amino acid sequences from the peptides extracted from Spots A, B and C after 2D Western blot analyses of day 10 hiPSC-CM cell protein with CH1 monoclonal antibody.
Red color letters indicate peptide sequences identified by mass spectra.
Figure 16.
Figure 16.. 2D Western blot analyses with the extract from Day 15 hiPSC-CM
16a. Upper Left: The Coomassie stained blot of Day 15 cell extract proteins. The square represents “The region of Interest”. 16b. Upper Right: The enlarged ROI. 16c. Middle Left: The PVDF filter was stained with CH1 monoclonal antibody followed by treatment with secondary antibody as stated in materials and methods, and subsequently treated with ECL and exposed to x-ray film for 3 minutes. Developed X-ray film was superimposed on the top of the Coomassie stained second gel as well as on the Coomassie stained PVDF filter. Seven spots A, B, C, D, E, F, and G were marked, excised, and were used for extraction of protein for subsequent mass spectrometric analyses. 16d. Middle Right: The enlarged ROI. 16e Bottom Left : X-ray film was exposed for 30 seconds 16f. Bottom Right: The enlarged ROI.
Figure 17.
Figure 17.. Identification of amino acid sequences from the peptides extracted from Spots A, B, C, D, E, F, and G after 2D Western blot analyses of day 15 hiPSC-CM cell protein with CH1 monoclonal antibody.
Red color letters indicate peptide sequences identified by mass spectra.
Figure 18.
Figure 18.. 2D Western blot analyses with the extract from Day 20 hiPSC-CM.
18a. Upper Left: The Coomassie stained blot of Day 20 cell extract proteins. The square represents “The region of Interest”. 18b. Upper Right: The enlarged ROI. 18c. Middle Left: The PVDF filter was stained with CH1 monoclonal antibody followed by treatment with secondary antibody as stated in materials and methods, and subsequently treated with ECL and exposed to x-ray film for 3 minutes. Developed X-ray film was superimposed on the top of the Coomassie stained second gel as well as on the Coomassie stained PVDF filter. Seven spots A, B, C, D, E, F, and G were marked, excised, and were used for extraction of protein for subsequent mass spectrometric analyses. 18d. Middle Right: The enlarged ROI. 18e. Bottom left. Exposed to X-ray film for one minute. 18f. Bottom right: The enlarged ROI.
Figure 19.
Figure 19.. Identification of amino acid sequences from the peptides extracted from Spots A, B, C, D, E, F, and G after 2D Western blot analyses of matured (Day 20) hiPSC-CM cell protein with CH1 monoclonal antibody.
Red color letters indicate peptide sequences identified by mass spectra.

Similar articles

Cited by

References

    1. Bailey K (1948). Tropomyosin: a new asymmetric protein component of the muscle fibril. Biochem J, 43, 271–279. - PMC - PubMed
    1. Bang ML, Chen J (2015) Roles of nebulin family members in the heart. Circulation J 79: 2081–2087. - PubMed
    1. Bonzo JR, Norris AA, Esham M, Moncman CL (2008) The nebulette repeat domain is necessary for proper maintenance of tropomyosin with the cardiac sarcomere. Exp Cell Res. 314:3519–30. doi: 10.1016/j.yexcr.2008.09.001. - DOI - PubMed
    1. Darie CC, Deinhardt K, Zhang G, Cardasis HS, Chao MV, & Neubert TA (2011). Identifying transient protein-protein interactions in EphB2 signaling by blue native PAGE and mass spectrometry. Proteomics, 11, 4514–4528. doi: 10.1002/pmic.201000819 - DOI - PMC - PubMed
    1. Denz CR, Narshi A, Zajdel RW, & Dube DK (2004). Expression of a novel cardiac-specific tropomyosin isoform in humans. Bioch Biophys Res Commun, 320, 1291–1297. doi: 10.1016/j.bbrc.2004.06.084 - DOI - PubMed

MeSH terms

LinkOut - more resources