. 2024 Mar 12;134(9):e175332.
doi: 10.1172/JCI175332.

Chronic SIV-Induced neuroinflammation disrupts CCR7+ CD4+ T cell immunosurveillance in the rhesus macaque brain

Affiliations

Chronic SIV-Induced neuroinflammation disrupts CCR7+ CD4+ T cell immunosurveillance in the rhesus macaque brain

Sonny R Elizaldi et al. J Clin Invest. .

Abstract

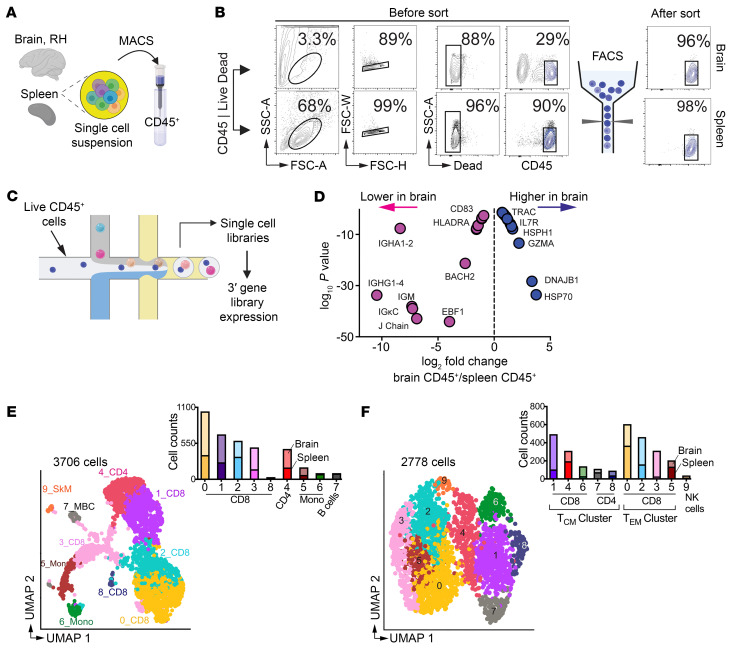
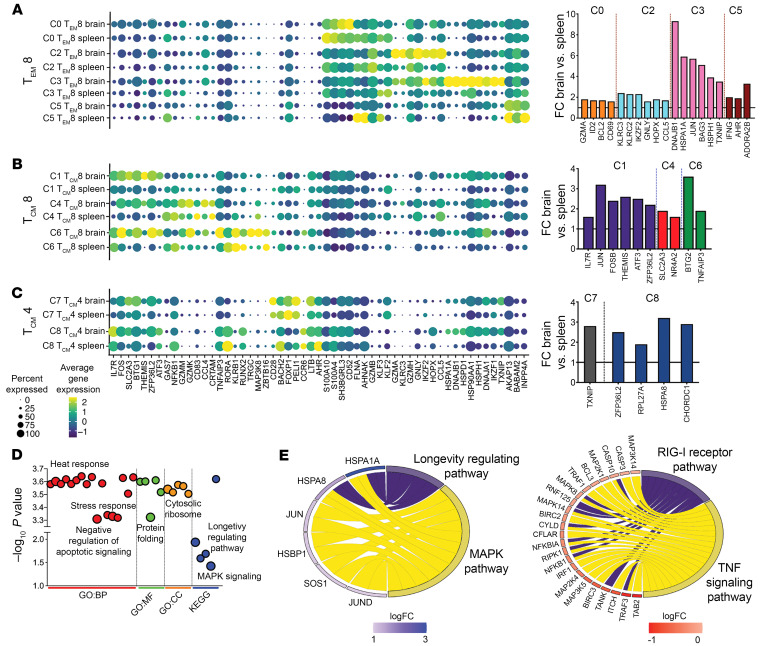
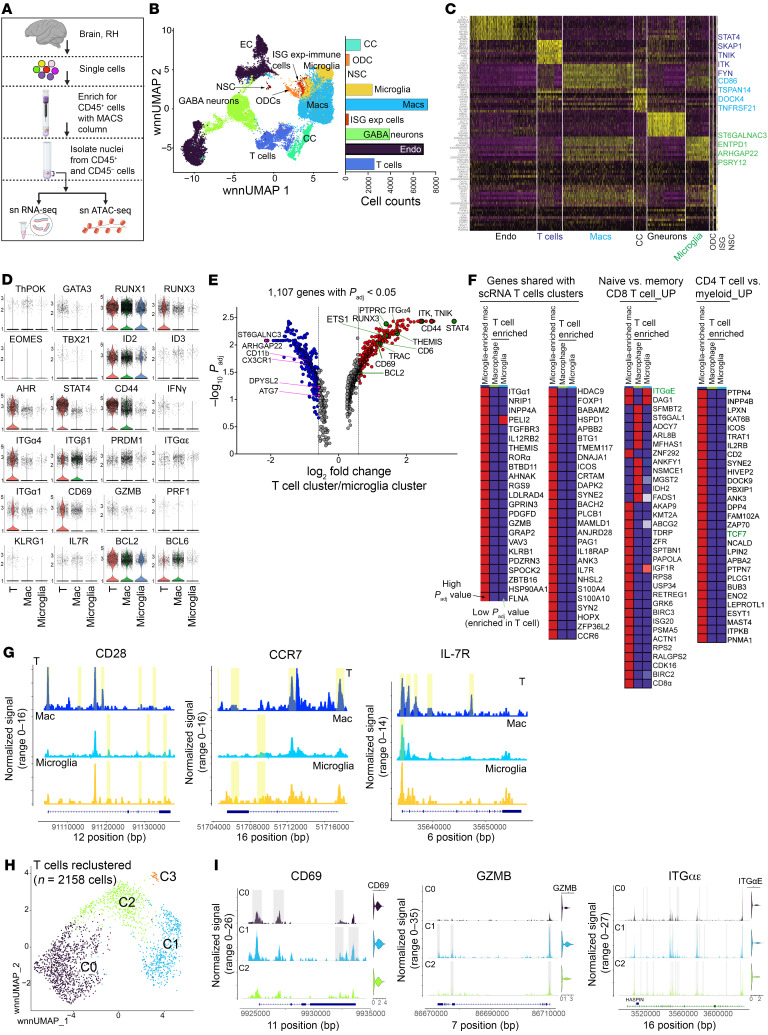
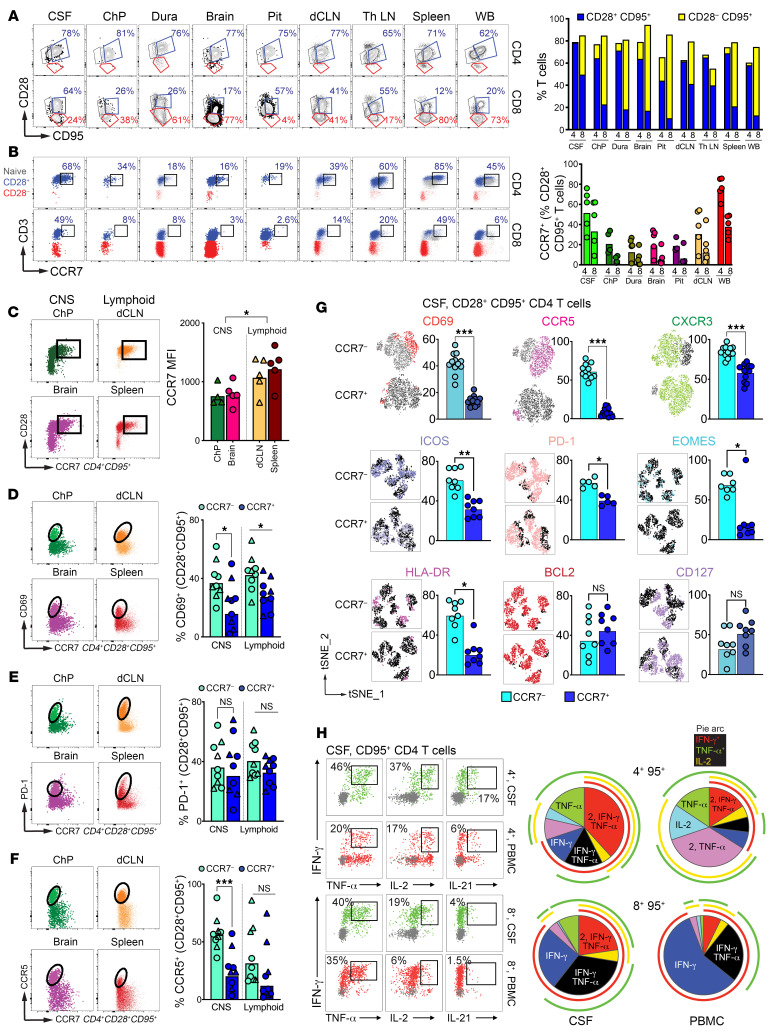
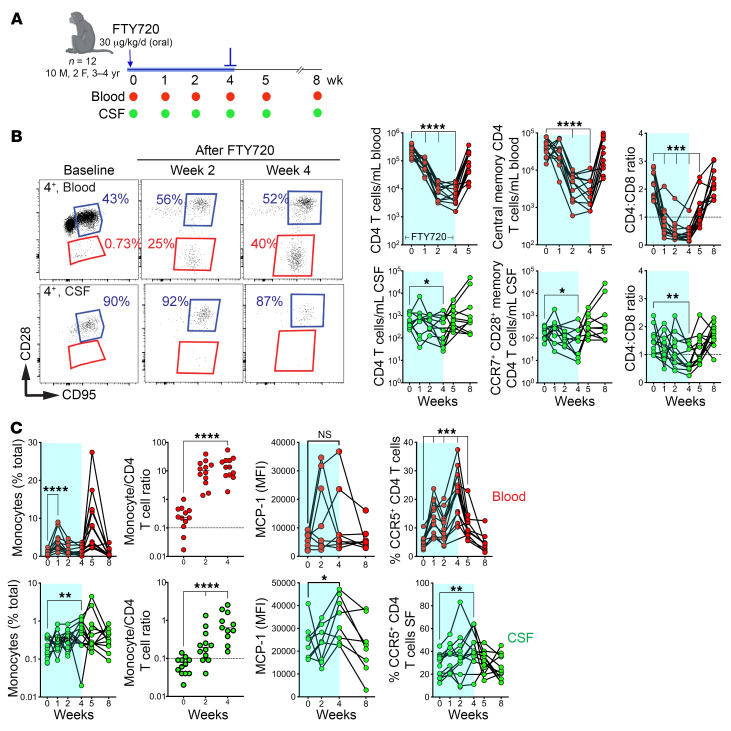
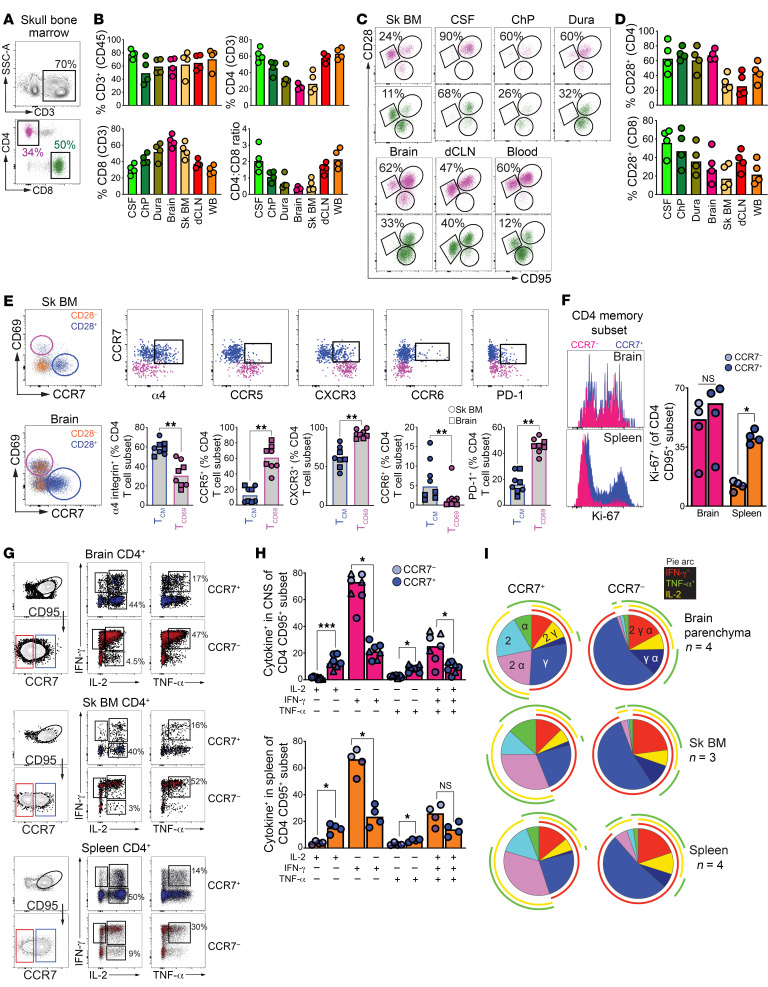
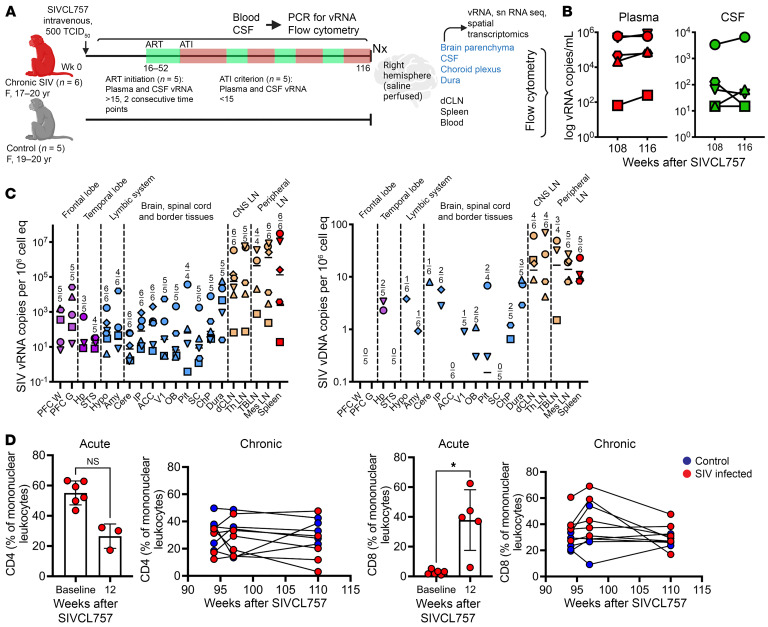
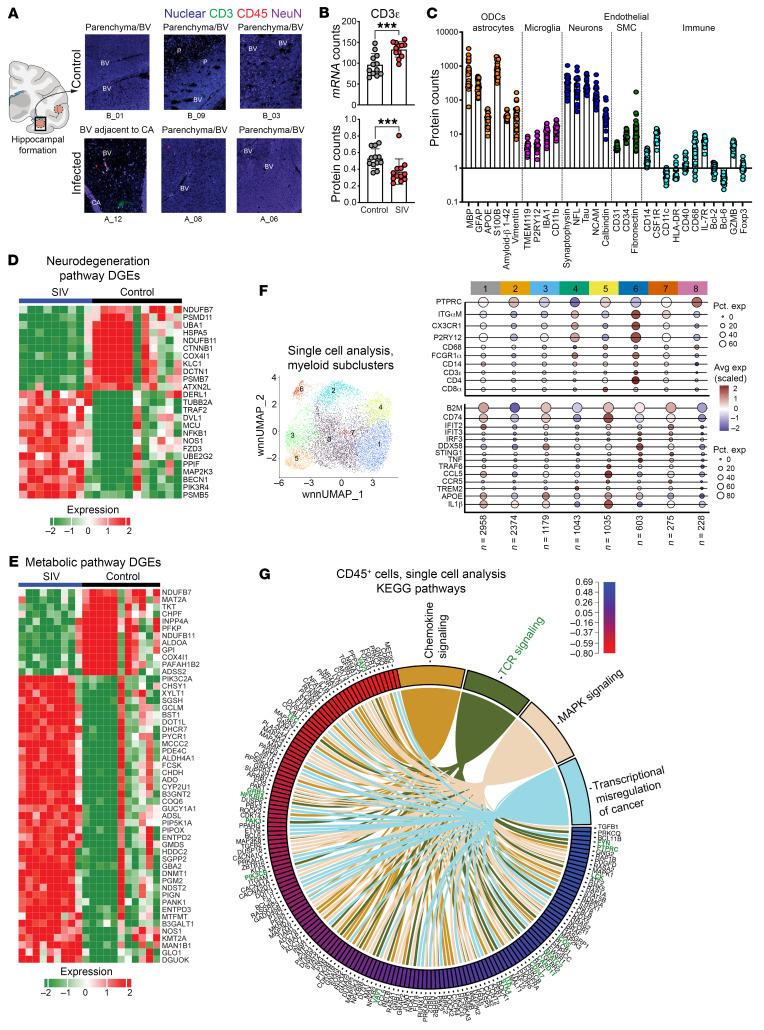
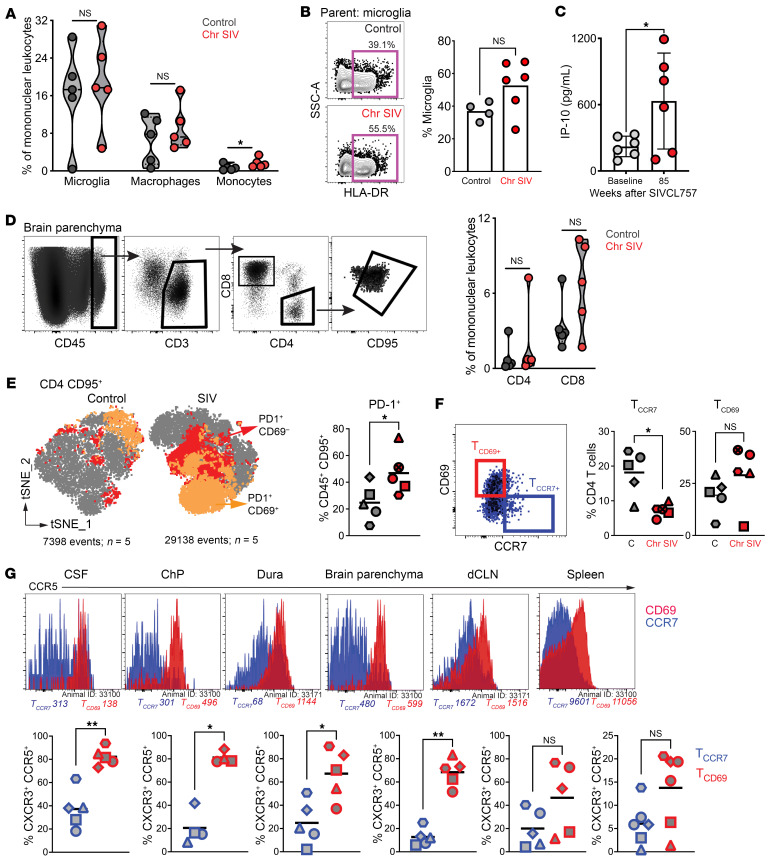
CD4+ T cells survey and maintain immune homeostasis in the brain, yet their differentiation states and functional capabilities remain unclear. Our approach, combining single-cell transcriptomic analysis, ATAC-Seq, spatial transcriptomics, and flow cytometry, revealed a distinct subset of CCR7+ CD4+ T cells resembling lymph node central memory (TCM) cells. We observed chromatin accessibility at the CCR7, CD28, and BCL-6 loci, defining molecular features of TCM. Brain CCR7+ CD4+ T cells exhibited recall proliferation and interleukin-2 production ex vivo, showcasing their functional competence. We identified the skull bone marrow as a local niche for these cells alongside CNS border tissues. Sequestering TCM cells in lymph nodes using FTY720 led to reduced CCR7+ CD4+ T cell frequencies in the cerebrospinal fluid, accompanied by increased monocyte levels and soluble markers indicating immune activation. In macaques chronically infected with SIVCL757 and experiencing viral rebound due to cessation of antiretroviral therapy, a decrease in brain CCR7+ CD4+ T cells was observed, along with increased microglial activation and initiation of neurodegenerative pathways. Our findings highlight a role for CCR7+ CD4+ T cells in CNS immune surveillance, and their decline during chronic SIV highlights their responsiveness to neuroinflammation.

Keywords: AIDS/HIV; Adaptive immunity; Inflammation; Neurological disorders; T cells.


Conflict of interest statement

Conflict of interest: The authors have declared that no conflict of interest exists.

Figures

Figure 1
Figure 1. Single-cell transcriptomic analysis of CD45+ leukocytes identifies core T cell gene signatures in the rhesus brain.
(AC) Schematic of single CD45+ cell profiling in brain, right hemisphere (RH) and spleen. (D) Differences in B and T cell transcripts in brain versus spleen. (E) UMAP of scRNA-Seq transcriptional profiles from brain and spleen identifies 10 clusters. Cell clusters are color-coded based on cell identity assigned using Single R. SkM, skeletal muscle; MBC, memory B cells; Mono, monocytes. Inset shows cell proportions in each cluster split by tissue type (bottom, spleen; top, brain). (F) UMAP shows 10 subclusters from T cell clusters in E.
Figure 2
Figure 2. T cell clusters in rhesus brain.
(AC) Select marker genes of cell clusters. Dot size represents proportion of cells expressing a gene and color designates expression level. Bar graphs represent genes significantly higher in brain relative to spleen for indicated clusters. (D) Dot plot displays link between genes and pathways from GO biological processes (GO:BO), GO molecular functions (GO:MF), and GO cellular component (GO:CC) and KEGG. (E) Chord plots show pathways and corresponding genes enriched versus underrepresented in TCM4 cell clusters.
Figure 3
Figure 3. TCM/TRM loci accessible in T cells within the brain.
(A) Schematic of snRNA analysis. (B) UMAP projection of 25,321 snRNA-Seq profiles. Dots represent individual cells, and colors indicate cluster identity (labeled on right). EC, endothelial cells; NSC, neural stem cells; CC, cancer cells; Macs, macrophages; ODC, oligodendrocyte precursor cells; ISG exp cells, interferon stimulated gene expressing cells. (C) Heat map representation of RNA-Seq of cluster-specific marker genes across all clusters. (D) Violin plots show expression of key genes across immune clusters. (E) Gene expression differences between T cell and microglial cell clusters. (F) GSEA of shared genes across sn and sc analysis. (G) Genomic regions showing snATAC-Seq tracks of chromatin accessibility of TCM genes across T cell, microglia, and macrophage immune clusters. (H) UMAP projection of 3 major T cell subclusters (2,158 T cells). (I) Genomic regions showing snATAC-Seq tracks of chromatin accessibility of TRM/EM genes across 3 major T cell clusters (C0–C2) in H.
Figure 4
Figure 4. CCR7+ CD4+ T cells in CNS share phenotypic features with TCM in blood and lymph nodes.
(A) Representative flow plots illustrate CD28 and CD95 expression on CD4+ and CD8+ T cells; frequencies of CD28+ CD95+ (blue) and CD28 CD95+ (yellow) in CD4+ T cells and CD8+ T cells. (B) Representative flow plots illustrate CCR7 expression on CD28Hi CD4+ (top row) and CD28Hi CD8+ (bottom row) T cells; frequencies of CCR7 expression on CD28Hi CD4+ and CD28Hi CD8+ T cells. (C) Representative flow plots illustrate CD28 expression and CCR7 expression on CD4+ CD95+ T cells in CNS and lymphoid tissues; CCR7 MFI of CD4+ CD95+. (DF) Representative flow plots indicating CD69, PD-1, CCR5, and CCR7 expression on CD4+ CD28+ CD95+ T cells in CNS and lymphoid tissues; frequency of CD69+, PD-1+, and CCR5+ on CD4+ CD28+ CD95+ CCR7–/+ T cells. (G) Representative tSNE plot illustrating expression of T cell markers on CD4+ CD28+ CD95+ CCR7–/+ T cells in the CSF; frequencies for each population. (H) Representative flow plots illustrating cytokine production in the CSF and PBMCs. CSF, cerebrospinal fluid; ChP, choroid plexus; Pit, pituitary; dCLN, deep cervical lymph nodes; Th LN, thoracic lymph node. WB, whole blood; PBMC, peripheral blood mononuclear cells. *P < 0.05, **P < 0.01, ***P < 0.001.
Figure 5
Figure 5. Sequestration of CD4+ TCM in lymphoid tissues reduces CCR7+ CD4+ T cell frequencies in CSF.
(A) Study schematic: n = 12 rhesus macaques (ages 3–4 years) were administered an oral dose of 30 μg/kg per day of FTY720 for the first 4 weeks of the study. CSF taps and blood draws were performed at indicated time points. (B) Representative flow plots indicating CD28 and CD95 expression on CD4+ T cells from the blood (top row) or the CSF (bottom row) (Left); CD4+ T cell counts/mL, CD4+ TCM cells and CCR7+ CD28+ memory CD4+ T cells/mL blood or CSF, and CD4-to-CD8 ratio for blood and CSF (Right). (C) Frequencies of monocytes, monocyte-to-CD4+ T cell ratio, median fluorescent intensity (MFI) of monocyte chemoattractant protein-1 (MCP-1), and CCR5 expression of CD4+ T cells in the blood and CSF over the course of the study. *P < 0.05, **P < 0.01, ***P < 0.001, ****P < 0.0001.
Figure 6
Figure 6. CCR7+ CD4+ T cells in CNS exhibit functional TCM features and reside within skull BM.
(A) Representative gating for T cells within the skull BM and (B) corresponding frequencies of CD3+, CD4+ (top), CD8+ T cells, and CD4-to-CD8 ratios (bottom) across tissue compartments. (C) Population gates for CD4+ (purple) and CD8+ (green) subsets with (D) corresponding frequencies of CD28+ subsets across tissue compartments. (E) Phenotypic characterization of TCM-like (CCR7+; blue) and CD4+ TRM (CD69+; purple) cells from brain and skull BM. (F) Ki67 MFI and frequencies on CCR7 and CCR7+ CD4+ T cells after T cell activation using anti-CD3 and anti-CD28. (GI) Representative gating for CD95+ CCR7+ CD4+ T cells and CD95+ CCR7CD4+ T cells and bar charts illustrating cytokine production after stimulating with PMA/Ionomyocin in Brain, Skull BM, and Spleen. (I) Pie Charts indicating cytokine functionality after PMA/Ionomycin treatment. (AF) Data points indicate individual tissue samples. (F) Symbols indicate skull BM (circle) or brain tissue (square) samples. Bars indicate medians. *P < 0.05, **P < 0.01, ***P < 0.001.
Figure 7
Figure 7. vRNA within frontal and temporal lobes during chronic SIV infection.
(A) Study schematic: rhesus macaques were infected with SIVCL757 intravenously and longitudinally assessed for systemic and CNS viral burden, snRNA-Seq, spatial transcriptomics, and immune responses by flow cytometry. (B) Kinetics of plasma (red) and CSF (green) viral loads during the chronic phase (week 108–116) of SIVCL757. (C) vRNA and vDNA in various brain regions, dura mater, deep cervical lymph nodes, and PBMCs. (D) CSF CD4 and CD8 frequencies during the acute phase (week 12) and chronic phase (week 92–110) of SIVCL757 infection. PFC W, prefrontal cortex white matter; PFC G, PFC gray matter; Hp; hippocampus; STS, superior temporal sulcus; Hypo, Hypothalamus; Amy, Amygdala; Cere, Cerebellum; IP, inferior/intra parietal; ACC, anterior cingulate cortex; V1, primary visual cortex; OB, olfactory bulb; Pit, pituitary; SC, spinal cord (near base of skull); ChP, choroid plexus; dCLN, deep cervical lymph node; Th LN, thoracic lymph node; TBLN, tracheobronchial lymph nodes; Mes LN, mesenteric lymph nodes. *P < 0.05.
Figure 8
Figure 8. Induction of neuroinflammatory and neurodegenerative gene programs during chronic SIV infection.
(A) Representative illustration for ROI selection within the hippocampal region of control (top) and SIVCL757-infected (bottom) animals; Nuclear (blue), CD3 (green), CD45 (red), and NeuN (purple) for Nanostring whole transcriptome analysis (WTA) and proteomics pipeline. (B) CD3ε mRNA and protein counts for ROIs. (C) Protein counts for all ROIs. (D) Differentially expressed neurodegenerative genes across control and SIV-infected ROIs. (E) Differentially expressed metabolic genes across control and SIV-infected ROIs. (F) UMAP plot shows cell annotation for myeloid specific gene clusters from sc data. Dot plots depict average gene expression of canonical microglia, monocyte, macrophage, antiviral, and inflammatory response genes across 8 distinct myeloid clusters. (G) Chord plot of differentially expressed genes across control and SIV-infected CD45-enriched cells from sc transcriptomics. Genes related to TCR signaling pathway are colored in green for clarity. ***P < 0.001.
Figure 9
Figure 9. CCR7+ CD4+ T cell frequencies decreased during SIV-induced neuroinflammation.
(A) Frequencies of myeloid (microglia, macrophage, and monocytes) within the control (black) and chronically infected SIV brain (red). (B) Representative flow plot illustrating HLA-DR expression on microglia cells (left); Frequency of HLA-DR expression (right). (C) IP-10 concentration within the rhesus CSF between baseline (grey) and chronic SIV CL757 infection (red; week 85). (D) Representative flow plots show CD4+ and CD8+ T cells in brain (left) and scatter plot shows frequencies (right). (E) t-SNE plot shows distribution of PD-1+ cells control and SIV brain (left) and scatter plot shows significantly higher PD-1+ frequencies with chronic SIV (right). (F) Representative flow plots depict gating strategy for TCD69+(red gate) and TCCR7+ (blue gate) populations (left); Frequencies of CCR7+ and CD69+ T cell populations (right) in the control (grey) and chronic SIV CL757 (red) infected brain. (G) Histogram plots indicating CCR5 expression and MFI (top) on TCCR7 (blue) and TCD69 (red); Frequencies of CXCR3+ CCR5+ within TCCR7 and TCD69 across the CSF, Choroid plexus (ChP), Dura, Brain Parenchyma, deep cervical lymph node (dCLN) and spleen. *P < 0.05, **P < 0.01.

Update of

References

    1. Schenkel JM, Masopust D. Tissue-resident memory T cells. Immunity. 2014;41(6):886–897. doi: 10.1016/j.immuni.2014.12.007. - DOI - PMC - PubMed
    1. Ransohoff RM, et al. Three or more routes for leukocyte migration into the central nervous system. Nat Rev Immunol. 2003;3(7):569–581. doi: 10.1038/nri1130. - DOI - PubMed
    1. de Graaf MT, et al. Central memory CD4+ T cells dominate the normal cerebrospinal fluid. Cytometry B Clin Cytom. 2011;80(1):43–50. doi: 10.1002/cyto.b.20542. - DOI - PubMed
    1. Kivisakk P, et al. Human cerebrospinal fluid central memory CD4+ T cells: evidence for trafficking through choroid plexus and meninges via P-selectin. Proc Natl Acad Sci U S A. 2003;100(14):8389–8394. doi: 10.1073/pnas.1433000100. - DOI - PMC - PubMed
    1. Smolders J, et al. Tissue-resident memory T cells populate the human brain. Nat Commun. 2018;9(1):4593. doi: 10.1038/s41467-018-07053-9. - DOI - PMC - PubMed

Publication types

MeSH terms

Substances