. 2024 Mar 12;9(8):e175623.
doi: 10.1172/jci.insight.175623.

P2Y13 receptor deficiency favors adipose tissue lipolysis and worsens insulin resistance and fatty liver disease

Affiliations

P2Y13 receptor deficiency favors adipose tissue lipolysis and worsens insulin resistance and fatty liver disease

Thibaut Duparc et al. JCI Insight. .

Abstract

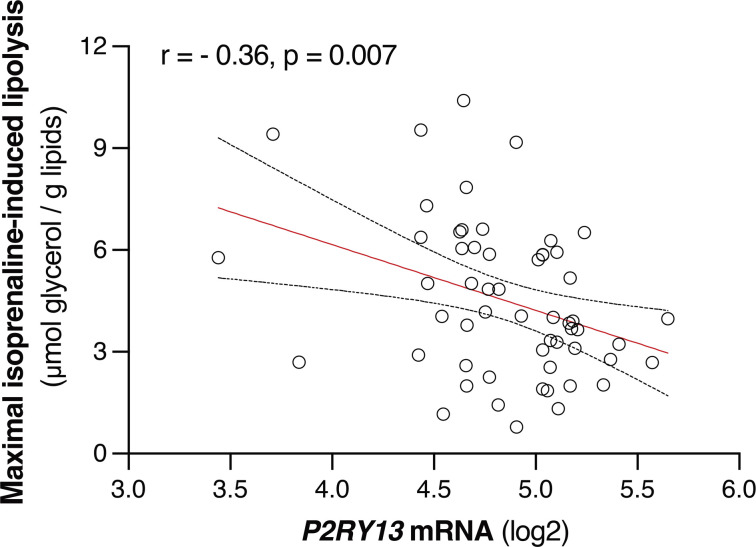
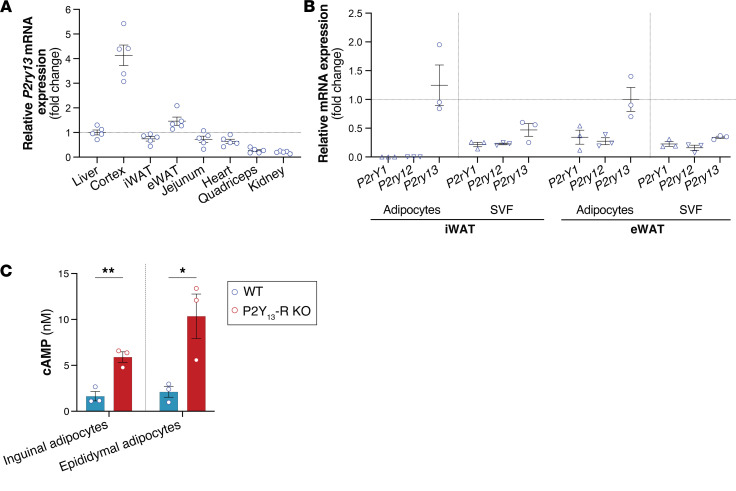
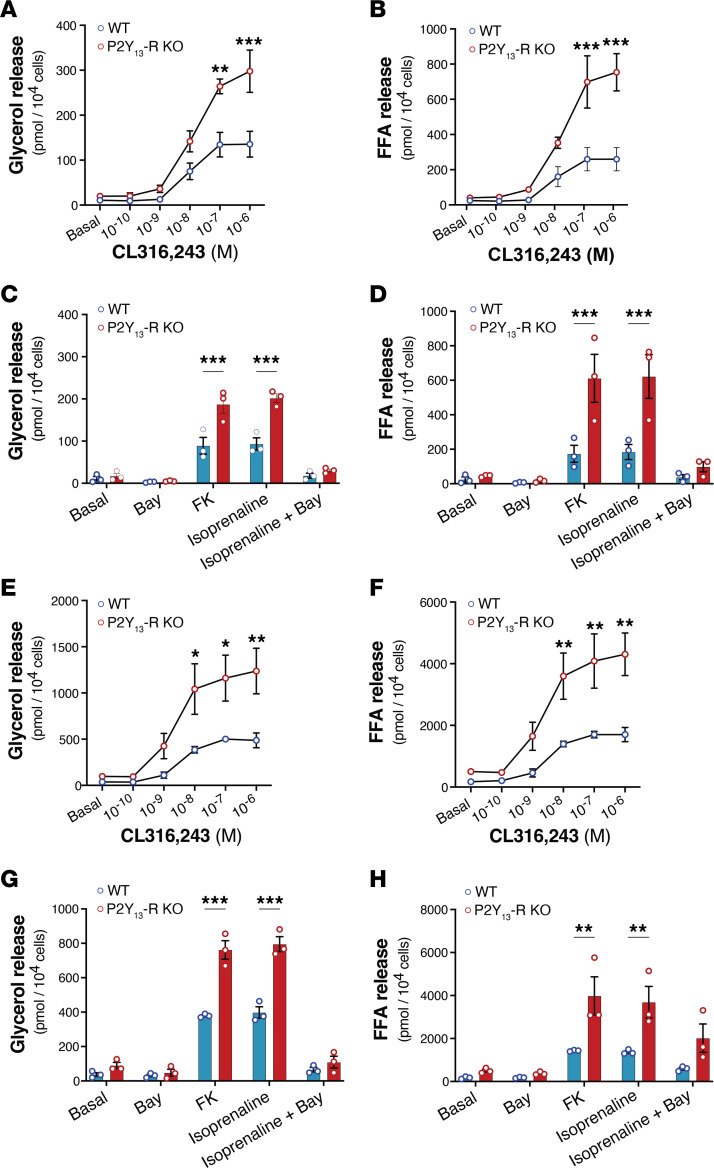
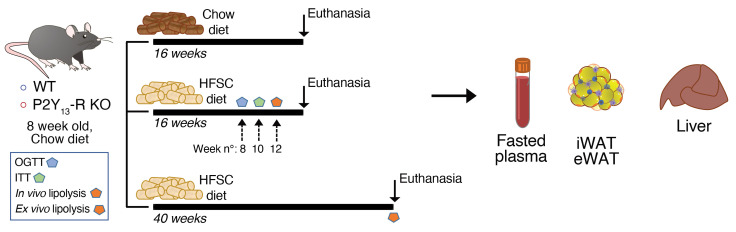
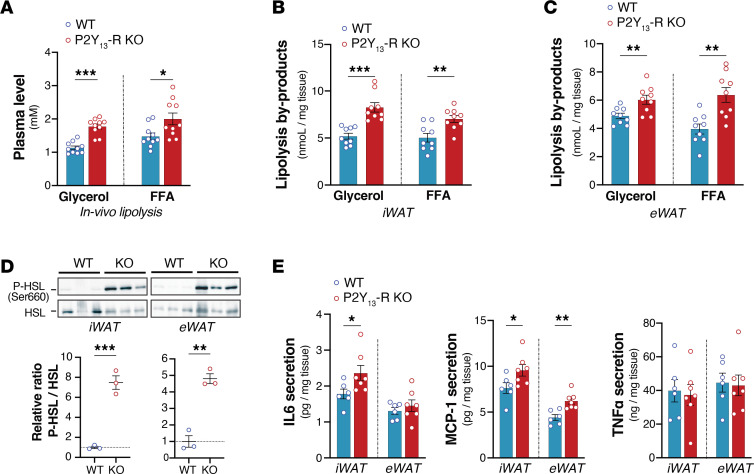
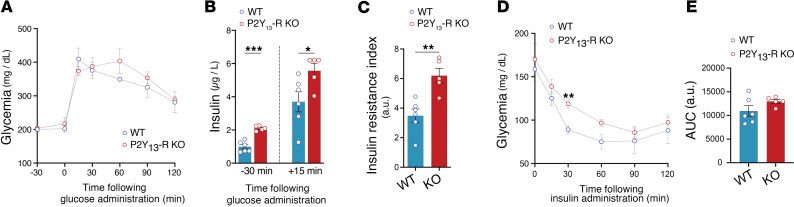
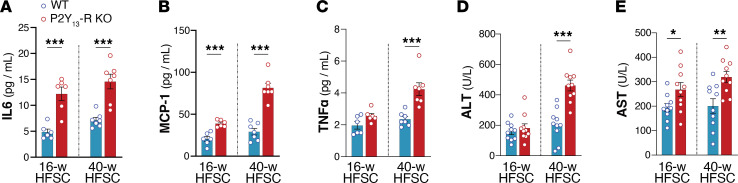
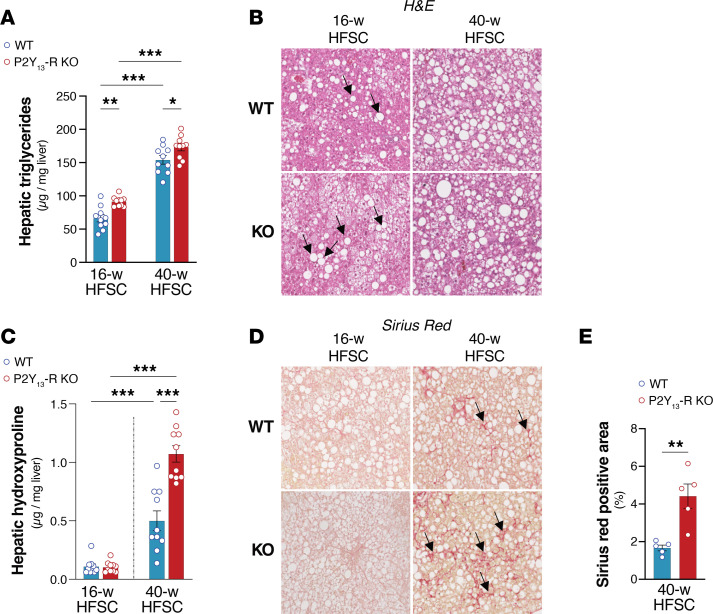
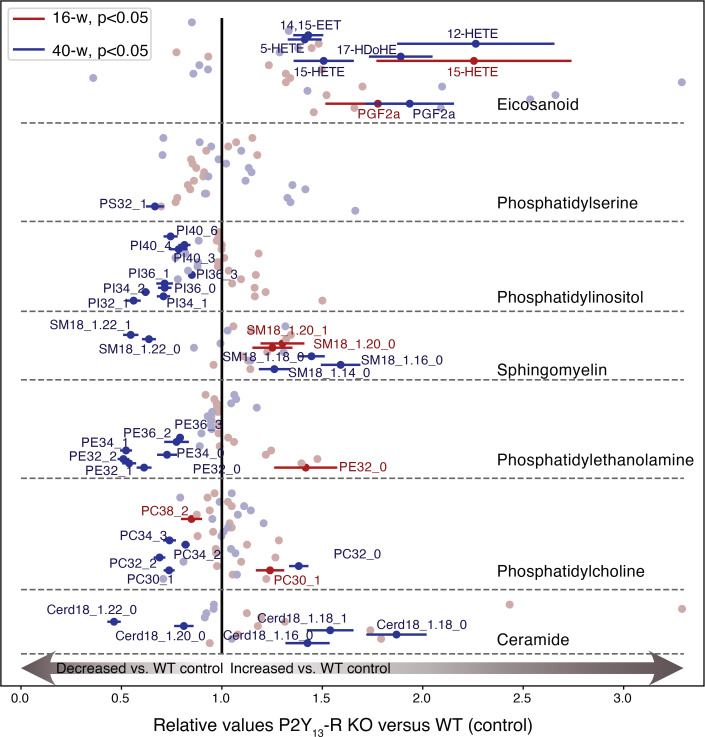
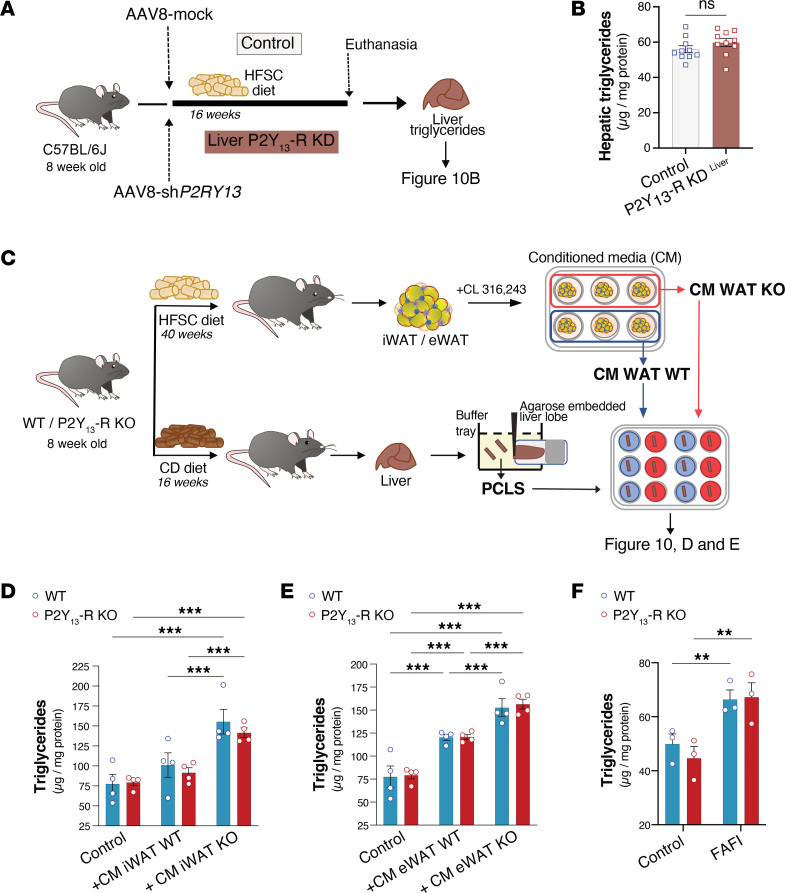
Excessive lipolysis in white adipose tissue (WAT) leads to insulin resistance (IR) and ectopic fat accumulation in insulin-sensitive tissues. However, the impact of Gi-coupled receptors in restraining adipocyte lipolysis through inhibition of cAMP production remained poorly elucidated. Given that the Gi-coupled P2Y13 receptor (P2Y13-R) is a purinergic receptor expressed in WAT, we investigated its role in adipocyte lipolysis and its effect on IR and metabolic dysfunction-associated steatotic liver disease (MASLD). In humans, mRNA expression of P2Y13-R in WAT was negatively correlated to adipocyte lipolysis. In mice, adipocytes lacking P2Y13-R displayed higher intracellular cAMP levels, indicating impaired Gi signaling. Consistently, the absence of P2Y13-R was linked to increased lipolysis in adipocytes and WAT explants via hormone-sensitive lipase activation. Metabolic studies indicated that mice lacking P2Y13-R showed a greater susceptibility to diet-induced IR, systemic inflammation, and MASLD compared with their wild-type counterparts. Assays conducted on precision-cut liver slices exposed to WAT conditioned medium and on liver-specific P2Y13-R-knockdown mice suggested that P2Y13-R activity in WAT protects from hepatic steatosis, independently of liver P2Y13-R expression. In conclusion, our findings support the idea that targeting adipose P2Y13-R activity may represent a pharmacological strategy to prevent obesity-associated disorders, including type 2 diabetes and MASLD.

Keywords: Adipose tissue; G protein–coupled receptors; Glucose metabolism; Hepatology; Metabolism.


Figures

Figure 1
Figure 1. Relationships between P2RY13 gene expression and lipolysis measures in human subcutaneous WAT samples.
The scatterplot represents simple linear regression analysis, and the results are expressed as r (correlation coefficient) tested by Pearson correlation coefficient analysis (n = 56). WAT, white adipose tissue.
Figure 2
Figure 2. P2ry13 gene expression and P2Y13-R activity in mouse primary adipocytes.
(A) Relative mRNA expression levels of P2ry13 in mouse tissue (n = 5 mice). (B) Relative mRNA expression levels of ADP purinergic receptors (P2ry1, P2ry12, and P2ry13) in primary adipocytes and SVF from iWAT and eWAT (n = 3 mice). (C) cAMP level in primary inguinal or epididymal adipocytes isolated from WT (control) and P2Y13-R–KO mice (n = 3 mice per group). Open blue and red circles represent WT and P2Y13-R–KO mice, respectively. mRNA expression data were normalized relative to the expression of Rps29. All data are expressed as mean ± SEM. *P < 0.05, **P < 0.01 (C, 2-tailed unpaired Student’s t test was used for genotype comparison). All results were obtained from 24-month-old mice fed a chow diet. eWAT, epididymal white adipose tissue; iWAT, inguinal white adipose tissue; KO, knockout; Rps29, ribosomal protein S29; SVF, stromal vascular fraction; WT, wild-type.
Figure 3
Figure 3. Lack of P2Y13-R in mouse primary adipocytes increases lipolysis.
(A) Glycerol and (B) FFA release in culture media of adipocytes isolated from iWAT under basal condition or following stimulation with CL316,243 10–10 to 10–6 M (n = 3 mice per group). (C) Glycerol and (D) FFA release in culture me dia of adipocytes isolated from iWAT under basal condition or following stimulation with 10–6 M forskolin or 10–6 M isoprenaline (n = 3 mice per group). (E) Glycerol and (F) FFA release in culture media of adipocytes isolated from eWAT under basal condition or following stimulation with CL316,243 10–10 to 10–6 M (n = 3 mice per group). (G) Glycerol and (H) FFA release in culture media of adipocytes isolated from eWAT under basal condition or following stimulation with 10–6 M forskolin or 10–6 M isoprenaline (n = 3 mice per group). The experiments included a group treated with BAY 59-9435 (BAY), a potent and selective pharmacological inhibitor of hormone-sensitive lipase (n = 3 mice per group). Open blue and red circles represent WT and P2Y13-R–KO mice, respectively. All data are expressed as mean ± SEM. *P < 0.05, **P < 0.01, ***P < 0.001 (AH, 2-way ANOVA followed by Bonferroni’s post hoc test was used for genotype comparison). All results were obtained from 24-month-old mice fed a chow diet. eWAT, epididymal white adipose tissue; FFA, free fatty acids; FK, forskolin; iWAT, inguinal white adipose tissue; KO, knockout; WT, wild-type.
Figure 4
Figure 4. Experimental study design of metabolic studies in P2Y13-R–KO and WT (control) mice.
eWAT, epididymal white adipose tissue; OGTT, oral glucose tolerance test; HFSC, high-fat high-sucrose high-cholesterol; ITT, insulin tolerance test; iWAT, inguinal white adipose tissue; KO, knockout; WT, wild-type.
Figure 5
Figure 5. In vivo and ex vivo lipolytic activities of adipose tissues are increased in HFSC diet–fed P2Y13-R–KO mice.
(A) Glycerol and FFA plasma levels from mice after being stimulated by CL316,243 (1 mg/kg body weight) for 15 minutes (n = 10 mice per group). (B) Glycerol and FFA release in supernatant of iWAT explants after being stimulated by 10–6 M CL316,243 (n = 9 mice per group). (C) Glycerol and FFA release in supernatant of eWAT explants after being stimulated by 10–6 M CL316,243 (n = 9 mice per group). (D) Western blot analysis and quantification of immunoblotting data of hormone-sensitive lipase phosphorylation at Ser660 (P-HSL) in iWAT and eWAT explants isolated from mice and stimulated with 10–6 M CL316,243 (n = 3 mice per group). (E) Concentrations of IL-6, MCP-1, and TNF-α in supernatant of iWAT and eWAT explants from HFSC diet–fed mice (n = 6 or 7 mice per group). Open blue and red circles represent WT and P2Y13-R–KO mice, respectively. All data are expressed as mean ± SEM. *P < 0.05, **P < 0.01, ***P < 0.001 (AE, 2-tailed unpaired Student’s t test was used for genotype comparison). Results were obtained from mice fed HFSC for 12 weeks (A) or 40 weeks (BE). eWAT, epididymal white adipose tissue; FFA, free fatty acids; HFSC, high-fat high-sucrose high-cholesterol; IL-6, interleukin-6; iWAT, inguinal white adipose tissue; KO, knockout; MCP-1, monocyte chemoattractant protein-1; TNF-α, tumor necrosis factor-α; WT, wild-type.
Figure 6
Figure 6. Glucose metabolism is altered by P2Y13-R deletion in mice fed an HFSC diet.
(A) OGTT, 3 g/kg glucose (n = 5 or 6 mice per group). (B) OGTT-associated basal and glucose-stimulated insulinemia values in overnight-fasted mice (n = 5 or 6 mice per group). (C) Insulin resistance index based on OGTT-associated blood glucose and insulin values (n = 5 or 6 mice per group). (D) ITT, 1 U/kg insulin (n = 5 or 6 mice per group). (E) AUC for D (n = 5 or 6 mice per group). Open blue and red circles represent WT and P2Y13-R–KO mice, respectively. All data are expressed as mean ± SEM. *P < 0.05, **P < 0.01, ***P < 0.001 (A and D, 2-way ANOVA followed by Bonferroni’s post hoc test was used for genotype comparison; B, C, and E, 2-tailed unpaired Student’s t test was used for genotype comparison). Results were obtained from mice fed an HFSC diet for 8 weeks (AC) and 10 weeks (D and E). OGTT, oral glucose tolerance test; HFSC, high-fat high-sucrose high-cholesterol; ITT, insulin tolerance test; KO, knockout; WT, wild-type.
Figure 7
Figure 7. Lack of P2Y13-R increases systemic inflammation and plasma transaminases.
(A) Plasma concentrations of IL-6 (n = 6 or 7 mice per group). (B) Plasma concentrations of MCP-1 (n = 6 or 7 mice per group). (C) Plasma concentrations of TNF-α (n = 6 or 7 mice per group). (D) Plasma concentrations of ALT (n = 10 mice per group). (E) Plasma concentrations of AST (n = 10 mice per group). Open blue and red circles represent WT and P2Y13-R–KO mice, respectively. All data are expressed as mean ± SEM. *P < 0.05, **P < 0.01, ***P < 0.001 (AE, 2-tailed unpaired Student’s t test was used for genotype comparison). Results were obtained from mice fed an HFSC diet for 16 weeks (16-w) or 40 weeks (40-w). ALT, alanine aminotransferase; AST, aspartate aminotransferase; HFSC, high-fat high-sucrose high-cholesterol; IL-6, interleukin-6; KO, knockout; MCP-1, monocyte chemoattractant protein-1; TNF-α, tumor necrosis factor-α; WT, wild-type.
Figure 8
Figure 8. Lack of P2Y13-R promotes steatosis and aggravates liver fibrosis.
(A) Hepatic concentrations of TG (n = 10 mice per group). (B) Representative H&E staining of liver sections (original magnification, 20×). Arrows indicate lipid droplets. (C) Hepatic concentrations of hydroxyproline (HYP) (n = 10 mice per group). (D) Representative Sirius red (SR) staining of liver sections (original magnification, 20×). Arrows indicate collagen fibers. (E) Quantification of SR-positive area in liver sections from D (n = 5 mice per group). Open blue and red circles represent WT and P2Y13-R–KO mice, respectively. All data are expressed as mean ± SEM. *P < 0.05, **P < 0.01, ***P < 0.001 (A and C, 1-way ANOVA followed by Bonferroni’s post hoc test was used for group comparison; E, 2-tailed unpaired Student’s t test was used for genotype comparison). Results were obtained from mice fed an HFSC diet for 16 weeks (16-w) or 40 weeks (40-w). HFSC, high-fat high-sucrose high-cholesterol; KO, knockout; TG, triglyceride; WT, wild-type.
Figure 9
Figure 9. Lack of P2Y13-R impacts liver lipidome after 16 and 40 weeks of HFSC diet.
A comparative analysis of the effects of 16 weeks (16-w) and 40 weeks (40-w) of HFSC diet in WT and P2Y13-R–KO mice was conducted regarding phospholipids and eicosanoids. Data are presented as the mean of the P2Y13-R–KO relative values to WT ± SEM. There were at least 5 mice per group at 16 weeks and 4 mice per group at 40 weeks. The significant results are labeled and color-coded depending on the duration of the diet. HETE, hydroxyeicosatetraenoic acid; HFSC, high-fat high-sucrose high-cholesterol; KO, knockout; PI, phosphatidylinositol; PE, phosphatidylethanolamine; PC, phosphatidylcholine; SM, sphingomyelin; WT, wild-type.
Figure 10
Figure 10. Increased liver steatosis associated with the lack of P2Y13-R depends on adipose tissue lipolysis.
(A) Experimental design of liver-specific P2Y13-R–KD (P2Y13-R–KDliver) and control mice. (B) Hepatic TG concentration from P2Y13-R–KDliver and control mice fed HFSC diet for 16 weeks (n = 10 mice per group). (C) Study design for precision-cut liver slice (PCLS) experiments. (D and E) TG concentrations in liver slices from chow diet–fed WT and P2Y13-R–KO mice in control condition or after 48 hours’ treatment with conditioned media originating from CL316,243-stimulated iWAT or eWAT explants originating from WT or P2Y13-R–KO mice that were HFSC fed for 40 weeks (n = 4 mice per group). (F) TG concentrations in liver slices from chow diet–fed WT and P2Y13-R–KO mice after 48 hours of treatment with FAFI media containing oleic acid, palmitic acid, insulin, and fructose. Open blue and red circles represent PCLS from WT and P2Y13-R–KO mice, respectively (n = 3 mice per group). All data are expressed as mean ± SEM. **P < 0.01, ***P < 0.001 (B, 2-tailed unpaired Student’s t test was used for genotype comparison; DF, 2-way ANOVA followed by Bonferroni’s post hoc test was used for group comparison). CM, conditioned media; eWAT, epididymal white adipose tissue; FAFI, fatty acids, fructose and insulin; HFSC, high-fat high-sucrose high-cholesterol; iWAT, inguinal white adipose tissue; KD, knockdown; KO, knockout; ns, nonsignificant; TG, triglyceride; WT, wild-type.

References

    1. Lafontan M, Langin D. Lipolysis and lipid mobilization in human adipose tissue. Prog Lipid Res. 2009;48(5):275–297. doi: 10.1016/j.plipres.2009.05.001. - DOI - PubMed
    1. Morigny P, et al. Adipocyte lipolysis and insulin resistance. Biochimie. 2016;125:259–266. doi: 10.1016/j.biochi.2015.10.024. - DOI - PubMed
    1. Morigny P, et al. Lipid and glucose metabolism in white adipocytes: pathways, dysfunction and therapeutics. Nat Rev Endocrinol. 2021;17(5):276–295. doi: 10.1038/s41574-021-00471-8. - DOI - PubMed
    1. Rinella ME, et al. A multisociety Delphi consensus statement on new fatty liver disease nomenclature. Ann Hepatol. 2024;29(1):101133. doi: 10.1016/j.aohep.2023.101133. - DOI - PubMed
    1. Tanaka N, et al. Role of white adipose lipolysis in the development of NASH induced by methionine- and choline-deficient diet. Biochim Biophys Acta. 2014;1841(11):1596–1607. doi: 10.1016/j.bbalip.2014.08.015. - DOI - PMC - PubMed

Publication types

MeSH terms