

Cell-free DNA Concentration as a Biomarker of Response and Recurrence in HER2-Negative Breast Cancer Receiving Neoadjuvant Chemotherapy
- PMID: 38470545
- PMCID: PMC11147708
- DOI: 10.1158/1078-0432.CCR-23-2928
Cell-free DNA Concentration as a Biomarker of Response and Recurrence in HER2-Negative Breast Cancer Receiving Neoadjuvant Chemotherapy
Abstract
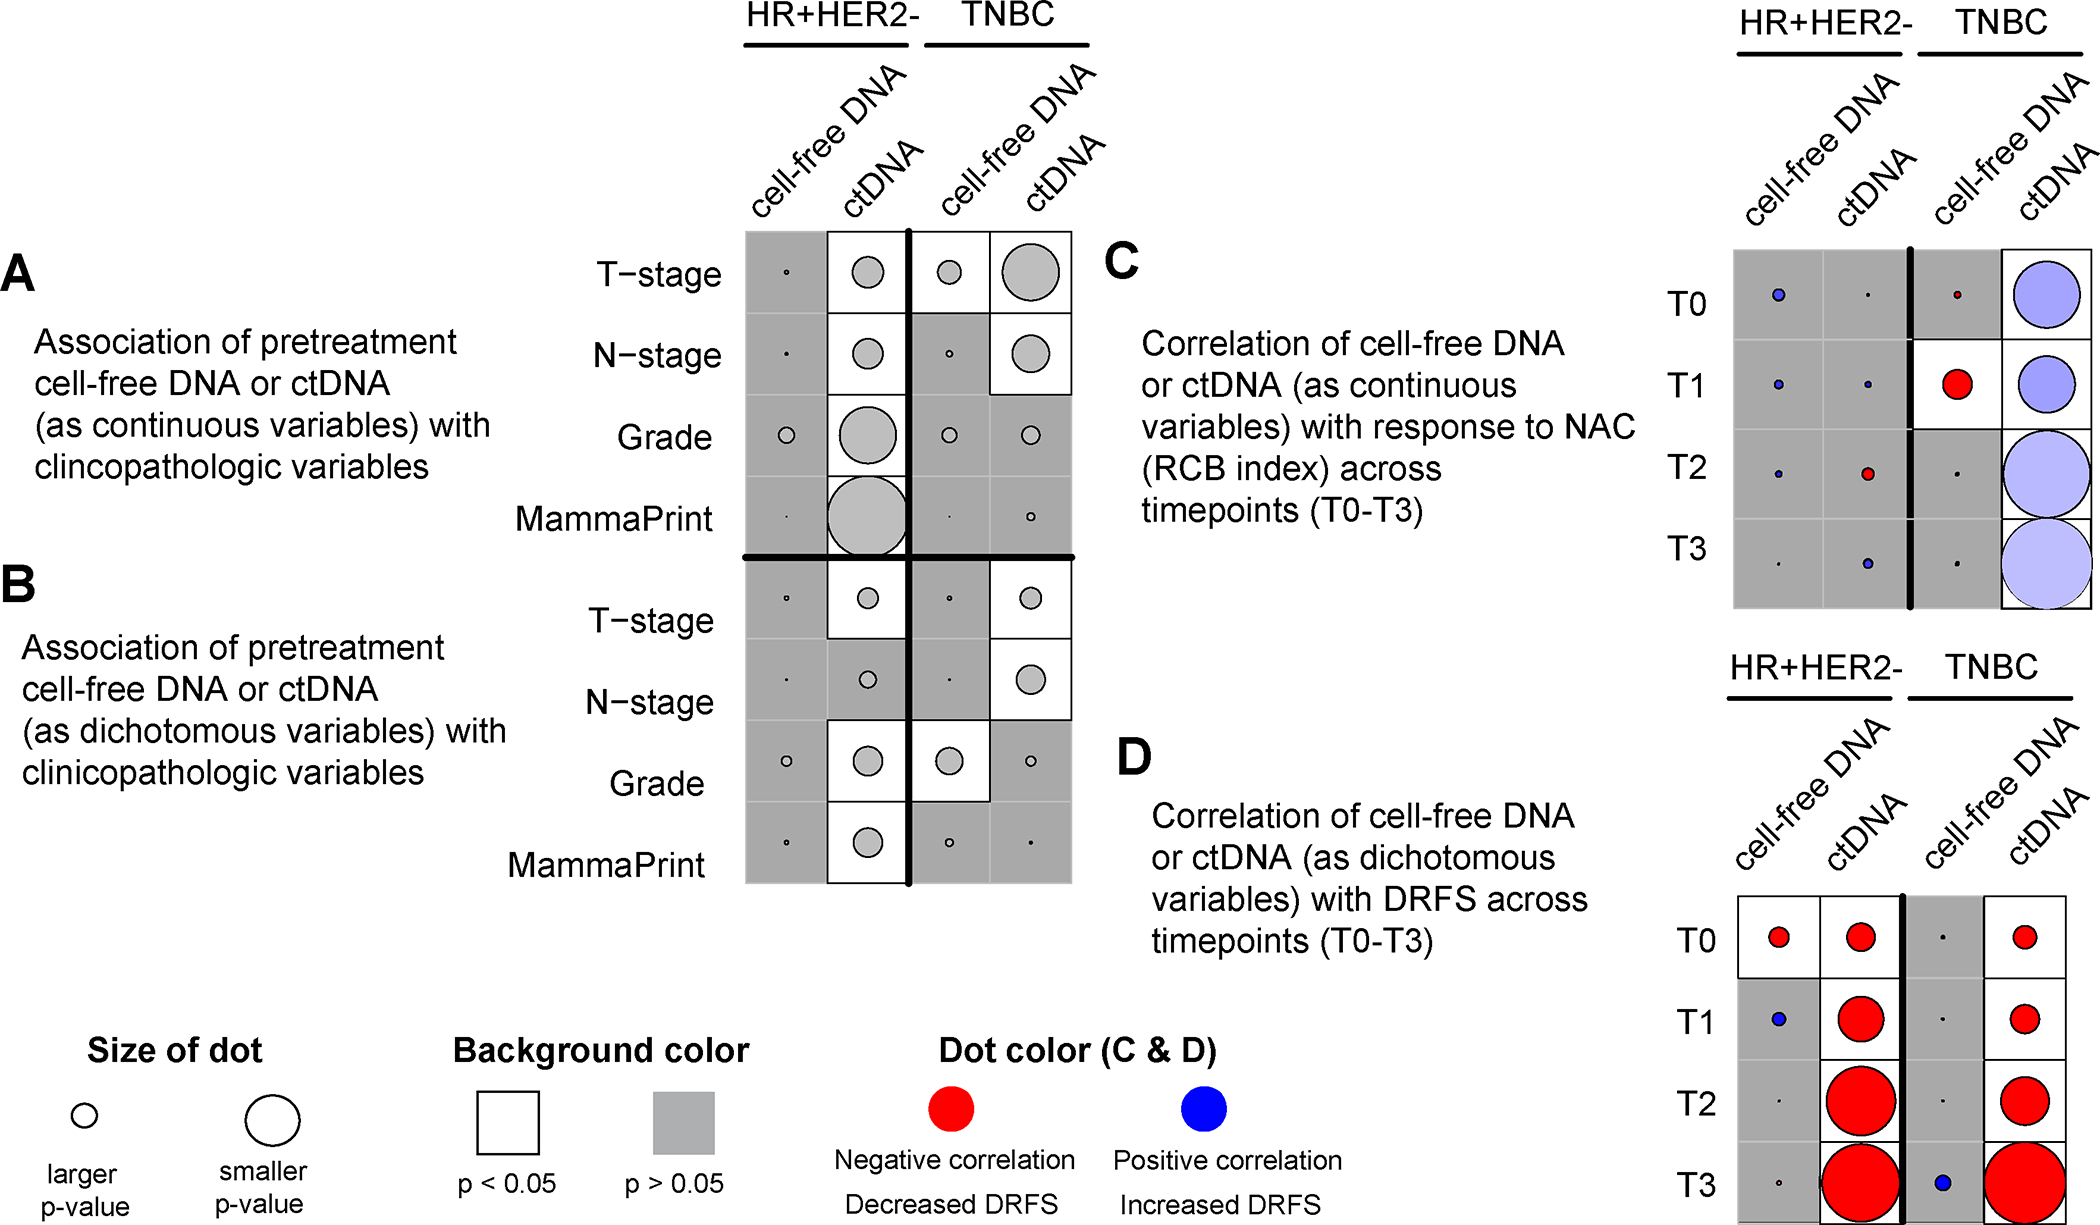
Purpose: We previously demonstrated the clinical significance of circulating tumor DNA (ctDNA) in patients with HER2-negative breast cancer receiving neoadjuvant chemotherapy (NAC). Here, we compared its predictive and prognostic value with cell-free DNA (cfDNA) concentration measured in the same samples from the same patients.
Experimental design: 145 patients with hormone receptor (HR)-positive/HER2-negative and 138 triple-negative breast cancer (TNBC) with ctDNA data from a previous study were included in the analysis. Associations of serial cfDNA concentration with residual cancer burden (RCB) and distant recurrence-free survival (DRFS) were examined.
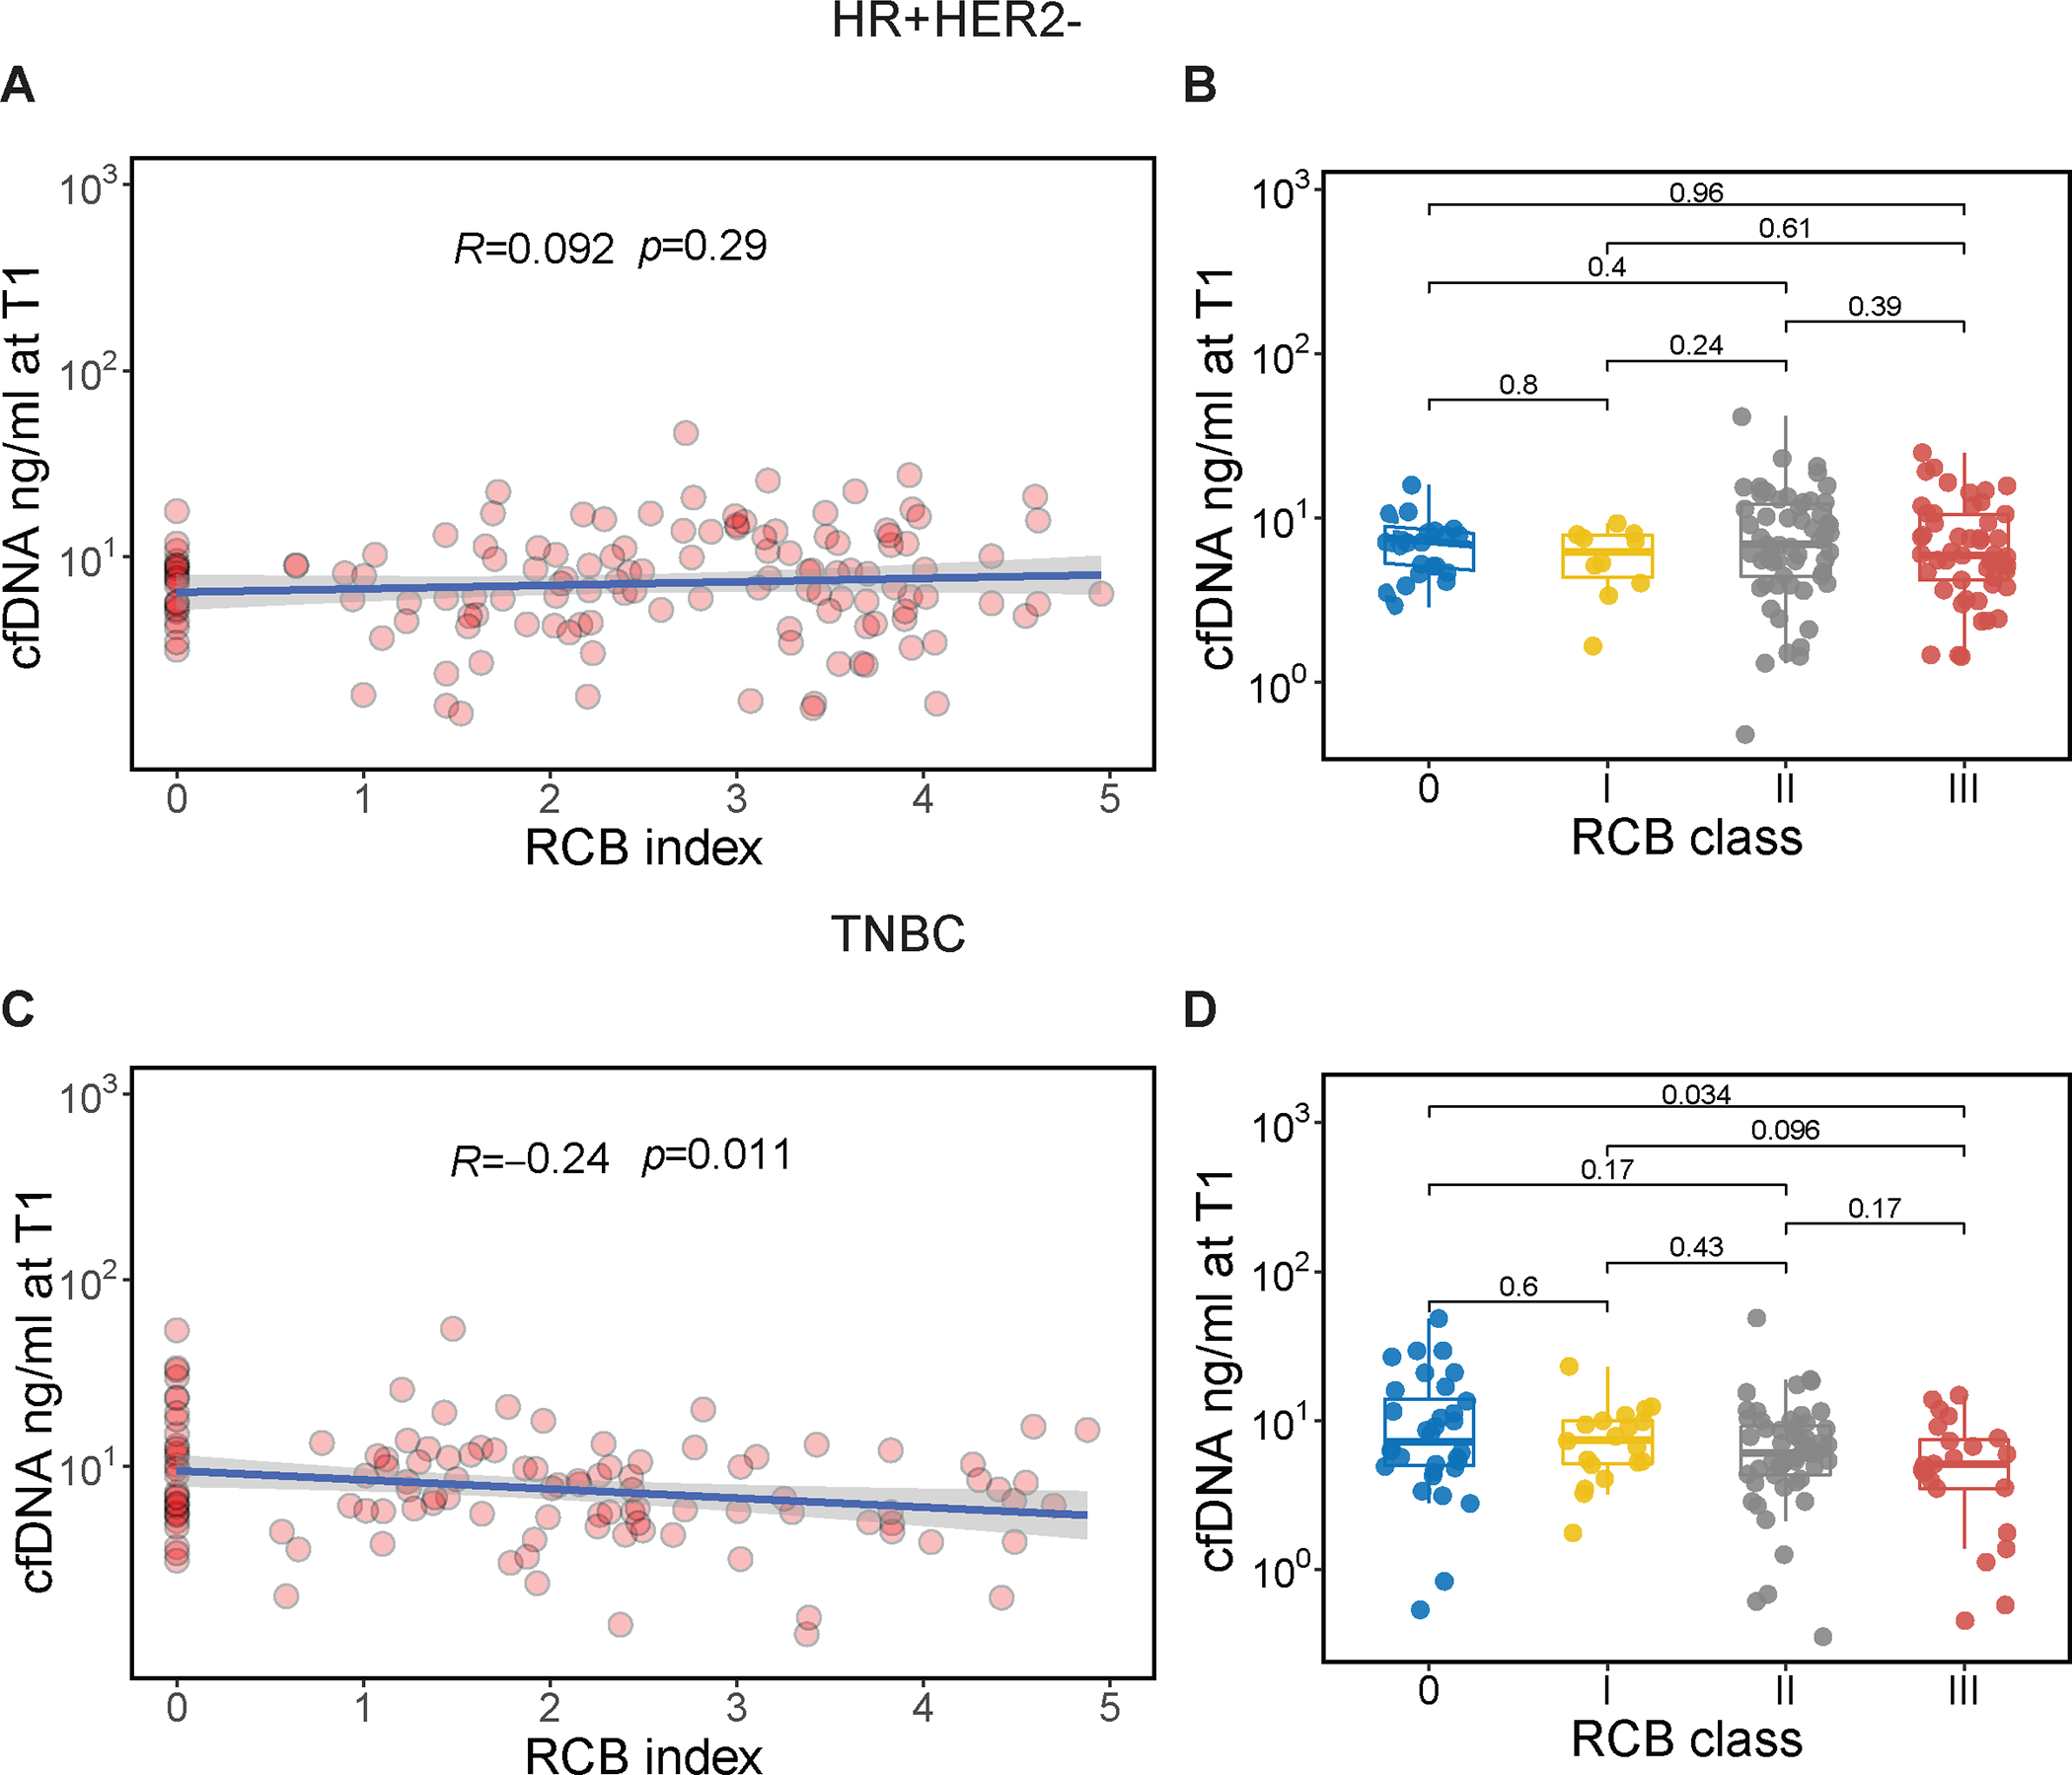
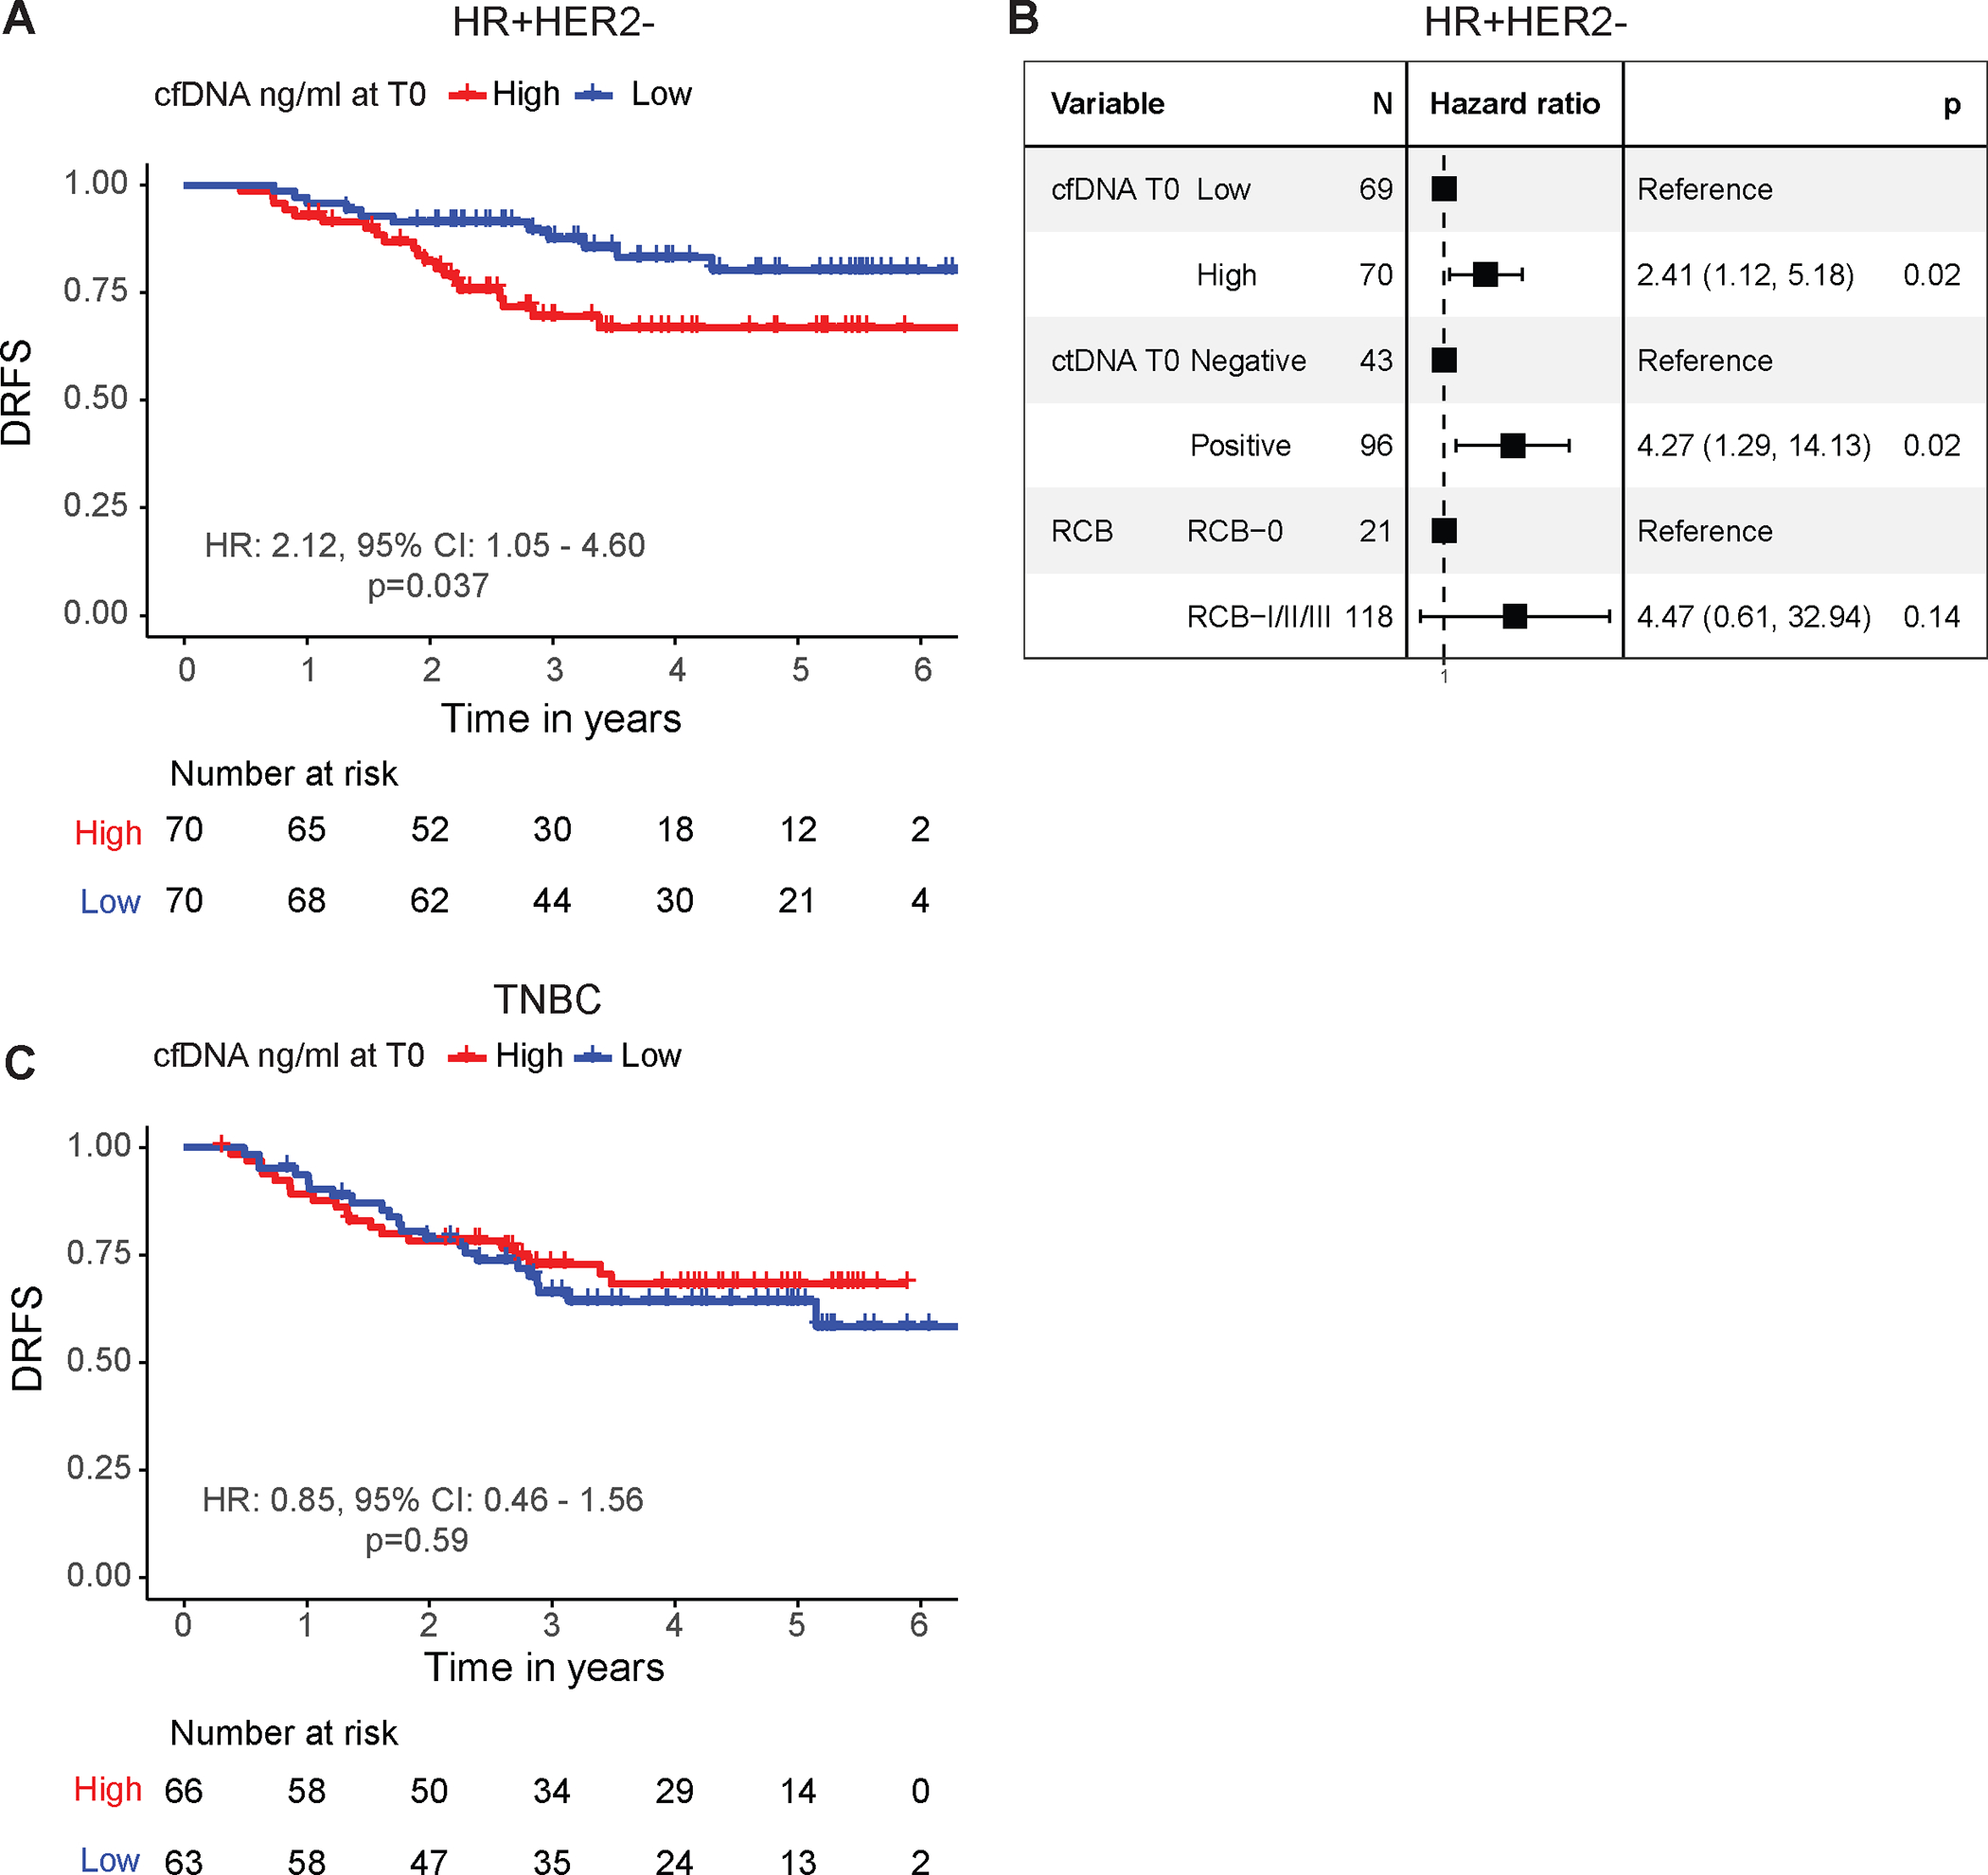
Results: In TNBC, we observed a modest negative correlation between cfDNA concentration 3 weeks after treatment initiation and RCB, but none of the other timepoints showed significant correlation. In contrast, ctDNA was significantly positively correlated with RCB at all timepoints (all R > 0.3 and P < 0.05). In the HR-positive/HER2-negative group, cfDNA concentration did not associate with response to NAC, but survival analysis showed that high cfDNA shedders at pretreatment had a significantly worse DRFS than low shedders (hazard ratio, 2.12; P = 0.037). In TNBC, the difference in survival between high versus low cfDNA shedders at all timepoints was not statistically significant. In contrast, as previously reported, ctDNA at all timepoints was significantly correlated with DRFS in both subtypes.
Conclusions: In TNBC, cfDNA concentrations during therapy were not strongly correlated with response or prognosis. In the HR-positive/HER2-negative group, pretreatment cfDNA concentration was prognostic for DRFS. Overall, the predictive and prognostic value of cfDNA concentration was more limited than that of ctDNA.
©2024 American Association for Cancer Research.
Conflict of interest statement
GLH reports grants from National Institutes of Health during the conduct of the study. CY reports grants from National Institutes of Health/National Cancer Institute; support from Quantum Leap Healthcare Collaborative during the conduct of the study; and has a patent pending for US Application No. 18/174,191. PRP reports personal fees from Frontiers and Pfizer; grants from Pfizer, Carisma Therapeutics and Orum Therapeutics outside the submitted work; and other support from Seagen. WFS reports a patent for Method to measure residual cancer burden after neoadjuvant chemotherapy issued and licensed to Delphi Diagnostics and a patent for Method to predict sensitivity to endocrine therapy of breast cancer issued and licensed to Delphi Diagnostics. DY reports support from Quantum Leap Health Care Collaborative during the conduct of the study. NMH reports grants from National Institutes of Health during the conduct of the study. LJE reports grants from Quantum Leap Healthcare Collaborative during the conduct of the study; reports participation on the Blue Cross Medical Advisory Panel; reports participation as an uncompensated board member of Quantum Leap Healthcare Collaborative; and serves as principal investigator for an investigator initiated Phase1 trial for high-risk DCIS funded by Moderna. AMD reports grants from Quantum Leap Healthcare Collaborative during the conduct of the study; reports grants from Neogenomics, Novartis, Genentech, and Pfizer outside the submitted work. HSR reports grants from OBI Pharma, AstraZeneca, Pfizer, Novartis, Eli Lilly, Hoffmann-La Roche AG/Genentech, Merck and Daiichi Sankyo, Inc.; reports personal fees from NAPO, Daiichi Sankyo, inc. and Eisai; reports grants from Gilead Sciences, Inc., Stemline Therapeutics, Ambrx; and reports personal fees from Mylan/Viatris during the conduct of the study. LJvV reports personal fees and other support from Agendia during the conduct of the study; and reports other support from ExaiBio outside the submitted work. All other authors declare no competing interests.
Figures
References
-
- I-SPY Trial Consortium, Yee D, DeMichele AM, Yau C, Isaacs C, Symmans WF, et al. Association of Event-Free and Distant Recurrence-Free Survival With Individual-Level Pathologic Complete Response in Neoadjuvant Treatment of Stages 2 and 3 Breast Cancer: Three-Year Follow-up Analysis for the I-SPY2 Adaptively Randomized Clinical Trial. JAMA Oncol 2020;6:1355–62 - PMC - PubMed
-
- Papakonstantinou A, Gonzalez NS, Pimentel I, Sunol A, Zamora E, Ortiz C, et al. Prognostic value of ctDNA detection in patients with early breast cancer undergoing neoadjuvant therapy: A systematic review and meta-analysis. Cancer Treat Rev 2022;104:102362. - PubMed
MeSH terms
Substances
Grants and funding
LinkOut - more resources
Full Text Sources
Medical
Research Materials
Miscellaneous
