

Environmental factors influence cross-talk between a heat shock protein and an oxidative stress protein modification in the lizard Gallotia galloti
- PMID: 38470891
- PMCID: PMC10931494
- DOI: 10.1371/journal.pone.0300111
Environmental factors influence cross-talk between a heat shock protein and an oxidative stress protein modification in the lizard Gallotia galloti
Abstract
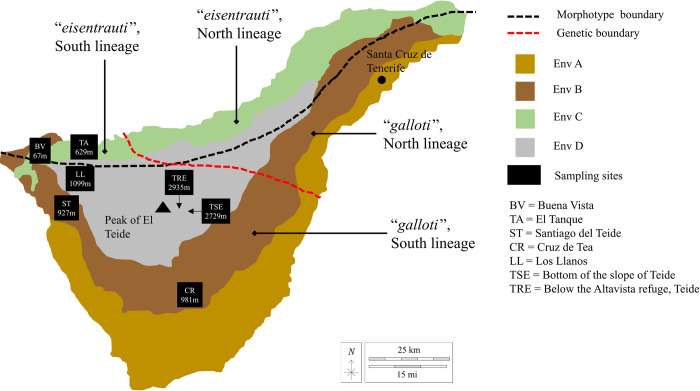
Better understanding how organisms respond to their abiotic environment, especially at the biochemical level, is critical in predicting population trajectories under climate change. In this study, we measured constitutive stress biomarkers and protein post-translational modifications associated with oxidative stress in Gallotia galloti, an insular lizard species inhabiting highly heterogeneous environments on Tenerife. Tenerife is a small volcanic island in a relatively isolated archipelago off the West coast of Africa. We found that expression of GRP94, a molecular chaperone protein, and levels of protein carbonylation, a marker of cellular stress, change across different environments, depending on solar radiation-related variables and topology. Here, we report in a wild animal population, cross-talk between the baseline levels of the heat shock protein-like GRP94 and oxidative damage (protein carbonylation), which are influenced by a range of available temperatures, quantified through modelled operative temperature. This suggests a dynamic trade-off between cellular homeostasis and oxidative damage in lizards adapted to this thermally and topologically heterogeneous environment.
Copyright: © 2024 Gilbert et al. This is an open access article distributed under the terms of the Creative Commons Attribution License, which permits unrestricted use, distribution, and reproduction in any medium, provided the original author and source are credited.
Conflict of interest statement
The authors have declared that no competing interests exist.
Figures


Similar articles
-
Range of metastrongylids (superfamily Metastrongyloidea) of public health and veterinary concern present in livers of the endemic lizard Gallotia galloti of Tenerife, Canary Islands, Spain.Parasit Vectors. 2023 Mar 1;16(1):81. doi: 10.1186/s13071-023-05653-z. Parasit Vectors. 2023. PMID: 36890511 Free PMC article.
-
Geological history and within-island diversity: a debris avalanche and the Tenerife lizard Gallotia galloti.Mol Ecol. 2006 Oct;15(12):3631-40. doi: 10.1111/j.1365-294X.2006.03048.x. Mol Ecol. 2006. PMID: 17032262
-
Lizard host abundances and climatic factors explain phylogenetic diversity and prevalence of blood parasites on an oceanic island.Mol Ecol. 2024 Mar;33(5):e17276. doi: 10.1111/mec.17276. Epub 2024 Jan 19. Mol Ecol. 2024. PMID: 38243603
-
Stereotaxic atlas for the lizard Gallotia galloti.Prog Neurobiol. 1990;34(3):185-96. doi: 10.1016/0301-0082(90)90011-5. Prog Neurobiol. 1990. PMID: 2181532 Review. No abstract available.
-
Morphology, Behaviour and Evolution of Gallotia Lizards from the Canary Islands.Animals (Basel). 2023 Jul 15;13(14):2319. doi: 10.3390/ani13142319. Animals (Basel). 2023. PMID: 37508096 Free PMC article. Review.
Cited by
-
Selection on the vascular-remodeling BMPER gene is associated with altitudinal adaptation in an insular lizard.Evol Lett. 2024 Sep 22;9(1):41-50. doi: 10.1093/evlett/qrae047. eCollection 2025 Feb. Evol Lett. 2024. PMID: 39906579 Free PMC article.
References
-
- Hochachka PW, Somero GN. Biochemical adaptation: mechanism and process in physiological evolution. Oxford university press; 2002.
MeSH terms
Substances
LinkOut - more resources
Full Text Sources
Miscellaneous
