

A mathematical model to assess the effectiveness of test-trace-isolate-and-quarantine under limited capacities
- PMID: 38470895
- PMCID: PMC10931449
- DOI: 10.1371/journal.pone.0299880
A mathematical model to assess the effectiveness of test-trace-isolate-and-quarantine under limited capacities
Abstract
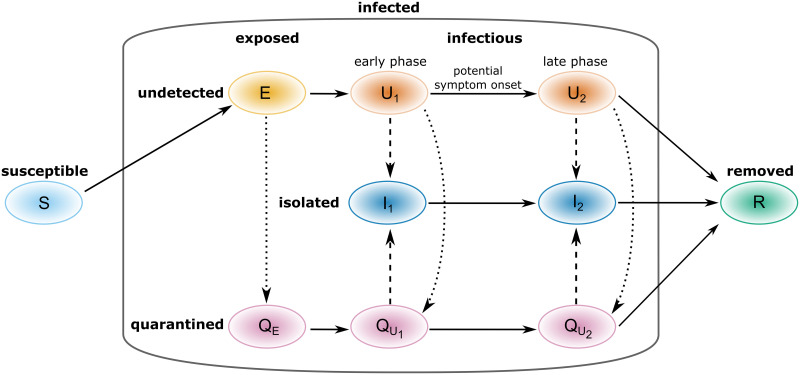
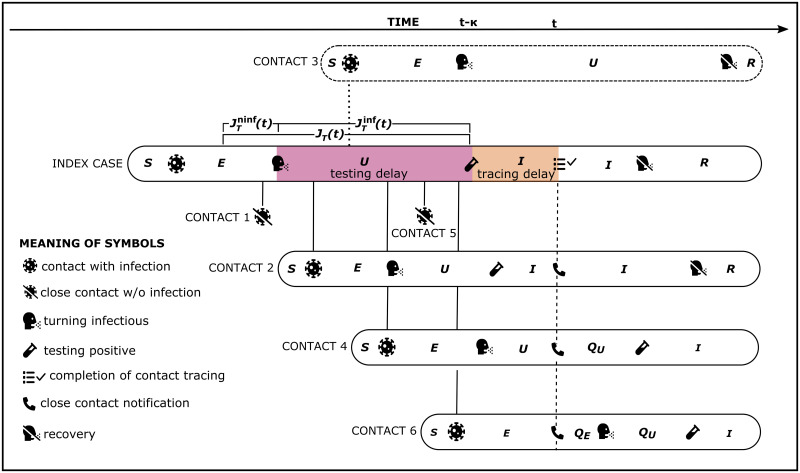
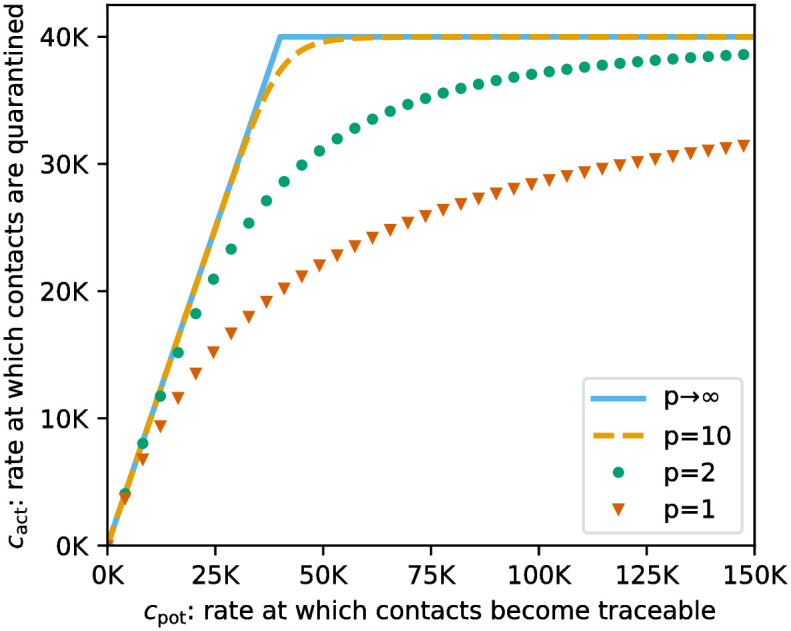
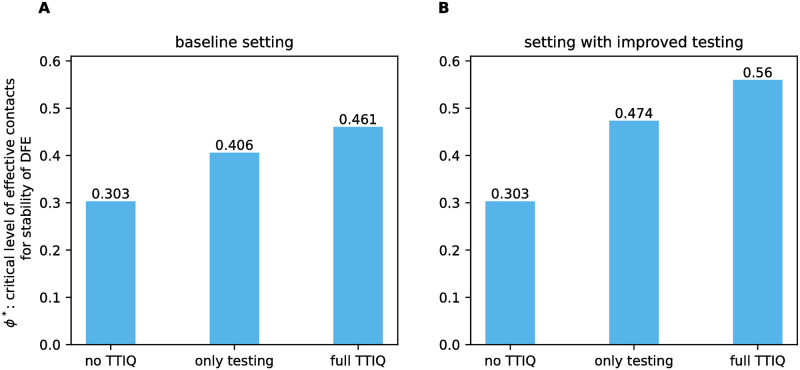
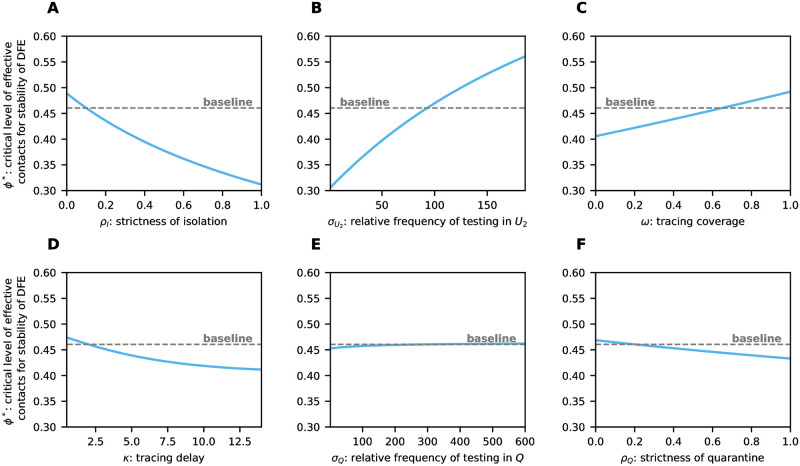
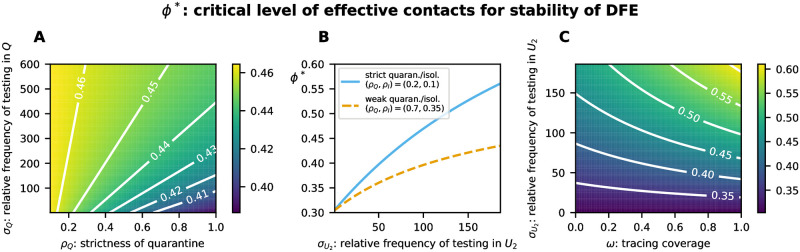
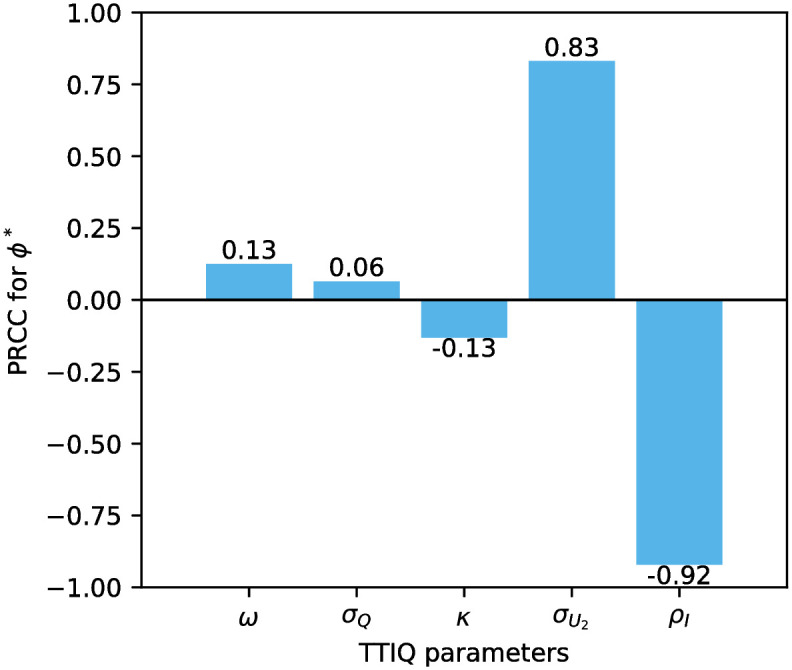
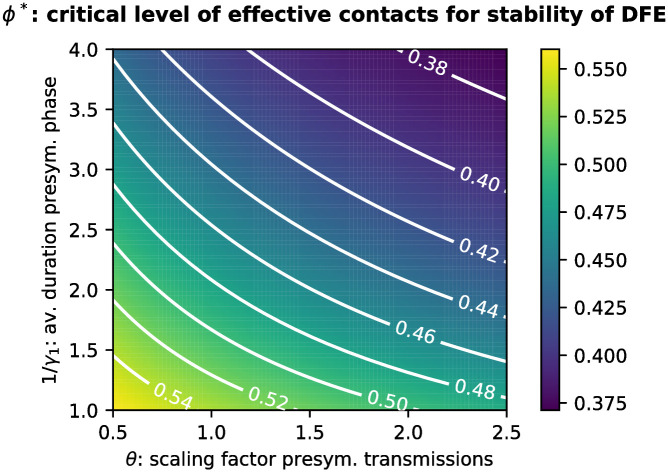
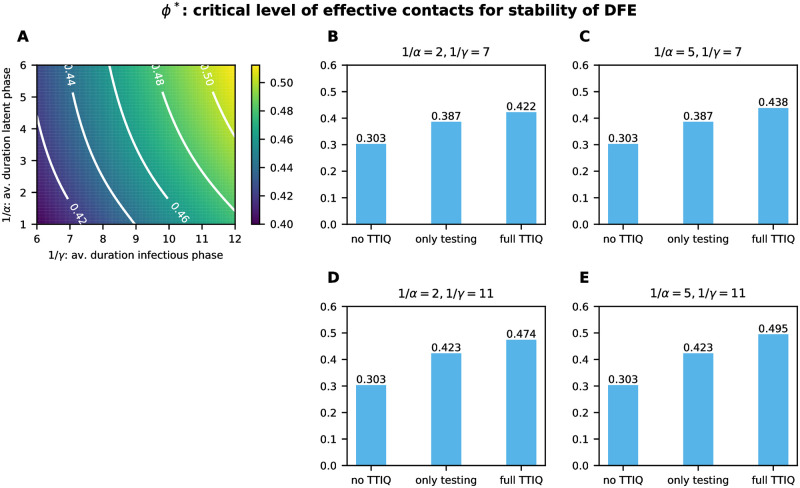
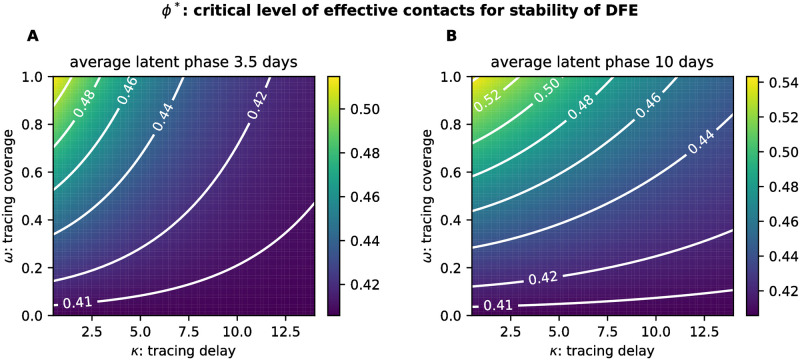
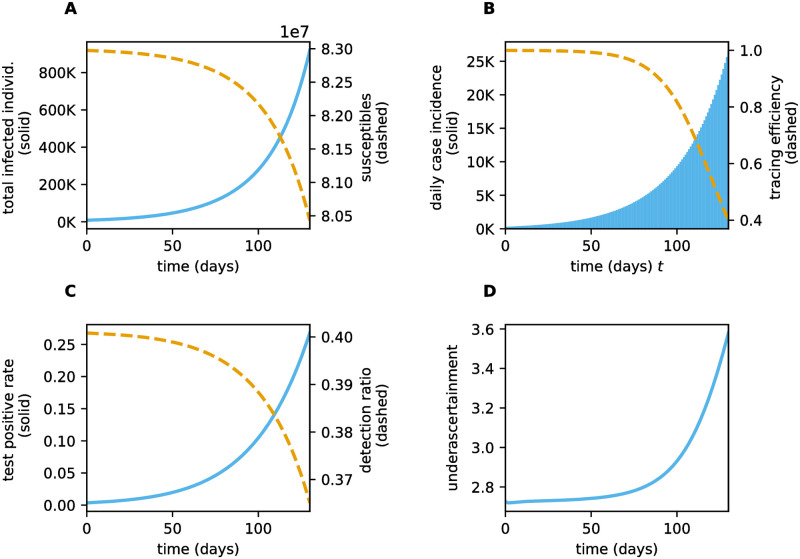
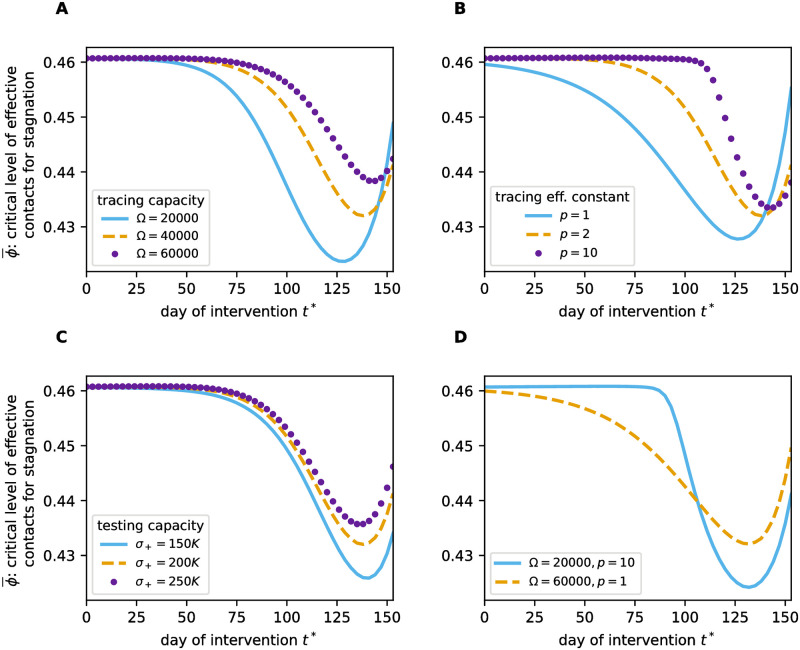
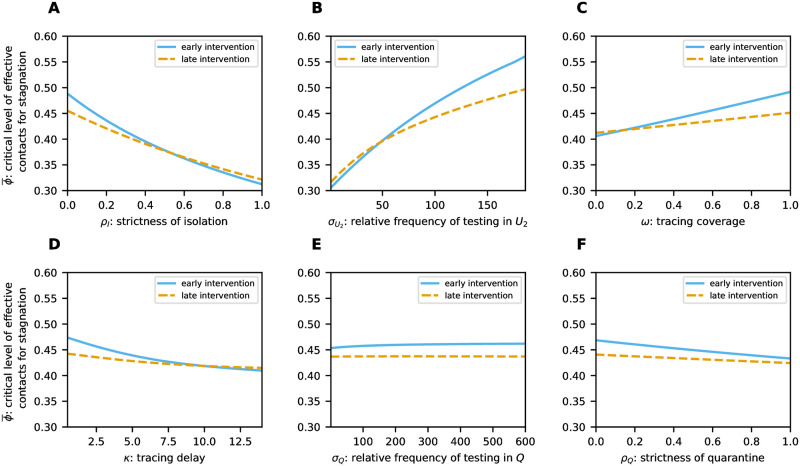
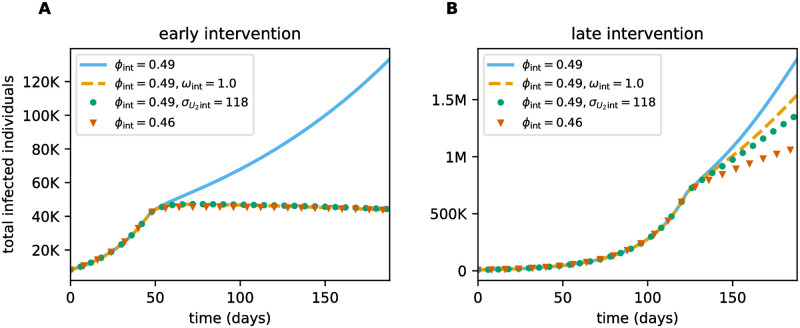
Diagnostic testing followed by isolation of identified cases with subsequent tracing and quarantine of close contacts-often referred to as test-trace-isolate-and-quarantine (TTIQ) strategy-is one of the cornerstone measures of infectious disease control. The COVID-19 pandemic has highlighted that an appropriate response to outbreaks of infectious diseases requires a firm understanding of the effectiveness of such containment strategies. To this end, mathematical models provide a promising tool. In this work, we present a delay differential equation model of TTIQ interventions for infectious disease control. Our model incorporates the assumption of limited TTIQ capacities, providing insights into the reduced effectiveness of testing and tracing in high prevalence scenarios. In addition, we account for potential transmission during the early phase of an infection, including presymptomatic transmission, which may be particularly adverse to a TTIQ based control. Our numerical experiments inspired by the early spread of COVID-19 in Germany demonstrate the effectiveness of TTIQ in a scenario where immunity within the population is low and pharmaceutical interventions are absent, which is representative of a typical situation during the (re-)emergence of infectious diseases for which therapeutic drugs or vaccines are not yet available. Stability and sensitivity analyses reveal both disease-dependent and disease-independent factors that impede or enhance the success of TTIQ. Studying the diminishing impact of TTIQ along simulations of an epidemic wave, we highlight consequences for intervention strategies.
Copyright: © 2024 Heidecke et al. This is an open access article distributed under the terms of the Creative Commons Attribution License, which permits unrestricted use, distribution, and reproduction in any medium, provided the original author and source are credited.
Conflict of interest statement
The authors have declared that no competing interests exist.
Figures
Similar articles
-
Test-trace-isolate-quarantine (TTIQ) intervention strategies after symptomatic COVID-19 case identification.PLoS One. 2022 Feb 11;17(2):e0263597. doi: 10.1371/journal.pone.0263597. eCollection 2022. PLoS One. 2022. PMID: 35148359 Free PMC article.
-
Estimating the impact of test-trace-isolate-quarantine systems on SARS-CoV-2 transmission in Australia.Epidemics. 2024 Jun;47:100764. doi: 10.1016/j.epidem.2024.100764. Epub 2024 Mar 22. Epidemics. 2024. PMID: 38552550
-
Effectiveness of testing, contact tracing and isolation interventions among the general population on reducing transmission of SARS-CoV-2: a systematic review.Philos Trans A Math Phys Eng Sci. 2023 Oct 9;381(2257):20230131. doi: 10.1098/rsta.2023.0131. Epub 2023 Aug 23. Philos Trans A Math Phys Eng Sci. 2023. PMID: 37611628 Free PMC article.
-
Travel-related control measures to contain the COVID-19 pandemic: a rapid review.Cochrane Database Syst Rev. 2020 Oct 5;10:CD013717. doi: 10.1002/14651858.CD013717. Cochrane Database Syst Rev. 2020. Update in: Cochrane Database Syst Rev. 2021 Mar 25;3:CD013717. doi: 10.1002/14651858.CD013717.pub2. PMID: 33502002 Updated.
-
Determining the optimal strategy for reopening schools, the impact of test and trace interventions, and the risk of occurrence of a second COVID-19 epidemic wave in the UK: a modelling study.Lancet Child Adolesc Health. 2020 Nov;4(11):817-827. doi: 10.1016/S2352-4642(20)30250-9. Epub 2020 Aug 3. Lancet Child Adolesc Health. 2020. PMID: 32758453 Free PMC article.
Cited by
-
Differentiating Contact with Symptomatic and Asymptomatic Infectious Individuals in a SEIR Epidemic Model.Bull Math Biol. 2025 Feb 4;87(3):38. doi: 10.1007/s11538-025-01416-2. Bull Math Biol. 2025. PMID: 39904959 Free PMC article.
-
Ethical implications of COVID-19 management-is freedom a desired aim, or a desired means to an end?Front Public Health. 2024 Apr 26;12:1377543. doi: 10.3389/fpubh.2024.1377543. eCollection 2024. Front Public Health. 2024. PMID: 38737861 Free PMC article.
References
-
- da Rosa Mesquita R., F. S. Junior L. C., Santana F. M. S., de Oliveira T. F., Alcântara R. C., Arnozo G. M., et al.., Clinical manifestations of COVID-19 in the general population: systematic review, Wiener klinische Wochenschrift, 133 (2020), 377–382. doi: 10.1007/s00508-020-01760-4 - DOI - PMC - PubMed
-
- Robert Koch Institute, Epidemiologischer Steckbrief zu SARS-CoV-2 und COVID-19, Last accessed on 11/22/2022. Available from: https://www.rki.de/DE/Content/InfAZ/N/Neuartiges_Coronavirus/Steckbrief.....
MeSH terms
LinkOut - more resources
Full Text Sources
Medical
