

Aerosolization of viable Mycobacterium tuberculosis bacilli by tuberculosis clinic attendees independent of sputum-Xpert Ultra status
- PMID: 38470917
- PMCID: PMC10962937
- DOI: 10.1073/pnas.2314813121
Aerosolization of viable Mycobacterium tuberculosis bacilli by tuberculosis clinic attendees independent of sputum-Xpert Ultra status
Abstract
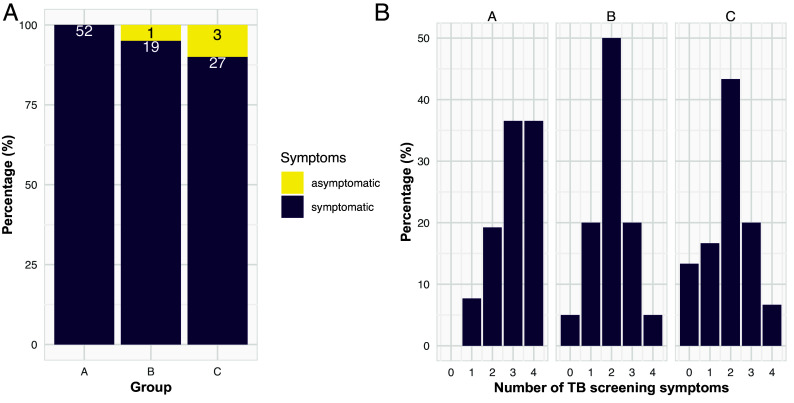
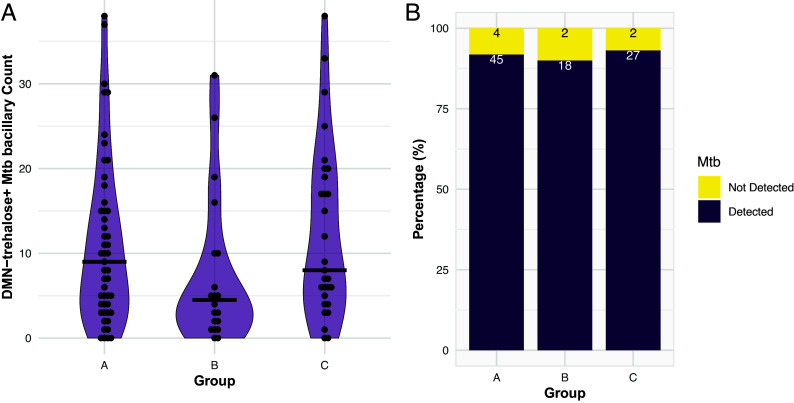
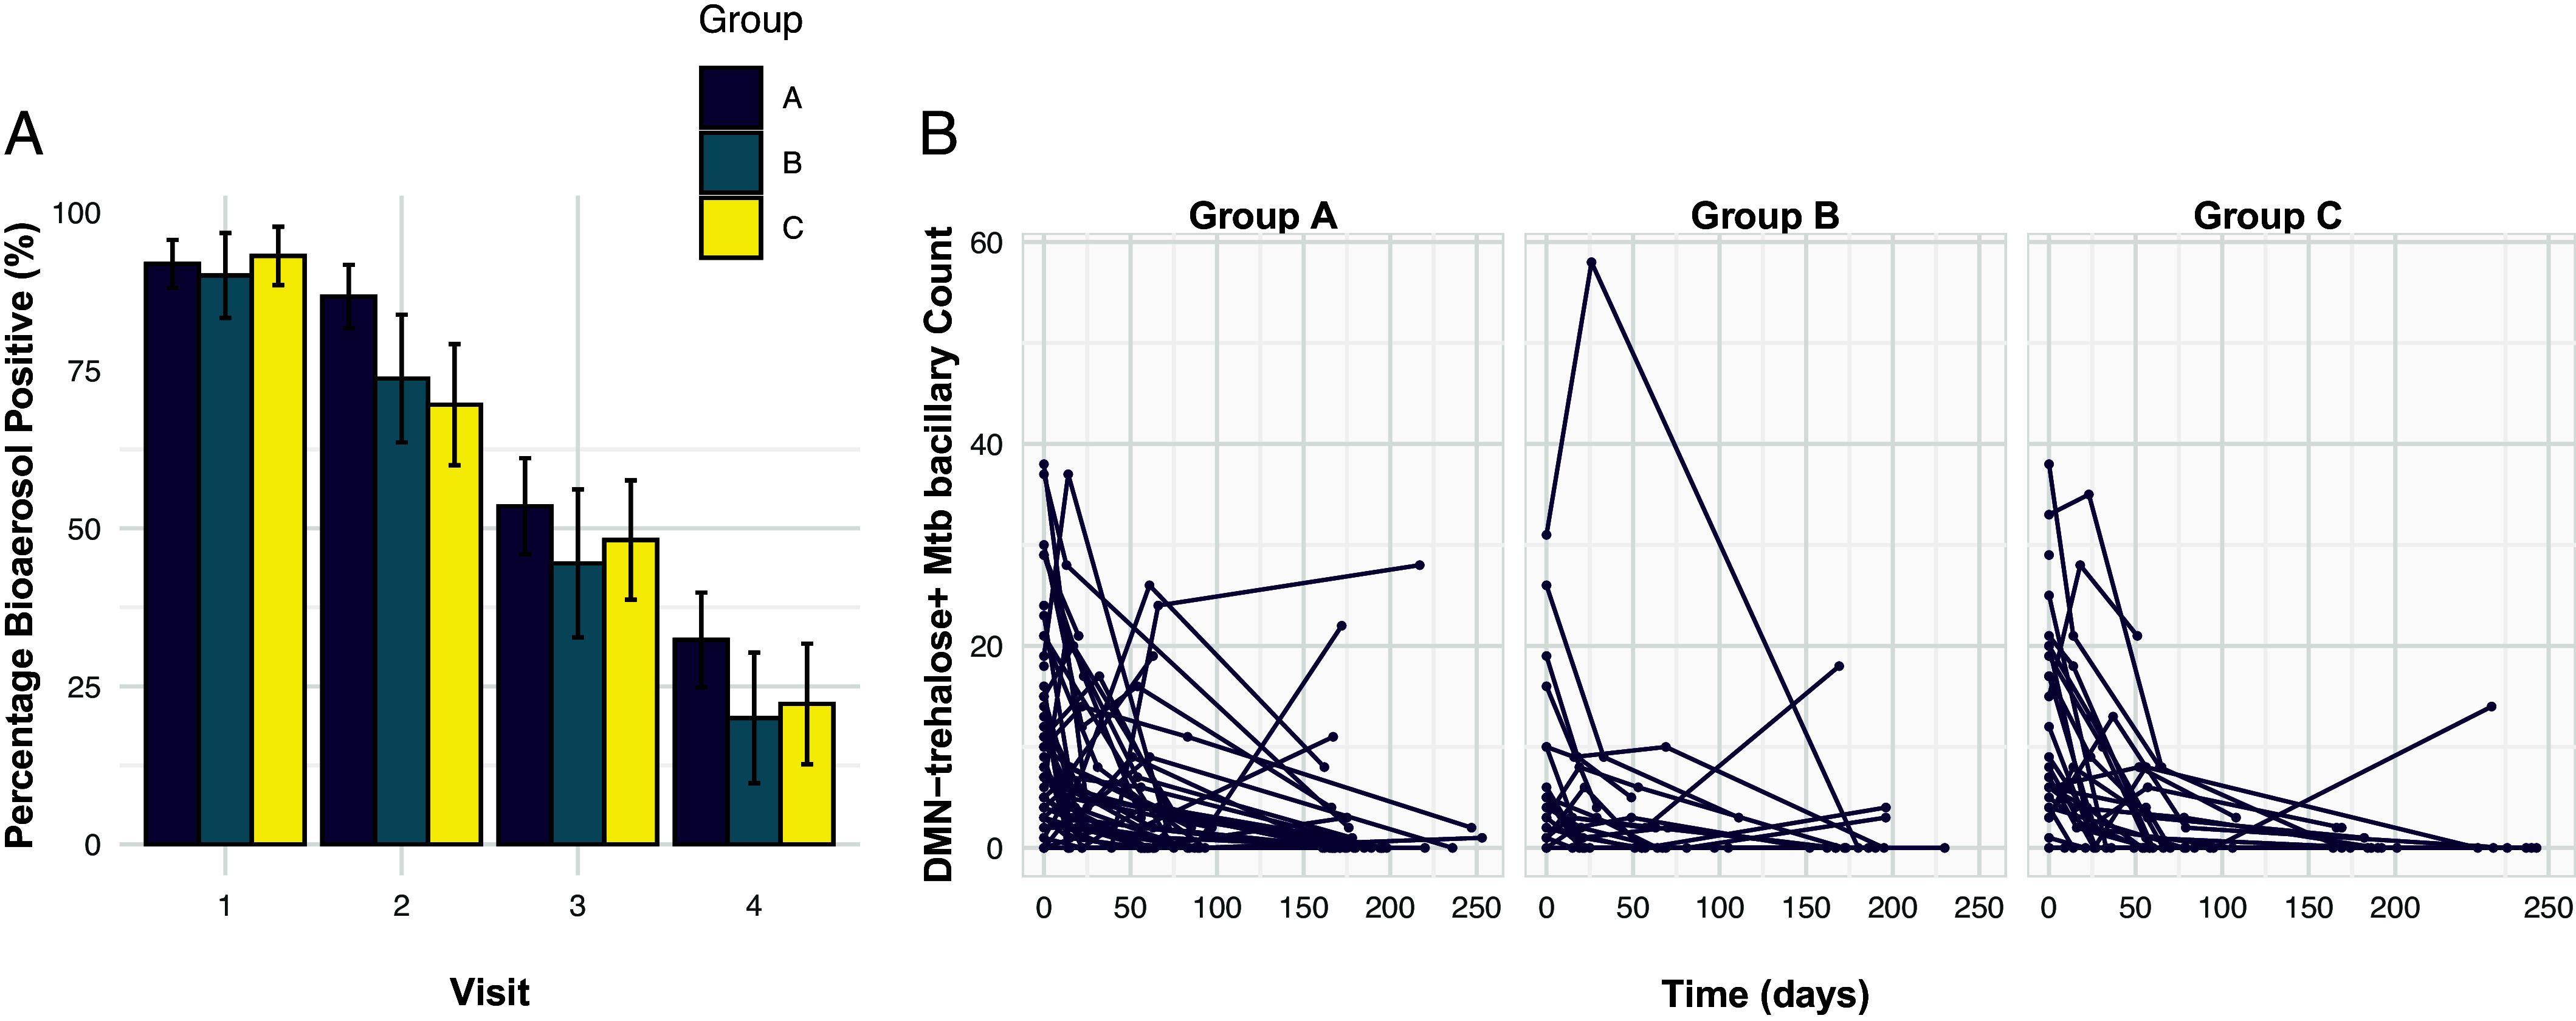
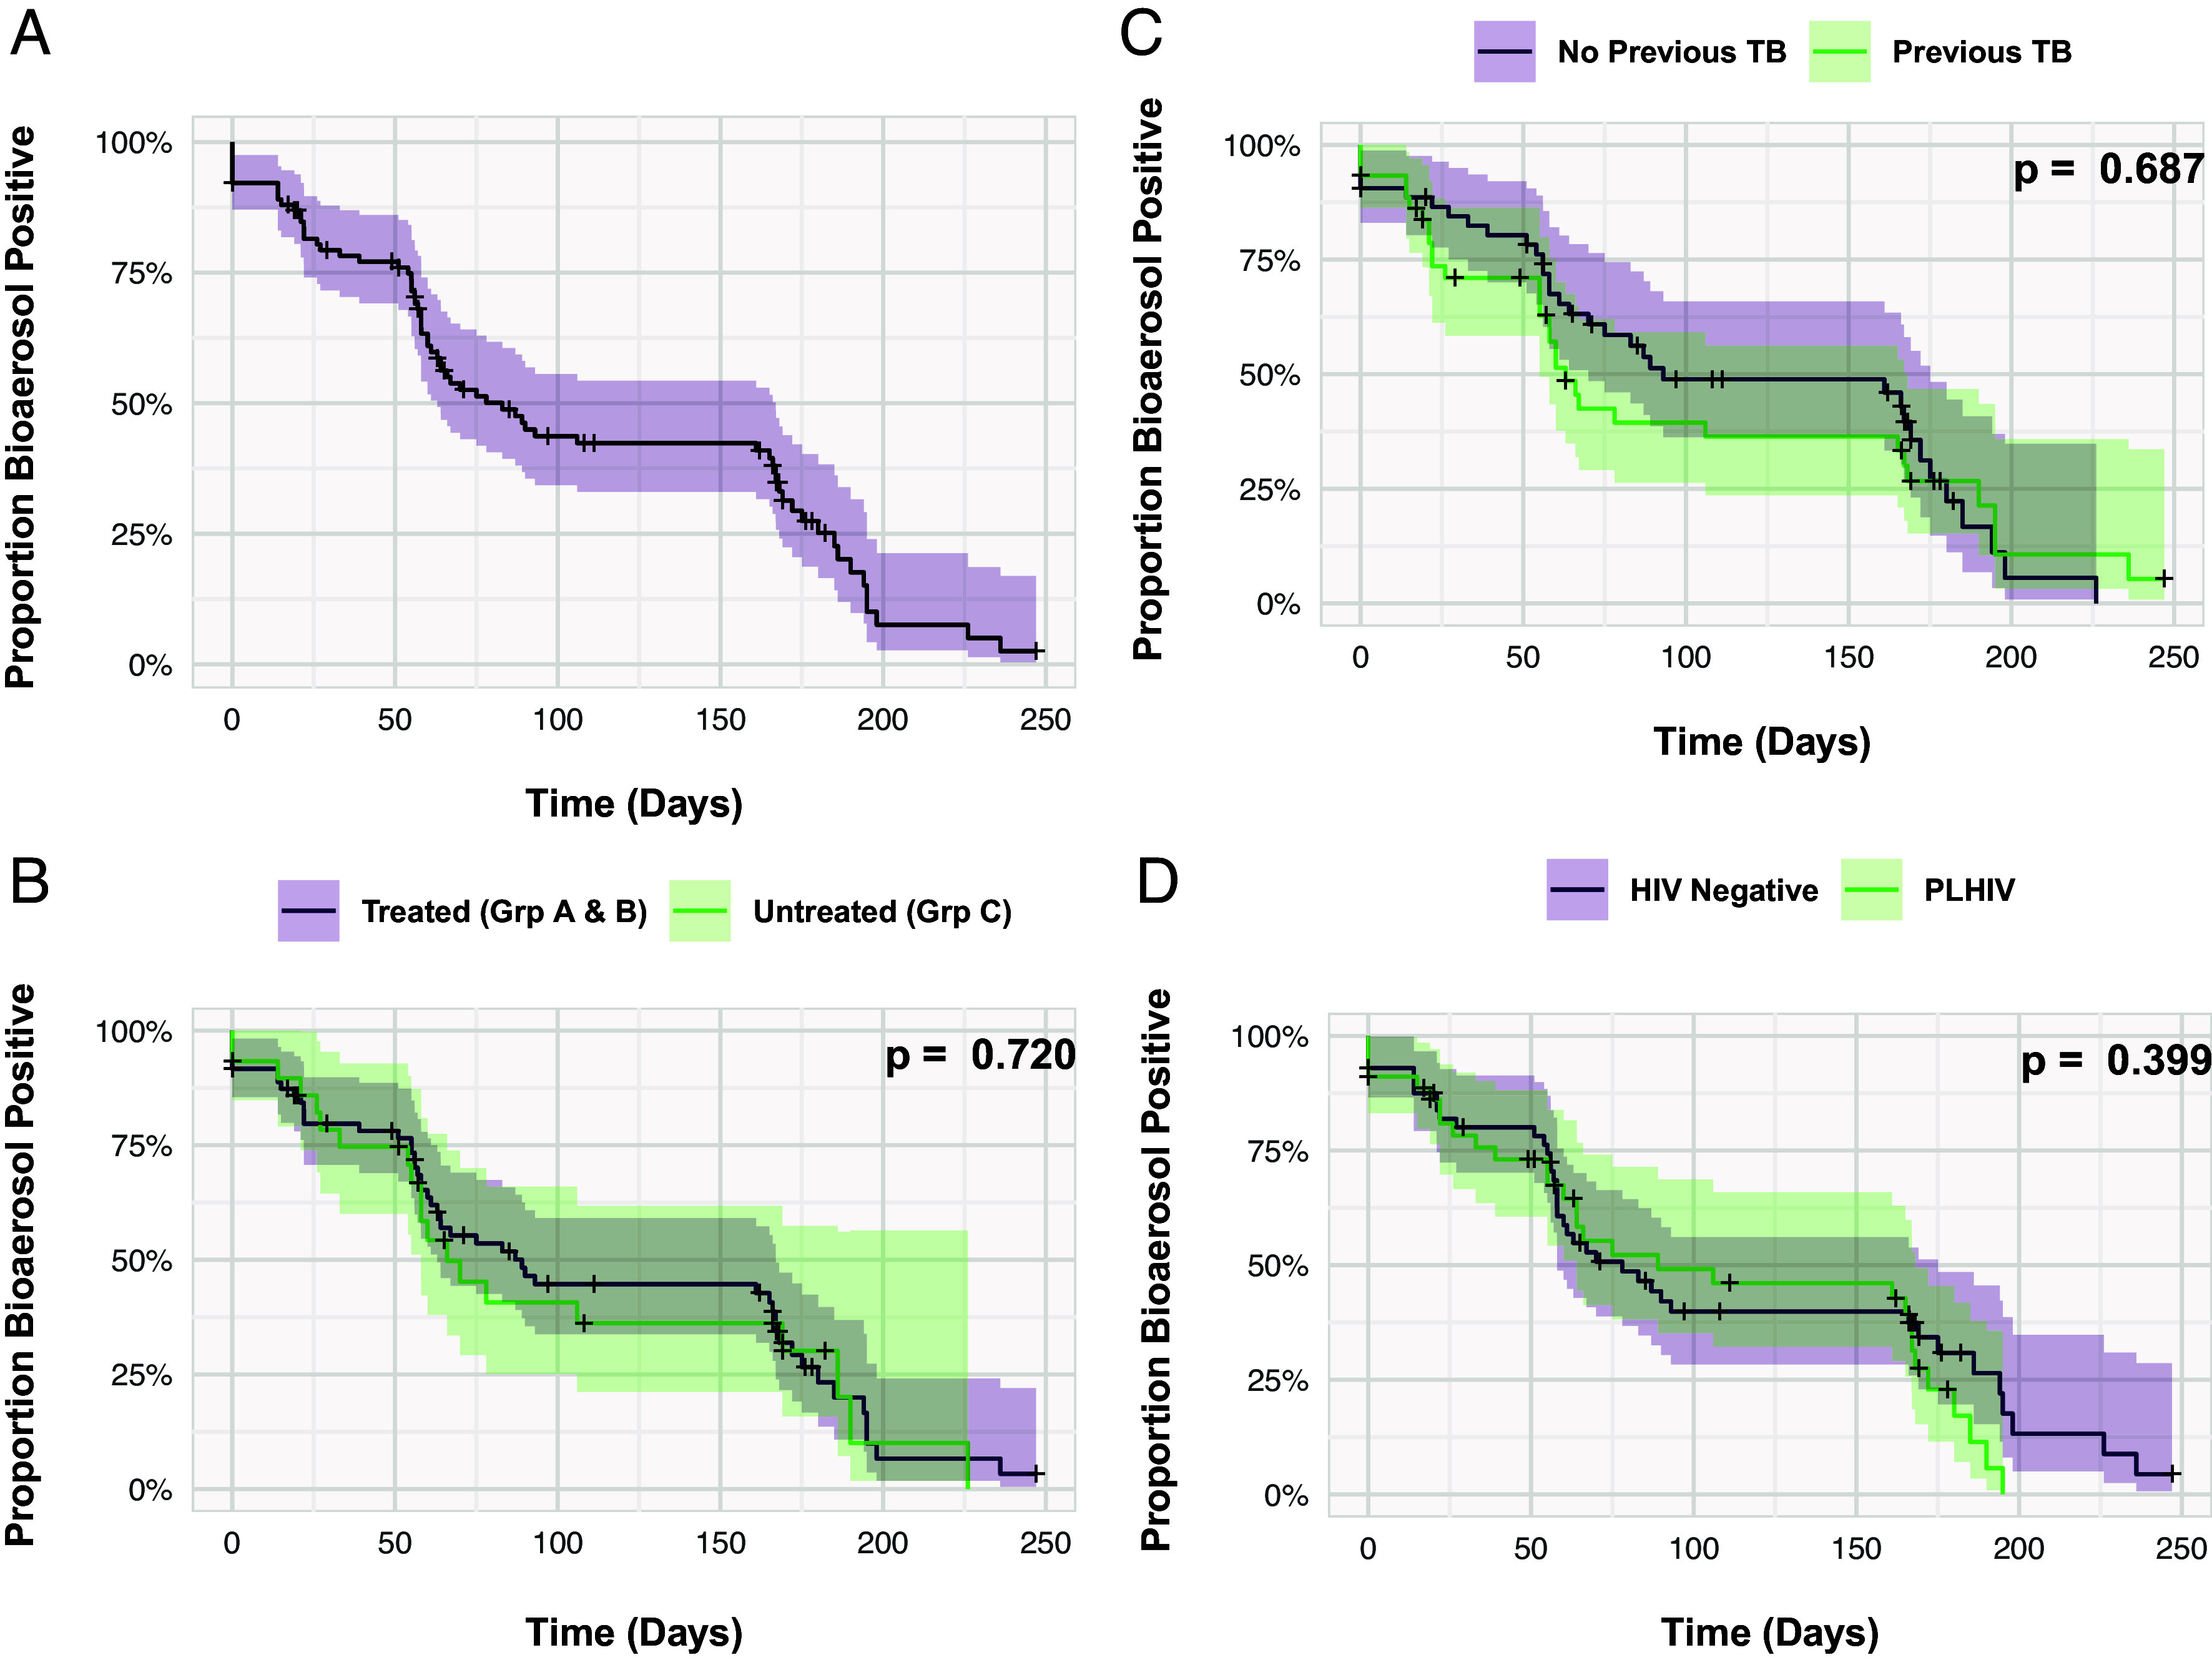
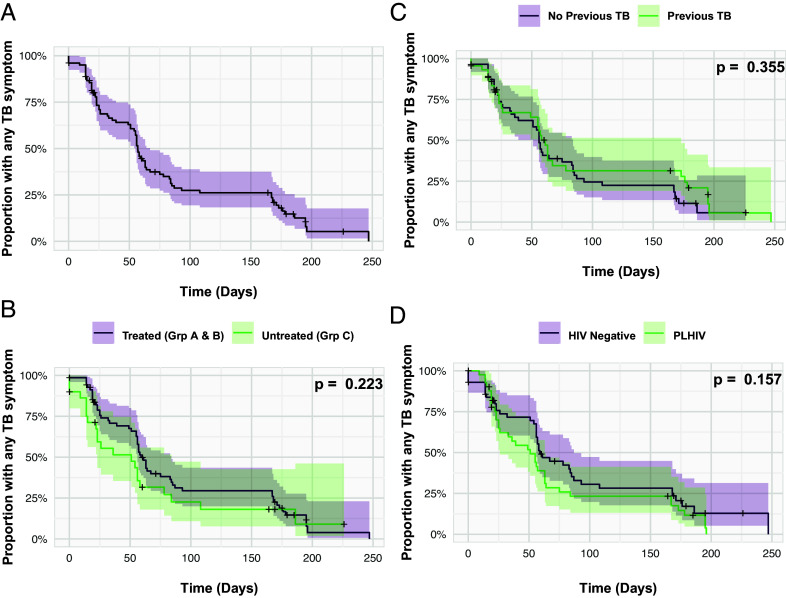
Potential Mycobacterium tuberculosis (Mtb) transmission during different pulmonary tuberculosis (TB) disease states is poorly understood. We quantified viable aerosolized Mtb from TB clinic attendees following diagnosis and through six months' follow-up thereafter. Presumptive TB patients (n=102) were classified by laboratory, radiological, and clinical features into Group A: Sputum-Xpert Ultra-positive TB (n=52), Group B: Sputum-Xpert Ultra-negative TB (n=20), or Group C: TB undiagnosed (n=30). All groups were assessed for Mtb bioaerosol release at baseline, and subsequently at 2 wk, 2 mo, and 6 mo. Groups A and B were notified to the national TB program and received standard anti-TB chemotherapy; Mtb was isolated from 92% and 90% at presentation, 87% and 74% at 2 wk, 54% and 44% at 2 mo and 32% and 20% at 6 mo, respectively. Surprisingly, similar numbers were detected in Group C not initiating TB treatment: 93%, 70%, 48% and 22% at the same timepoints. A temporal association was observed between Mtb bioaerosol release and TB symptoms in all three groups. Persistence of Mtb bioaerosol positivity was observed in ~30% of participants irrespective of TB chemotherapy. Captured Mtb bacilli were predominantly acid-fast stain-negative and poorly culturable; however, three bioaerosol samples yielded sufficient biomass following culture for whole-genome sequencing, revealing two different Mtb lineages. Detection of viable aerosolized Mtb in clinic attendees, independent of TB diagnosis, suggests that unidentified Mtb transmitters might contribute a significant attributable proportion of community exposure. Additional longitudinal studies with sputum culture-positive and -negative control participants are required to investigate this possibility.
Keywords: aerosol sampling; subclinical; tuberculosis.
Conflict of interest statement
Competing interests statement:The authors declare no competing interest.
Figures
Comment in
-
The Titanic question in TB control: Should we worry about the bummock?Proc Natl Acad Sci U S A. 2024 Apr 2;121(14):e2403321121. doi: 10.1073/pnas.2403321121. Epub 2024 Mar 25. Proc Natl Acad Sci U S A. 2024. PMID: 38527210 Free PMC article. No abstract available.
Similar articles
-
Bioaerosol sampling of patients with suspected pulmonary tuberculosis: a study protocol.BMC Infect Dis. 2020 Aug 8;20(1):587. doi: 10.1186/s12879-020-05278-y. BMC Infect Dis. 2020. PMID: 32770954 Free PMC article.
-
Xpert MTB/RIF Ultra Assay Using Stool: an Effective Solution for Bacilli Identification from Adult Pulmonary Tuberculosis Suspects without Expectorated Sputum.Microbiol Spectr. 2023 Aug 17;11(4):e0126523. doi: 10.1128/spectrum.01265-23. Epub 2023 Jun 28. Microbiol Spectr. 2023. PMID: 37378554 Free PMC article.
-
The New Xpert MTB/RIF Ultra: Improving Detection of Mycobacterium tuberculosis and Resistance to Rifampin in an Assay Suitable for Point-of-Care Testing.mBio. 2017 Aug 29;8(4):e00812-17. doi: 10.1128/mBio.00812-17. mBio. 2017. PMID: 28851844 Free PMC article.
-
Xpert MTB/RIF and Xpert Ultra assays for screening for pulmonary tuberculosis and rifampicin resistance in adults, irrespective of signs or symptoms.Cochrane Database Syst Rev. 2021 Mar 23;3(3):CD013694. doi: 10.1002/14651858.CD013694.pub2. Cochrane Database Syst Rev. 2021. PMID: 33755189 Free PMC article.
-
Lipid droplets and the transcriptome of Mycobacterium tuberculosis from direct sputa: a literature review.Lipids Health Dis. 2021 Oct 3;20(1):129. doi: 10.1186/s12944-021-01550-5. Lipids Health Dis. 2021. PMID: 34602073 Free PMC article. Review.
Cited by
-
A cytoderm metabolic labeling TPAPy-Tre for real-time detection of vitality of Mycobacterium tuberculosis in sputum.Microbiol Spectr. 2025 Jul;13(7):e0245724. doi: 10.1128/spectrum.02457-24. Epub 2025 May 22. Microbiol Spectr. 2025. PMID: 40401971 Free PMC article.
-
Estimating Mycobacterium tuberculosis transmission in a South African clinic: Spatiotemporal model based on person movements.PLoS Comput Biol. 2025 Feb 18;21(2):e1012823. doi: 10.1371/journal.pcbi.1012823. eCollection 2025 Feb. PLoS Comput Biol. 2025. PMID: 39965023 Free PMC article.
-
A spotlight on the tuberculosis epidemic in South Africa.Nat Commun. 2024 Feb 12;15(1):1290. doi: 10.1038/s41467-024-45491-w. Nat Commun. 2024. PMID: 38346962 Free PMC article.
-
Quantification of tuberculosis exposure in a high-burdened setting.Sci Rep. 2025 Jul 2;15(1):22687. doi: 10.1038/s41598-024-81558-w. Sci Rep. 2025. PMID: 40595677 Free PMC article.
-
The Titanic question in TB control: Should we worry about the bummock?Proc Natl Acad Sci U S A. 2024 Apr 2;121(14):e2403321121. doi: 10.1073/pnas.2403321121. Epub 2024 Mar 25. Proc Natl Acad Sci U S A. 2024. PMID: 38527210 Free PMC article. No abstract available.
References
-
- Gebhart J., et al. , The human lung as aerosol particle generator. J. Aerosol. Med. 1, 196–197 (1988).
MeSH terms
Grants and funding
LinkOut - more resources
Full Text Sources
Medical
