Machine Learning Did Not Outperform Conventional Competing Risk Modeling to Predict Revision Arthroplasty
- PMID: 38470976
- PMCID: PMC11272341
- DOI: 10.1097/CORR.0000000000003018
Machine Learning Did Not Outperform Conventional Competing Risk Modeling to Predict Revision Arthroplasty
Abstract
Background: Estimating the risk of revision after arthroplasty could inform patient and surgeon decision-making. However, there is a lack of well-performing prediction models assisting in this task, which may be due to current conventional modeling approaches such as traditional survivorship estimators (such as Kaplan-Meier) or competing risk estimators. Recent advances in machine learning survival analysis might improve decision support tools in this setting. Therefore, this study aimed to assess the performance of machine learning compared with that of conventional modeling to predict revision after arthroplasty.
Question/purpose: Does machine learning perform better than traditional regression models for estimating the risk of revision for patients undergoing hip or knee arthroplasty?
Methods: Eleven datasets from published studies from the Dutch Arthroplasty Register reporting on factors associated with revision or survival after partial or total knee and hip arthroplasty between 2018 and 2022 were included in our study. The 11 datasets were observational registry studies, with a sample size ranging from 3038 to 218,214 procedures. We developed a set of time-to-event models for each dataset, leading to 11 comparisons. A set of predictors (factors associated with revision surgery) was identified based on the variables that were selected in the included studies. We assessed the predictive performance of two state-of-the-art statistical time-to-event models for 1-, 2-, and 3-year follow-up: a Fine and Gray model (which models the cumulative incidence of revision) and a cause-specific Cox model (which models the hazard of revision). These were compared with a machine-learning approach (a random survival forest model, which is a decision tree-based machine-learning algorithm for time-to-event analysis). Performance was assessed according to discriminative ability (time-dependent area under the receiver operating curve), calibration (slope and intercept), and overall prediction error (scaled Brier score). Discrimination, known as the area under the receiver operating characteristic curve, measures the model's ability to distinguish patients who achieved the outcomes from those who did not and ranges from 0.5 to 1.0, with 1.0 indicating the highest discrimination score and 0.50 the lowest. Calibration plots the predicted versus the observed probabilities; a perfect plot has an intercept of 0 and a slope of 1. The Brier score calculates a composite of discrimination and calibration, with 0 indicating perfect prediction and 1 the poorest. A scaled version of the Brier score, 1 - (model Brier score/null model Brier score), can be interpreted as the amount of overall prediction error.
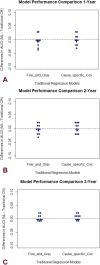
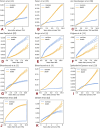
Results: Using machine learning survivorship analysis, we found no differences between the competing risks estimator and traditional regression models for patients undergoing arthroplasty in terms of discriminative ability (patients who received a revision compared with those who did not). We found no consistent differences between the validated performance (time-dependent area under the receiver operating characteristic curve) of different modeling approaches because these values ranged between -0.04 and 0.03 across the 11 datasets (the time-dependent area under the receiver operating characteristic curve of the models across 11 datasets ranged between 0.52 to 0.68). In addition, the calibration metrics and scaled Brier scores produced comparable estimates, showing no advantage of machine learning over traditional regression models.
Conclusion: Machine learning did not outperform traditional regression models.
Clinical relevance: Neither machine learning modeling nor traditional regression methods were sufficiently accurate in order to offer prognostic information when predicting revision arthroplasty. The benefit of these modeling approaches may be limited in this context.
Copyright © 2024 by the Association of Bone and Joint Surgeons.
Conflict of interest statement
All ICMJE Conflict of Interest Forms for authors and Clinical Orthopaedics and Related Research ® editors and board members are on file with the publication and can be viewed on request.
Figures


References
-
- Aalen OO, Johansen S. An empirical transition matrix for non-homogeneous Markov chains based on censored observations. Scand J Stat. 1978;5:141-150.
Publication types
MeSH terms
LinkOut - more resources
Full Text Sources
Medical

