. 2024 Jun 1;73(6):926-940.
doi: 10.2337/db23-0553.

Gut Microbiota-Tryptophan Metabolism-GLP-1 Axis Participates in β-Cell Regeneration Induced by Dapagliflozin

Affiliations

Gut Microbiota-Tryptophan Metabolism-GLP-1 Axis Participates in β-Cell Regeneration Induced by Dapagliflozin

Yafei Jiang et al. Diabetes. .

Abstract

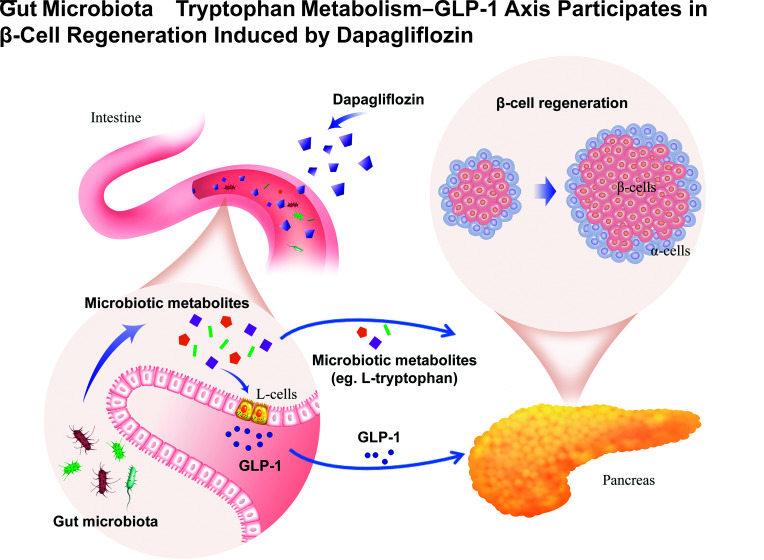
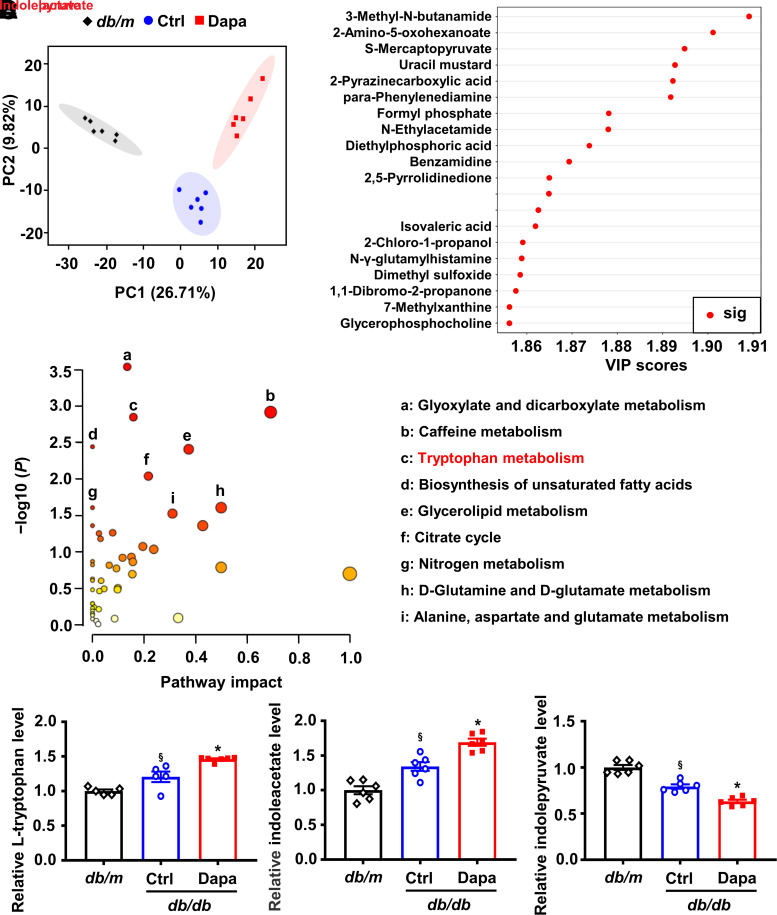
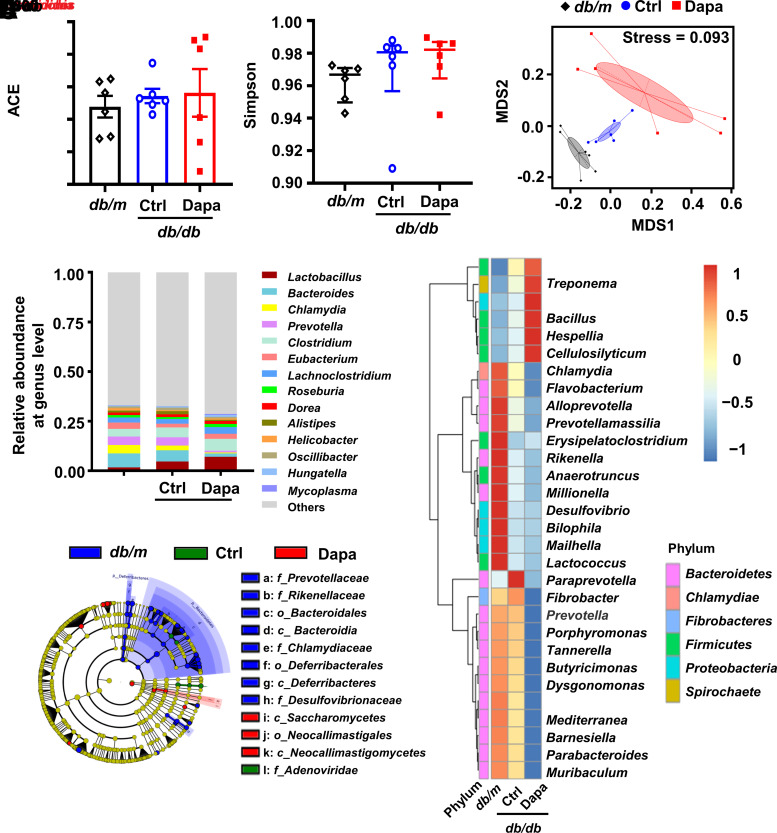
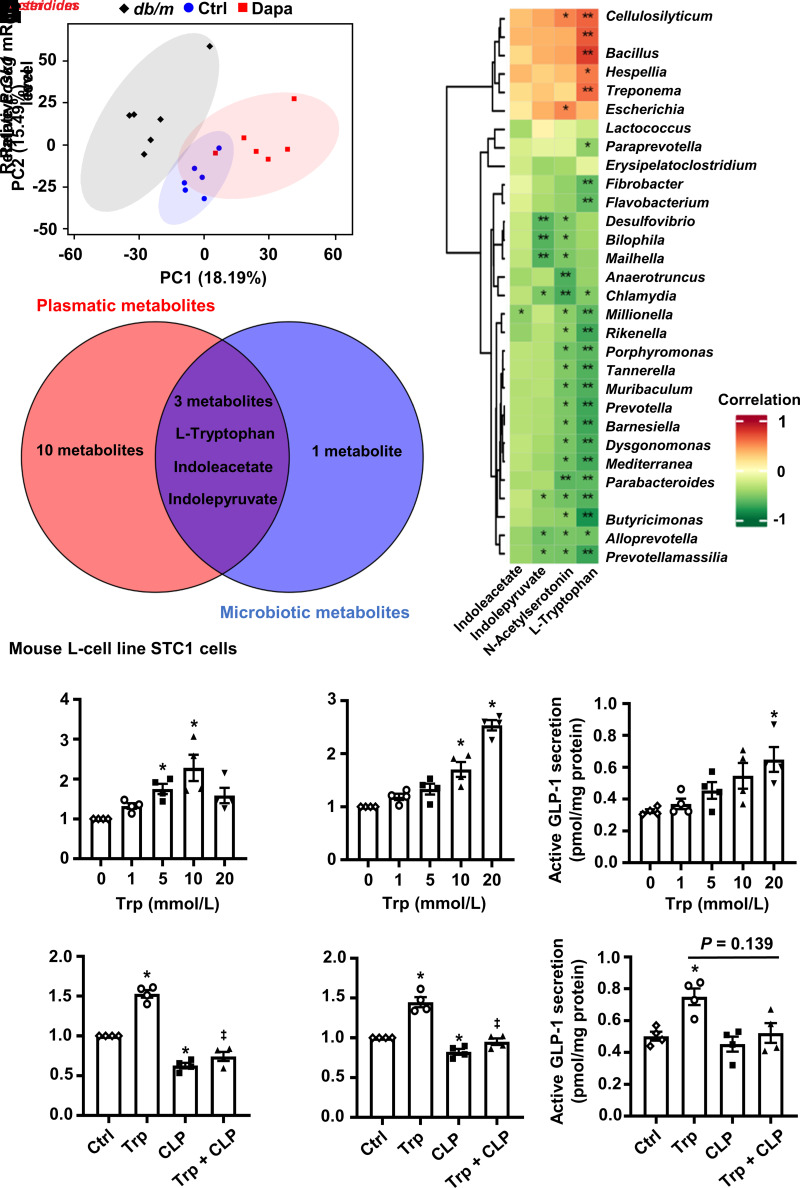
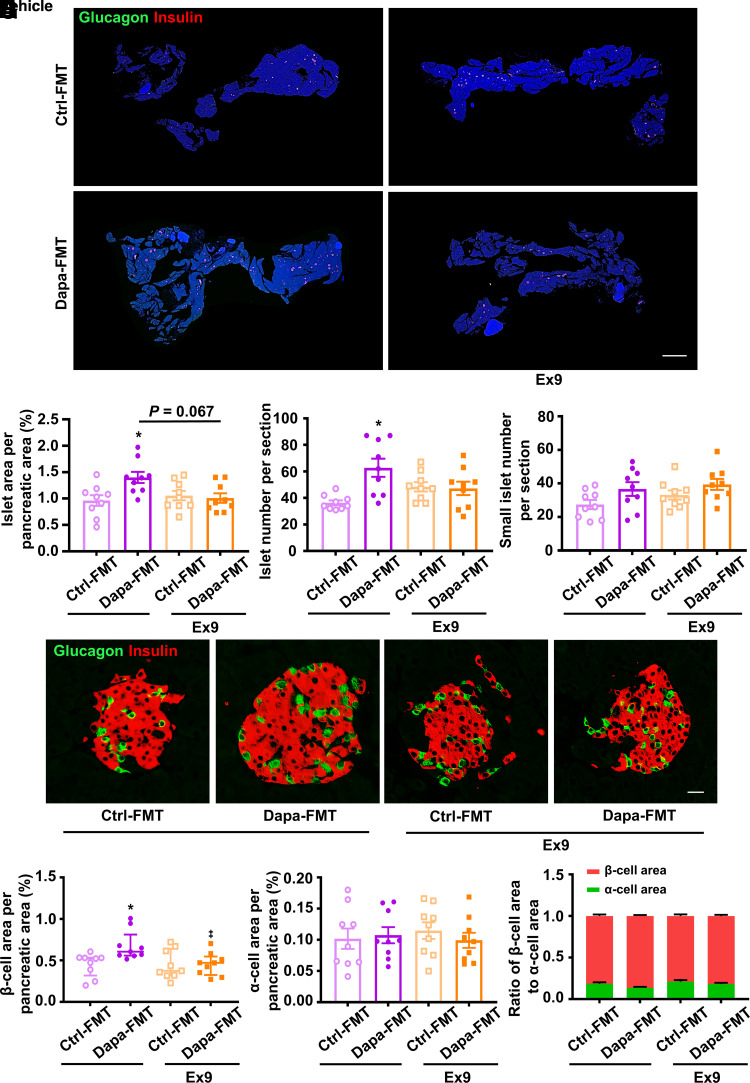
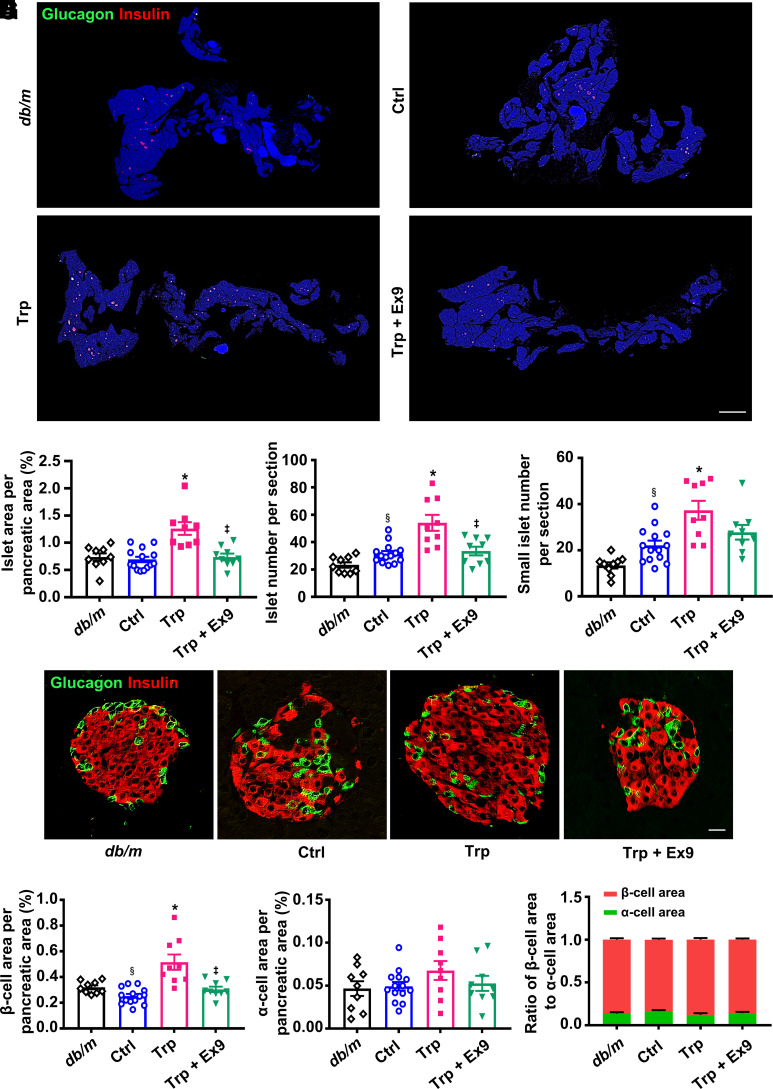
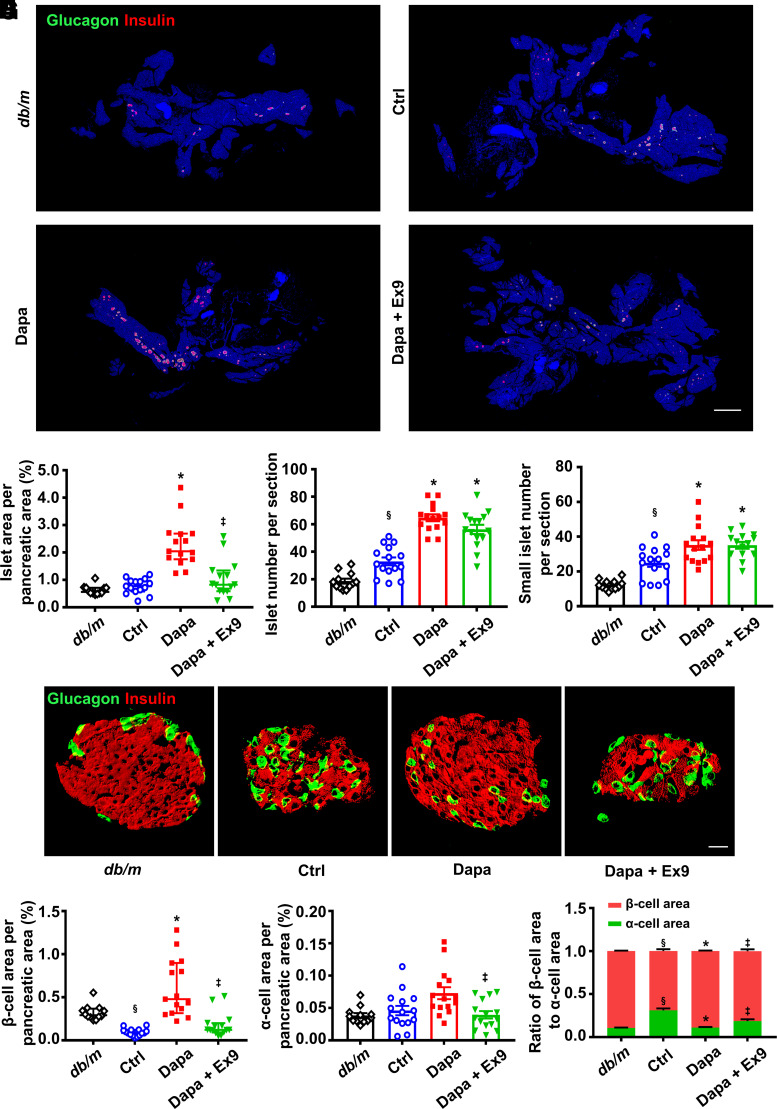
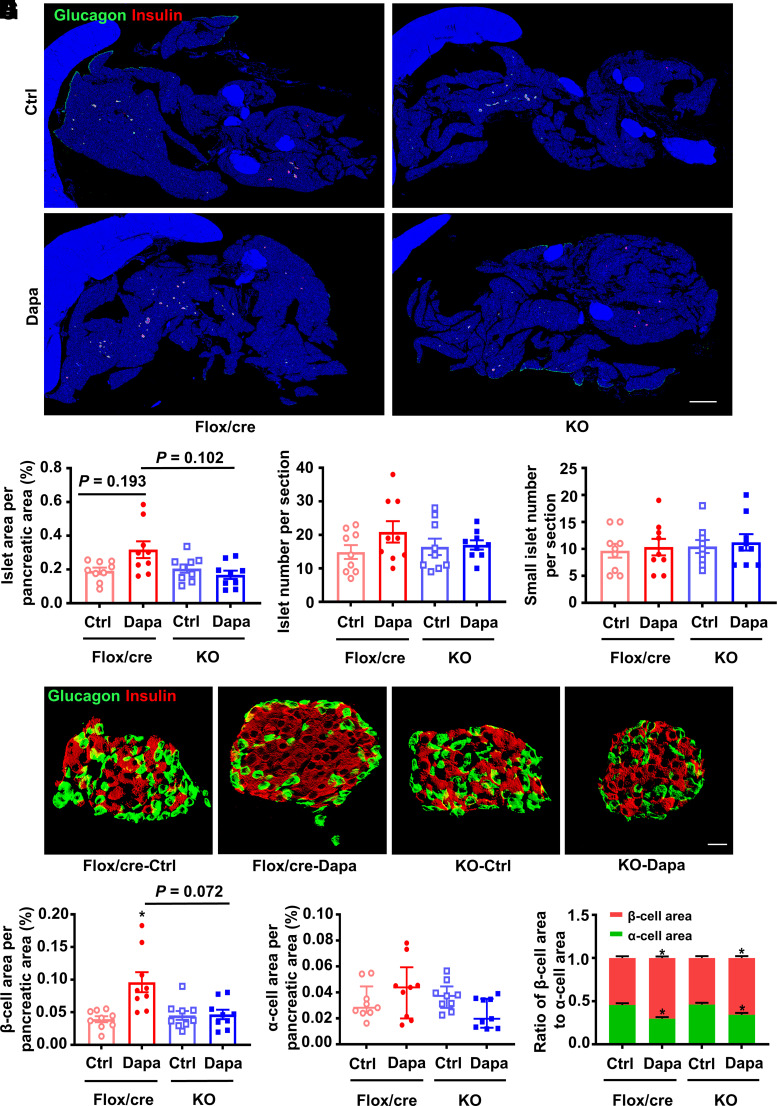
Sodium-glucose cotransporter 2 inhibitors, efficacious antidiabetic agents that have cardiovascular and renal benefits, can promote pancreatic β-cell regeneration in type 2 diabetic mice. However, the underlying mechanism remains unclear. In this study, we aimed to use multiomics to identify the mediators involved in β-cell regeneration induced by dapagliflozin. We showed that dapagliflozin lowered blood glucose level, upregulated plasma insulin level, and increased islet area in db/db mice. Dapagliflozin reshaped gut microbiota and modulated microbiotic and plasmatic metabolites related to tryptophan metabolism, especially l-tryptophan, in the diabetic mice. Notably, l-tryptophan upregulated the mRNA level of glucagon-like peptide 1 (GLP-1) production-related gene (Gcg and Pcsk1) expression and promoted GLP-1 secretion in cultured mouse intestinal L cells, and it increased the supernatant insulin level in primary human islets, which was eliminated by GPR142 antagonist. Transplant of fecal microbiota from dapagliflozin-treated mice, supplementation of l-tryptophan, or treatment with dapagliflozin upregulated l-tryptophan, GLP-1, and insulin or C-peptide levels and promoted β-cell regeneration in db/db mice. Addition of exendin 9-39, a GLP-1 receptor (GLP-1R) antagonist, or pancreatic Glp1r knockout diminished these beneficial effects. In summary, treatment with dapagliflozin in type 2 diabetic mice promotes β-cell regeneration by upregulating GLP-1 production, which is mediated via gut microbiota and tryptophan metabolism.


Conflict of interest statement

Duality of Interest. No potential conflicts of interest relevant to this article were reported.

Figures

None
Graphical abstract
Figure 1
Figure 1
Alteration of the plasma metabolomic profile induced by dapagliflozin (Dapa) in db/db mice. A: Principal component (PC) analysis plots of plasma metabolomic profiles. B: Differential plasmatic metabolites in the top 20 of VIP scores. C: Metabolic pathway analysis of differential plasmatic metabolites. The circles that are closer to the top-right diagonal region are significantly changed, and they are more likely to have significant impacts on the pathways. D: Relative levels of l-tryptophan, indoleacetate, and indolepyruvate in plasma. n = 5 − 6 mice/group. Data are mean ± SEM. Statistical analysis was performed by one-way ANOVA followed by Dunnett T3 multiple comparisons test in D. §P < 0.05 (vs. db/m); *P < 0.05 (vs. control [Ctrl]). 2,5-pyrrolidinedione, 3,3-dichloro-4-(dichloromethylene)-2,5-pyrrolidinedione; 3-methyl-N-butanamide, 3-methyl-N-(2-naphthyl)butanamide; N-γ-glutamylhistamine, N(α)-γ-l-glutamylhistamine; sig, significant; S-mercaptopyruvate, S-(4-bromophenyl)-mercaptopyruvate.
Figure 2
Figure 2
The composition of gut microbial communities after treatment with dapagliflozin (Dapa) in db/db mice. A and B: Abundance-based coverage estimator (ACE) and Simpson index to describe the α-diversity of gut microbial communities. C: Nonmetric multidimensional scaling (MDS) to describe the β-diversity of gut microbial communities. D: The top 14 maximum abundances of gut microbiota at the genus level. E: The top 30 differential gut microbiota at the genus level. F: Cladogram representation of differentially abundant taxonomic clades with linear discriminant analysis score >4. Significantly distinct taxonomic nodes are colored, and the branch areas are shaded according to the effect size of the taxa. n = 6 mice/group. Data are the mean ± SEM or median (interquartile range). Statistical analysis was performed by one-way ANOVA followed by Tukey multiple comparisons test in A or by Kruskal-Wallis test followed by Dunn multiple comparisons test in B. Ctrl, control.
Figure 3
Figure 3
The relationship among the gut microbiota, microbiotic metabolites, and GLP-1 production. A: Principal component (PC) analysis plots of microbial metabolomic profiles. B: Spearman correlation analysis between the top 30 differential gut microbiota and differential microbiotic metabolites related to l-tryptophan (Trp) metabolism. C: The number of overlapping metabolites between microbiotic and plasmatic metabolites. D and E: Relative Gcg and Pcsk1 mRNA levels in the intestinal L-cell line STC1 cells incubated with different concentrations of Trp. F: GLP-1 secretion in STC1 cells cultured with different concentrations of Trp. GI: Relative Gcg and Pcsk1 mRNA levels and GLP-1 secretion in STC1 cells incubated with Trp (10 mmol/L) or vehicle with or without CLP-3094 (CLP) (10 μmol/L). n = 4. Data are mean ± SEM. Statistical analysis was performed by one-way ANOVA followed by Dunnett multiple comparisons test in D and E, one-way ANOVA followed by Tukey multiple comparisons test in G and H, or one-way ANOVA followed by Dunnett T3 multiple comparisons test in F and I. *P < 0.05 (vs. control [Ctrl]); ‡P < 0.05 (vs. Trp).
Figure 4
Figure 4
Histological analysis in the pancreatic tissues of db/db mice receiving FMT from dapagliflozin (Dapa)- or vehicle-treated mice with or without exendin 9-39 (Ex9) for 5 weeks. A: Representative photographs of the entire pancreata immunostained for glucagon and insulin. Scale bar = 2,000 μm. B: Quantification of the islet area per pancreatic area. C: Quantification of the islet number per section. D: Quantification of the small islet number per section. An islet with a cell number less than eight is defined as a small islet. E: Representative photographs of an islet immunostained for glucagon and insulin. Scale bar = 20 μm. F: Quantification of the β-cell area per pancreatic area. G: Quantification of the α-cell area per pancreatic area. H: The ratio of β-cell area to α-cell area. n = 3 sections/mouse and 3 mice/group. Data are mean ± SEM or median (interquartile range). Statistical analysis was performed by one-way ANOVA followed by Dunnett T3 multiple comparisons test in B and C, by Kruskal-Wallis test followed by Dunn multiple comparisons test in F, or by one-way ANOVA or two-way ANOVA followed by Tukey multiple comparisons test as appropriate in D, G, and H. *P < 0.05 (vs. control [Ctrl]-FMT + vehicle).
Figure 5
Figure 5
Histological analysis in the pancreatic tissues of db/db mice treated with vehicle, l-tryptophan (Trp), or Trp combined with exendin 9-39 (Ex9) for 5 weeks. Age-matched db/m mice treated with vehicle were included as normal control (Ctrl). A: Representative photographs of the entire pancreata immunostained for glucagon and insulin. Scale bar = 2,000 μm. B: Quantification of the islet area per pancreatic area. C: Quantification of the islet number per section. D: Quantification of the small islet number per section. An islet with a cell number less than eight is defined as a small islet. E: Representative photographs of an islet immunostained for glucagon and insulin. Scale bar = 20 μm. F: Quantification of the β-cell area per pancreatic area. G: Quantification of the α-cell area per pancreatic area. H: Ratio of β-cell area to α-cell area. n = 3 sections/mouse and 3 mice/group. Data are mean ± SEM. Statistical analysis was performed by one-way ANOVA followed by Dunnett T3 multiple comparisons test in BD and F, or by one-way ANOVA or two-way ANOVA followed by Tukey multiple comparisons test as appropriate in G and H. §P < 0.05 (vs. db/m); *P < 0.05 (vs. Ctrl); ‡P < 0.05 (vs. Trp).
Figure 6
Figure 6
Histological analysis in the pancreatic tissues of db/db mice treated with vehicle, dapagliflozin (Dapa), or Dapa with exendin 9-39 (Ex9) for 5 weeks. Age-matched db/m mice treated with vehicle served as normal control (Ctrl). A: Representative photographs of the entire pancreata immunostained for glucagon and insulin. Scale bar = 2,000 μm. B: Quantification of the islet area per pancreatic area. C: Quantification of the islet number per section. D: Quantification of the small islet number per section. An islet with a cell number less than eight is defined as a small islet. E: Representative photographs of an islet immunostained for glucagon and insulin. Scale bar = 20 μm. F: Quantification of the β-cell area per pancreatic area. G: Quantification of the α-cell area per pancreatic area. H: Ratio of β-cell area to α-cell area. n = 3–4 sections/mouse and 4 mice/group. Data are mean ± SEM or median (interquartile range). Statistical analysis was performed by one-way ANOVA followed by Dunnett T3 multiple comparisons test in C, D, and G, two-way ANOVA followed by Tukey multiple comparisons test in H, or Kruskal-Wallis test followed by Dunn multiple comparisons test in B and F. §P < 0.05 (vs. db/m); *P < 0.05 (vs. Ctrl); ‡P < 0.05 (vs. Dapa).
Figure 7
Figure 7
Histological analysis in the pancreatic tissues of diabetic Glp1rpan−/− (KO) mice and Flox/Cre littermates treated with dapagliflozin (Dapa) or vehicle control (Ctrl) for 6 weeks. Diabetes was induced by high-fat diet and streptozotocin before the treatment. A: Representative photographs of the entire pancreata immunostained for glucagon and insulin. Scale bar = 2,000 μm. B: Quantification of the islet area per pancreatic area. C: Quantification of the islet number per section. D: Quantification of the small islet number per section. An islet with a cell number less than eight is defined as a small islet. E: Representative photographs of an islet immunostained for glucagon and insulin. Scale bar = 20 μm. F: Quantification of the β-cell area per pancreatic area. G: Quantification of the α-cell area per pancreatic area. H: The ratio of β-cell area to α-cell area. n = 3 sections/mouse and 3 mice/group. Data are mean ± SEM or median (interquartile range). Statistical analysis was performed by one-way ANOVA or two-way ANOVA followed by Tukey multiple comparisons test as appropriate in C, D, and H, one-way ANOVA followed by Dunnett T3 multiple comparisons test in B and F, or Kruskal-Wallis test followed by Dunn multiple comparisons test in G. *P < 0.05 (vs. Ctrl in the same genotype).

References

    1. Cosentino F, Grant PJ, Aboyans V, et al. .; ESC Scientific Document Group . 2019 ESC guidelines on diabetes, pre-diabetes, and cardiovascular diseases developed in collaboration with the EASD. Eur Heart J 2020;41:255–323 - PubMed
    1. Koepsell H. The Na+-D-glucose cotransporters SGLT1 and SGLT2 are targets for the treatment of diabetes and cancer. Pharmacol Ther 2017;170:148–165 - PubMed
    1. Wiviott SD, Raz I, Bonaca MP, et al. .; DECLARE–TIMI 58 Investigators . Dapagliflozin and cardiovascular outcomes in type 2 diabetes. N Engl J Med 2019;380:347–357 - PubMed
    1. Perkovic V, Jardine MJ, Neal B, et al. .; CREDENCE Trial Investigators . Canagliflozin and renal outcomes in type 2 diabetes and nephropathy. N Engl J Med 2019;380:2295–2306 - PubMed
    1. Al Jobori H, Daniele G, Adams J, et al. . Empagliflozin treatment is associated with improved β-cell function in type 2 diabetes mellitus. J Clin Endocrinol Metab 2018;103:1402–1407 - PMC - PubMed

MeSH terms