. 2024 Jun 4;84(11):1764-1780.
doi: 10.1158/0008-5472.CAN-22-2945.

A Histone Methylation-MAPK Signaling Axis Drives Durable Epithelial-Mesenchymal Transition in Hypoxic Pancreatic Cancer

Affiliations

A Histone Methylation-MAPK Signaling Axis Drives Durable Epithelial-Mesenchymal Transition in Hypoxic Pancreatic Cancer

Brooke A Brown et al. Cancer Res. .

Abstract

The tumor microenvironment in pancreatic ductal adenocarcinoma (PDAC) plays a key role in tumor progression and response to therapy. The dense PDAC stroma causes hypovascularity, which leads to hypoxia. Here, we showed that hypoxia drives long-lasting epithelial-mesenchymal transition (EMT) in PDAC primarily through a positive-feedback histone methylation-MAPK signaling axis. Transformed cells preferentially underwent EMT in hypoxic tumor regions in multiple model systems. Hypoxia drove a cell autonomous EMT in PDAC cells, which, unlike EMT in response to growth factors, could last for weeks. Furthermore, hypoxia reduced histone demethylase KDM2A activity, suppressed PP2 family phosphatase expression, and activated MAPKs to post-translationally stabilize histone methyltransferase NSD2, leading to an H3K36me2-dependent EMT in which hypoxia-inducible factors played only a supporting role. Hypoxia-driven EMT could be antagonized in vivo by combinations of MAPK inhibitors. Collectively, these results suggest that hypoxia promotes durable EMT in PDAC by inducing a histone methylation-MAPK axis that can be effectively targeted with multidrug therapies, providing a potential strategy for overcoming chemoresistance.

Significance: Integrated regulation of histone methylation and MAPK signaling by the low-oxygen environment of pancreatic cancer drives long-lasting EMT that promotes chemoresistance and shortens patient survival and that can be pharmacologically inhibited. See related commentary by Wirth and Schneider, p. 1739.


Conflict of interest statement

Conflicts of interest: The authors declare no conflicts of interest.

Figures
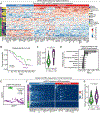
Figure 1.
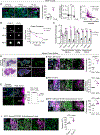
Figure 1.. EMT and hypoxia marker enrichment are correlated in human PDAC tumors and ductal cells.
(A) CPTAC PDAC tumor samples were clustered using non-negative matrix factorization (NMF) of protein data for the pcEMT signature. Heatmap entries indicate z-scored expression. Left vertical side bar (green, purple) indicates assigned NMF cluster. The next three vertical side bars indicate Collisson, Moffit, and Bailey classifications (4). Horizontal side bar (red, blue) indicates phenotype associated with each protein (22). (B) Kaplan-Meier analysis for CPTAC PDAC patient survival, stratifying based on pcEMT with log-rank test. (C) Hallmark Hypoxia protein enrichment was calculated using GSVA and compared between M-high and -low tumors, with Mann-Whitney U test. (D) Partial rank correlation coefficients (PRCCs) of indicated variables were calculated with respect to mesenchymal pcEMT (pcEMT-M) enrichment. Hallmark Hypoxia enrichment from calculations in (C). Tissue content estimates were from CPTAC data. Error bars denote PRCC 95% confidence intervals. (E) Consensus clustering of human ductal cell scRNA-seq data (24) was performed on a 2D UMAP based on pcEMT-M features, resulting in groupings with shared epithelial features but differentially enriched for mesenchymal features (E+/M− and E+/M+). (F) Heatmap showing ductal cell pcEMT gene expression (normalized UMIs), annotated by clusters from (E). (G) mRNA enrichment of Hallmark Hypoxia signature (Pagoda2 scores) was computed and compared between E+/M+ and E+/M− ductal cells, Mann-Whitney U test.
Figure 2.
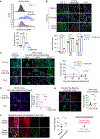
Figure 2.. Hypoxia drives a bona fide EMT in PDAC.
(A) HPAF-II cells were cultured at 21%, 7%, or 1% O2 for 120 hr, and immunofluorescence microscopy was performed as indicated, n = 3. One-way ANOVA with Tukey’s multiple comparison test (vimentin). Mixed-effects analysis with Tukey’s multiple comparison test (E-cadherin). Linear regression for E-cadherin and vimentin described in Methods. (B) GFP-expressing HPAF-II cells were cultured in 21% or 1% O2 for 96 hr. Fluorescence microscopy was performed, and cluster shape factors were calculated. Data represented as mean ± s.e.m. p < 0.0001 for slopes comparison, see Methods. (C) HPAF-II cells were cultured for 120 hr in 21% or 1% O2, and qRT-PCR was performed for indicated markers, with CASC3 used for normalization. n = 3, with t test per transcript. (D) H&E and immunohistochemistry for Hypoxyprobe (HYP) and CD31 was performed for murine normal pancreas and PDX tumors. Representative image shown, n = 3. (E) Sections of normal mouse pancreas or PDX 395 tumors were stained as indicated. Image analysis was performed for PDX 395 tumors and quantified for the percent CD31+ cells that were HYP+/−. n = 3, t test. (F) PDX 395 tumor sections were stained to quantify COXIV+/vimentin+ cells that were HYP+/−. n = 4, t test. Dotted line separates HYP+/− regions. (G) KPCY tumor sections were stained as indicated, and image analysis was performed to quantify YFP+/vimentin+ cells that were HYP+/−. Data represented as fold-change due to variability across mice for the spontaneous model. n = 4, t test. (H) Subcutaneous PD7591 cell tumors were stained as indicated, with quantification of YFP+/vimentin+ cells that were HYP+/−. n = 6, t test. (I) PD7591 cell subcutaneous tumor sections were stained as indicated, with quantification for YFP+/HYP+ cells that were Ecadhigh/low. Arrow denotes an HYP+/Ecadlow cell. n = 4, with t test. * p < 0.05, ** p < 0.01, *** p < 0.001, **** p < 0.0001
Figure 3.
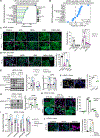
Figure 3.. Hypoxia-driven EMT occurs heterogeneously and is more durable than growth factor-driven EMT.
(A) HPAF-II cells were cultured in 21% O2 ± 10 ng/mL TGFβ and 50 ng/mL HGF or cultured in 1% O2 for 120 hr. Vimentin flow cytometry was performed. Representative histograms for single replicates are shown, with data for n = 3 in the bar plot. One-way ANOVA with Tukey’s pairwise comparisons against the 21% O2 control. (B) PDAC cells from three backgrounds were cultured as in (A). Immunofluorescence microscopy was performed as indicated. n = 3, two-way ANOVA with Tukey’s multiple comparisons test. (C) HPAF-II cells were cultured as in (A), re-plated on coverslips, and cultured in 21% O2 without growth factors for ≤ 120 hr. At indicated times, immunofluorescence microscopy was performed as indicated. n = 3, data represented as mean ± s.e.m. p < 0.0001 for nonlinear regression comparing slopes. (D) 120 hr after treatment withdrawal from 10 ng/mL TGFβ + 50 ng/mL HGF or 1% O2 culture. HPAF-II cells were stained to quantify dividing, vimentin+ cells (examples encircled). n = 3, with t test. (E) Orthotopic HPAF-II hypoxia fate-mapping tumor sections were stained as indicated. Image analysis quantified fraction of GFP+ (once-hypoxic) cells that were vimentin+ and Hypoxyprobe-negative (HYP™) or positive (HYP+). n = 6, with t test. (F) Explanted tumors described in (E) were disaggregated and flow-sorted based on DsRed and GFP. Indicated populations were cultured in 21% O2 for 12 days, then stained with indicated antibodies. n = 4, with t test. * p < 0.05, ** p < 0.01, **** p < 0.0001
Figure 4.
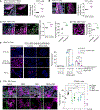
Figure 4.. Hypoxia promotes EMT through MAPK signaling initiated by suppressed phosphatase expression.
(A) Overrepresentation analysis for indicated KEGG pathways based on kinases described in the text. Analysis based on CPTAC PDAC Discovery Study data (4). Kinase count and ratio indicate the number and fraction in each gene set with significant, positive correlations with Hallmark Hypoxia enrichment. (B) Coefficients are shown for regularized linear regression of Hallmark Hypoxia Pagoda2 score based on KEGG signaling pathway Pagoda2 scores for scRNA-seq data (24). Error bars denote 95% confidence intervals. (C) HPAF-II cells were cultured for 120 hr in 21% or 1% O2 with 1 μM CI-1040 (MEKi), 10 μM SP600125 (JNKi), 10 μM SB203580 (p38i), or DMSO. n = 3, two-way ANOVA with Sidak’s multiple comparisons test. (D) PDX 395 cells were cultured in 1% O2 with 1 μM CI-1040 (MEKi), 10 μM SP600125 (JNKi), a combination, or DMSO for 120 hr. Cells were stained as indicated, and immunofluorescence microscopy and image analysis were performed. n = 3, one-way ANOVA with Dunnett’s multiple comparison test. (E) HPAF-II cells were cultured in 21% O2 ± 10 ng/mL TGFβ + 50 ng/mL HGF, or in 1% O2, and lysed 24 and 120 hr after treatment. Immunoblotting was performed as indicated. n = 3, one-way ANOVA with Tukey’s multiple comparisons test. (F) HPAF-II cells were cultured for 120 hr in 21 or 1% O2 with 10 μM PP2 (Src family kinase inhibitor, SFKi) or DMSO, and immunofluorescence microscopy was performed for nuclear c-Jun. n = 3, mixed-effects analysis with Tukey’s multiple comparisons test. (G) HPAF-II cells were treated as in (F), and lysates were analyzed by immunoblotting as indicated. n = 3, two-way ANOVA with Sidak’s multiple comparison test. (H) HPAF-II cells were cultured in 21% O2 ± 10 ng/mL TGFβ and 50 ng/mL HGF or in 1% O2 for 120 hr. Cells were pre-treated with 10 μM PP2 or DMSO 24 hr prior to hypoxia or growth factor treatment. n = 3, two-way ANOVA with Sidak’s multiple comparison test. (I) qRT-PCR was performed for PP1A, PP2A, and PP2C subunit transcripts for HPAF-II cells treated as in (D) for 120 hr, with CASC3 used for normalization. n = 3, one-way ANOVA with Tukey’s multiple comparisons test. (J) HPAF-II cells were cultured for 120 hr in 21% O2 with 5 μM LB100 (PP2Ai), 1.5 μM sanguinarine chloride (PP2Cδi), or DMSO. n = 3, one-way ANOVA with Tukey’s multiple comparisons test. * p < 0.05, ** p < 0.01, *** p < 0.001, **** p < 0.0001
Figure 5.
Figure 5.. Hypoxic PDAC tissue is enriched for MAPK markers, and MAPK inhibition prevents hypoxic cell EMT.
(A) KPCY tumor sections were stained as indicated, and YFP+/c-Jun+ cells that were Hypoxyprobe (HYP) +/− were quantified and reported as fold-changes from HYP− to HYP+. n = 3, with t test. Dotted line separates HYP+/− regions. (B) 7160c2 subcutaneous tumor sections were stained as indicated, and image analysis was performed as in (A). n = 4, with t test. (C) PDX 395 orthotopic tumor sections were stained as indicated, and c-Jun+ cells that were HYP+/− or vimentin+/− were quantified. c-Jun+ data reported as fold-change in percent c-Jun+ cells that were HYP+/−. n = 3, with t test. (D) PDX 395 tumor sections were stained as indicated, and the percent of vimentin+/− cells that were pERK+ was quantified. n = 3, with t test. (E) HPAF-II cells were cultured in 21% O2 ± 10 ng/mL TGFβ + 50 ng/mL HGF or in 1% O2 for 120 hr. Cells were re-plated for 120 hr at 21% O2 without exogenous growth factors and with 1 μM CI-1040 (MEKi) and 10 μM SP600125 (JNKi) or DMSO. At times indicated, cells were stained for vimentin. Immunofluorescence microscopy was performed to quantify percentage of vimentin+ cells. n = 3, two-way ANOVA with Tukey’s multiple comparisons test. (F) Mice bearing orthotopic PDX 395 tumors were treated for nine days with selumetinib (MEKi), SP600125 (JNKi), selumetinib+SP600125, or vehicle. Tumor sections were stained for COXIV, HYP, and vimentin, and image analysis was performed. n = 5 – 6, two-way ANOVA with Tukey’s multiple comparisons test. * p < 0.05, ** p < 0.01, *** p < 0.001, **** p < 0.0001
Figure 6.
Figure 6.. HIFs play a supporting role in hypoxia-mediated EMT.
(A,B) HPAF-II cells were transfected with HIF-1α or HIF-2α siRNA, both siRNAs, or control siRNA. 24 hr later, cells were switched to 1% O2 or maintained in 21% O2 for 120 hr. (A) Immunofluorescence microscopy was performed, with quantification for vimentin+ cells. n = 3, two-way ANOVA with Tukey’s multiple comparisons test. (B) qRT-PCR was performed for indicated transcripts, with CASC3 used for normalization. n = 3, two-way ANOVA with Tukey’s multiple comparisons test. (C) Immunofluorescence microscopy was performed on HPAF-II cells stably expressing HIF-1α and HIF-2α or control shRNAs. Cells were cultured in 21% or 1% O2 for 120 hr prior to fixing and staining as indicated. n = 3, two-way ANOVA with Tukey’s multiple comparisons test. (D) HPAF-II cells were pre-treated with 1 μM CI-1040 (MEKi), 10 μM SP600125 (JNKi), a combination, or DMSO for 24 hr, then cultured in 21 or 1% O2 for 4 hr. n = 3, two-way ANOVA with Tukey’s multiple comparisons test. (E) HIF1A qRT-PCR was performed for HPAF-II cells cultured for 120 hr in 21% or 1% O2 with 1 μM CI-1040 (MEKi),10 μM SP600125 (JNKi), a combination, or DMSO. CASC3 used as normalization control. n = 3, two-way ANOVA with Tukey’s multiple comparisons test, comparisons against controls. * p < 0.05, ** p < 0.01, *** p < 0.001, **** p < 0.0001
Figure 7.
Figure 7.. Hypoxia reduces KDM2A activity and stabilizes NSD2 to promote histone methylation-dependent EMT.
(A) HPAF-II cells were cultured in 21% O2 ± 10 ng/mL TGFβ + 50 ng/mL HGF or in 1% O2 for 120 hr, and H3K36 dimethylation (H3K36me2) was measured by immunofluorescence microscopy. n = 3, mixed-effects analysis with Tukey’s multiple comparisons test. (B-C) Michaelis-Menten saturation curves were created with Lineweaver-Burk plots for KDM2A binding kinetics for (B) H3K36me2 and (C) oxygen, with velocity (V) reported as disintegration parts per minute (dpm). Data shown for a representative run, with solid lines corresponding to model fits. (D) KPCY-derived cell lines 3077c4, 6419c5, and 6694c2 were cultured in 21% or 1% O2 for 120 hr. Cells were then fixed and stained as indicated, and immunofluorescence microscopy was performed. n = 3, mixed-effects analysis for H3K36me2 per cell line. (E) Immunofluorescence microscopy was performed for NSD2 expression in HPAF-II cells treated as in (A). n = 3, mixed-effects analysis with Tukey’s multiple comparisons test. (F) HPAF-II cells were cultured for 120 hr in 21% O2 with 5 μM LB100 (PP2Ai), 1.5 μM sanguinarine chloride (PP2Cδi), or DMSO. Immunofluorescence microscopy was performed for NSD2. n = 3, mixed-effects analysis with Tukey’s multiple comparisons. (G) HPAF-II cells were transfected with control or NSD2 siRNA. 24 hr later, cells were treated as in (A) for 120 hr. Immunofluorescence microscopy was performed as indicated. n = 3, two-way ANOVA for vimentin positivity with Sidak’s multiple comparisons test and mixed-effects analysis for H3K36me2 with Tukey’s multiple comparisons test. (H) HPAF-II cells were cultured in 1% O2 with 1 μM CI-1040 (MEKi), 10 μM SP600125 (JNKi), and 1.5 μM sanguinarine chloride (PP2Cδi), or DMSO for 120 hr. n = 3, mixed-effects analysis with Tukey’s multiple comparisons test. * p < 0.05, ** p < 0.01, *** p < 0.001
Figure 8.
Figure 8.. Hypoxia promotes EMT through an integrated histone methylation and MAPK mechanism.
Hypoxia suppresses KDM2A activity resulting in dimethylation of H3K36, which in turn suppresses expression of protein phosphatase subunits. Decreased protein phosphatase expression promotes SFK and MAPK signaling to stabilize NSD2, HIF-1α, and nuclear c-Jun expression. Elevated NSD2 expression further promotes H3K36 dimethylation, reinforcing the integrated kinase signaling/histone methylation regulatory loop. Collectively, this promotes expression of EMT-regulating genes.

References

    1. Koong AC, Mehta VK, Le QT, Fisher GA, Terris DJ, Brown JM, et al. Pancreatic tumors show high levels of hypoxia. Int J Radiat Oncol Biol Phys 2000;48:919–22 - PubMed
    1. Katsuta E, Qi Q, Peng X, Hochwald SN, Yan L, Takabe K. Pancreatic adenocarcinomas with mature blood vessels have better overall survival. Sci Rep 2019;9:1310. - PMC - PubMed
    1. Lee KE, Spata M, Bayne LJ, Buza EL, Durham AC, Allman D, et al. Hif1a Deletion Reveals Pro-Neoplastic Function of B Cells in Pancreatic Neoplasia. Cancer Discov 2016;6:256–69 - PMC - PubMed
    1. Cao L, Huang C, Cui Zhou D, Hu Y, Lih TM, Savage SR, et al. Proteogenomic characterization of pancreatic ductal adenocarcinoma. Cell 2021;184:5031–52 e26 - PMC - PubMed
    1. Chang Q, Jurisica I, Do T, Hedley DW. Hypoxia predicts aggressive growth and spontaneous metastasis formation from orthotopically grown primary xenografts of human pancreatic cancer. Cancer Res 2011;71:3110–20 - PubMed