. 2024 Mar 28;187(7):1801-1818.e20.
doi: 10.1016/j.cell.2024.02.019. Epub 2024 Mar 11.

The underappreciated diversity of bile acid modifications

Affiliations

The underappreciated diversity of bile acid modifications

Ipsita Mohanty et al. Cell. .

Abstract

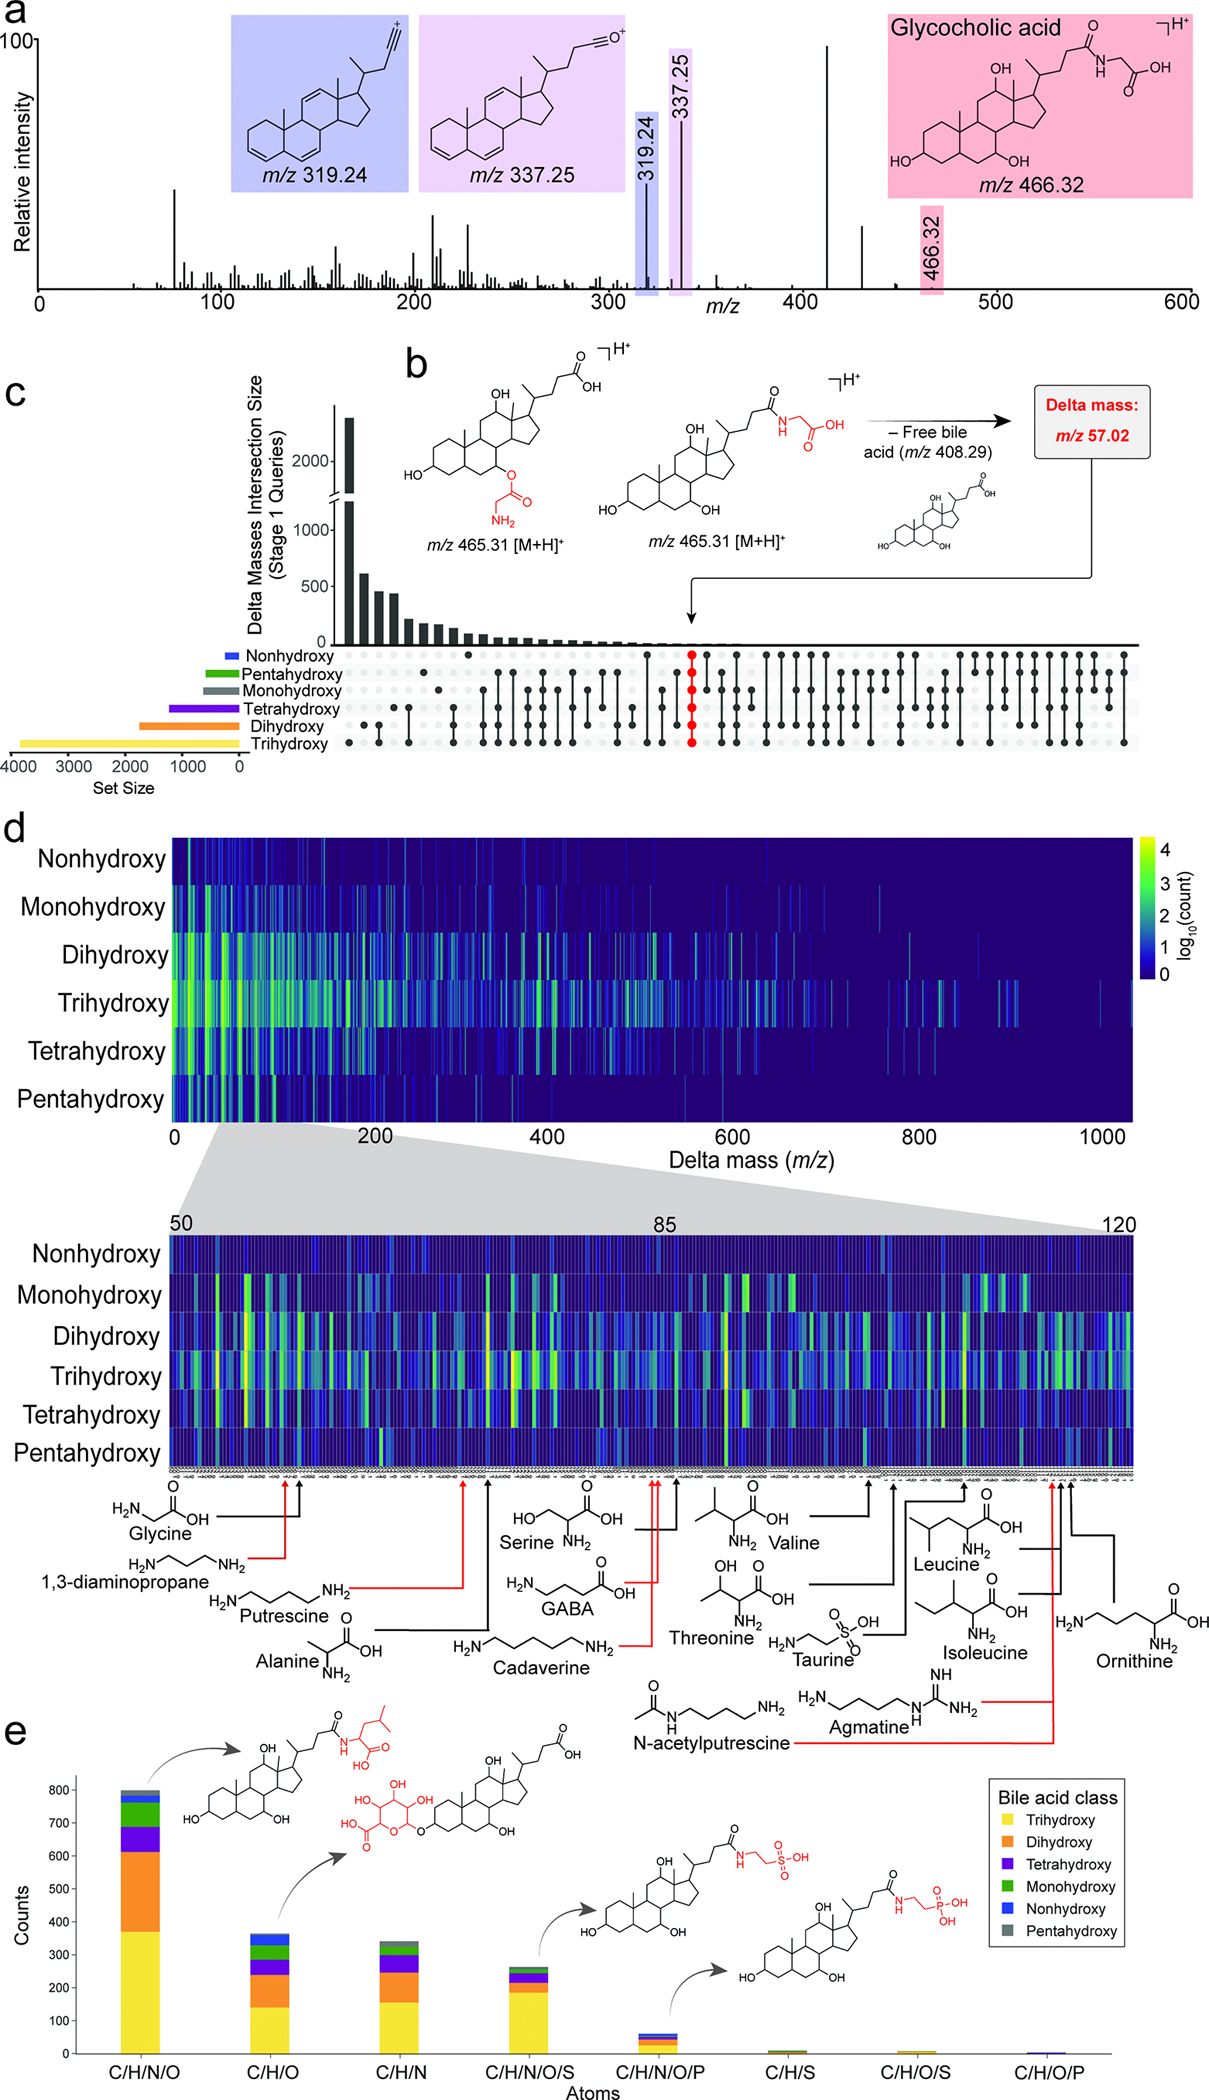
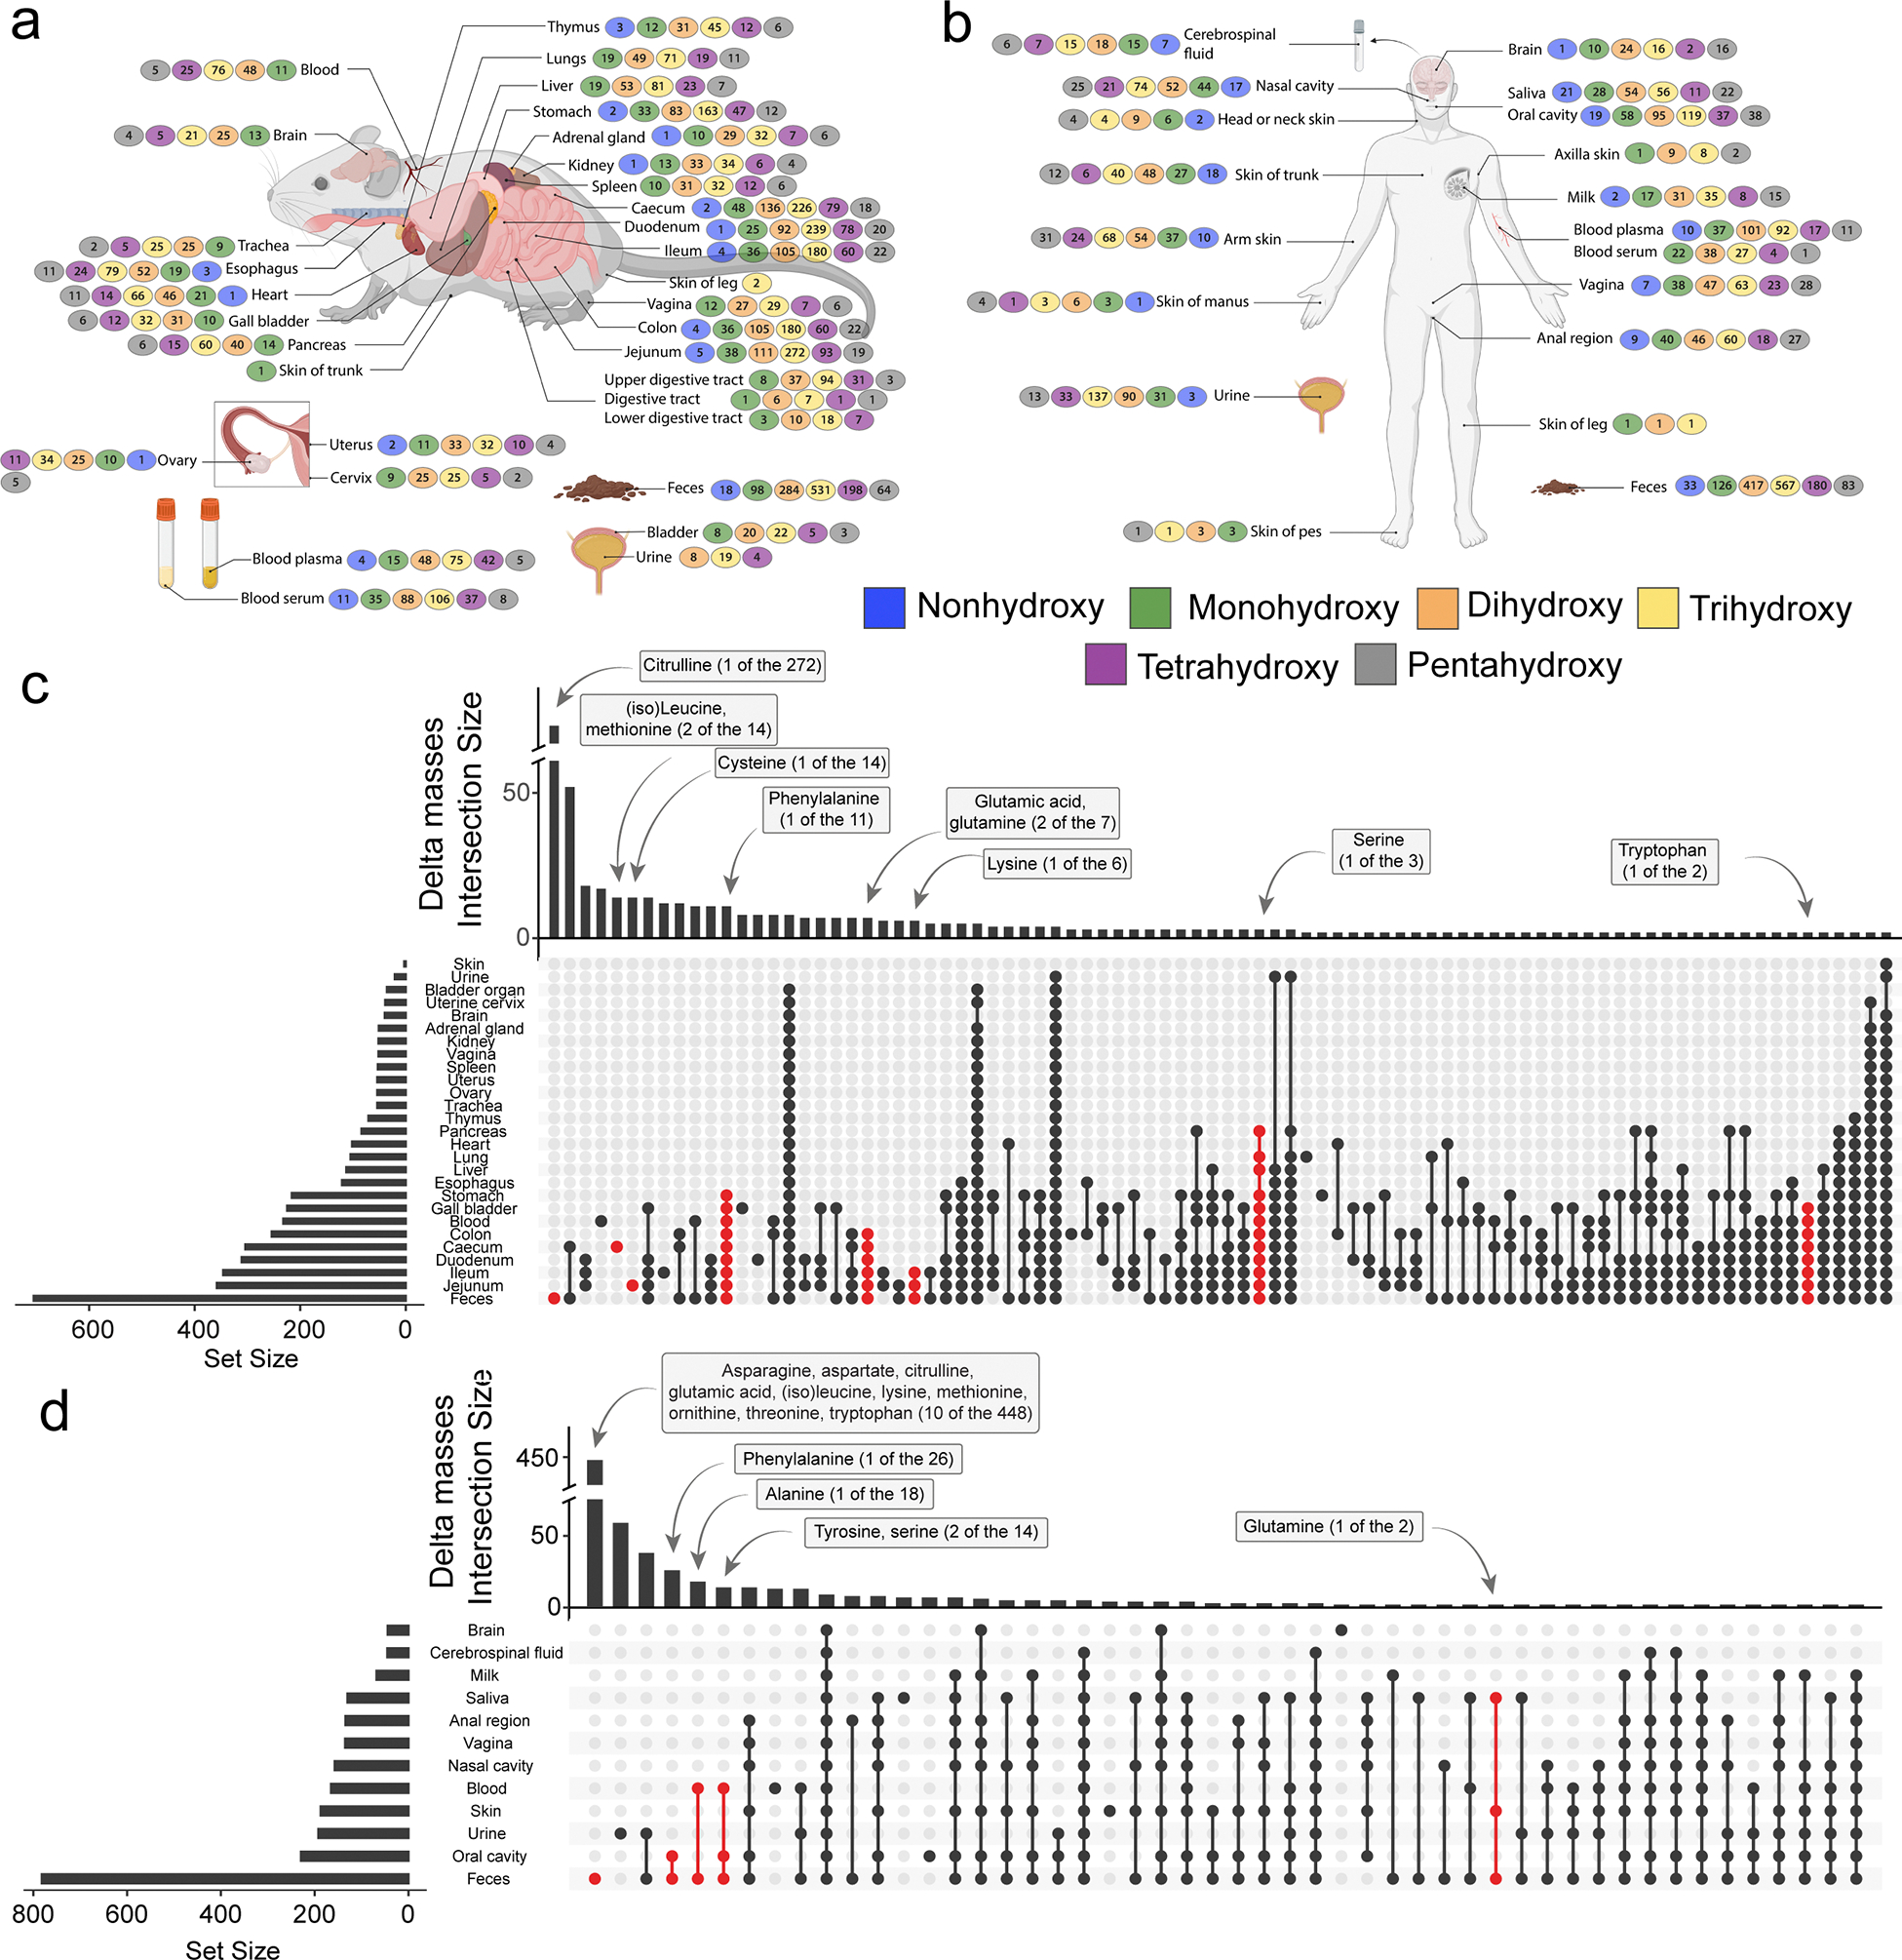
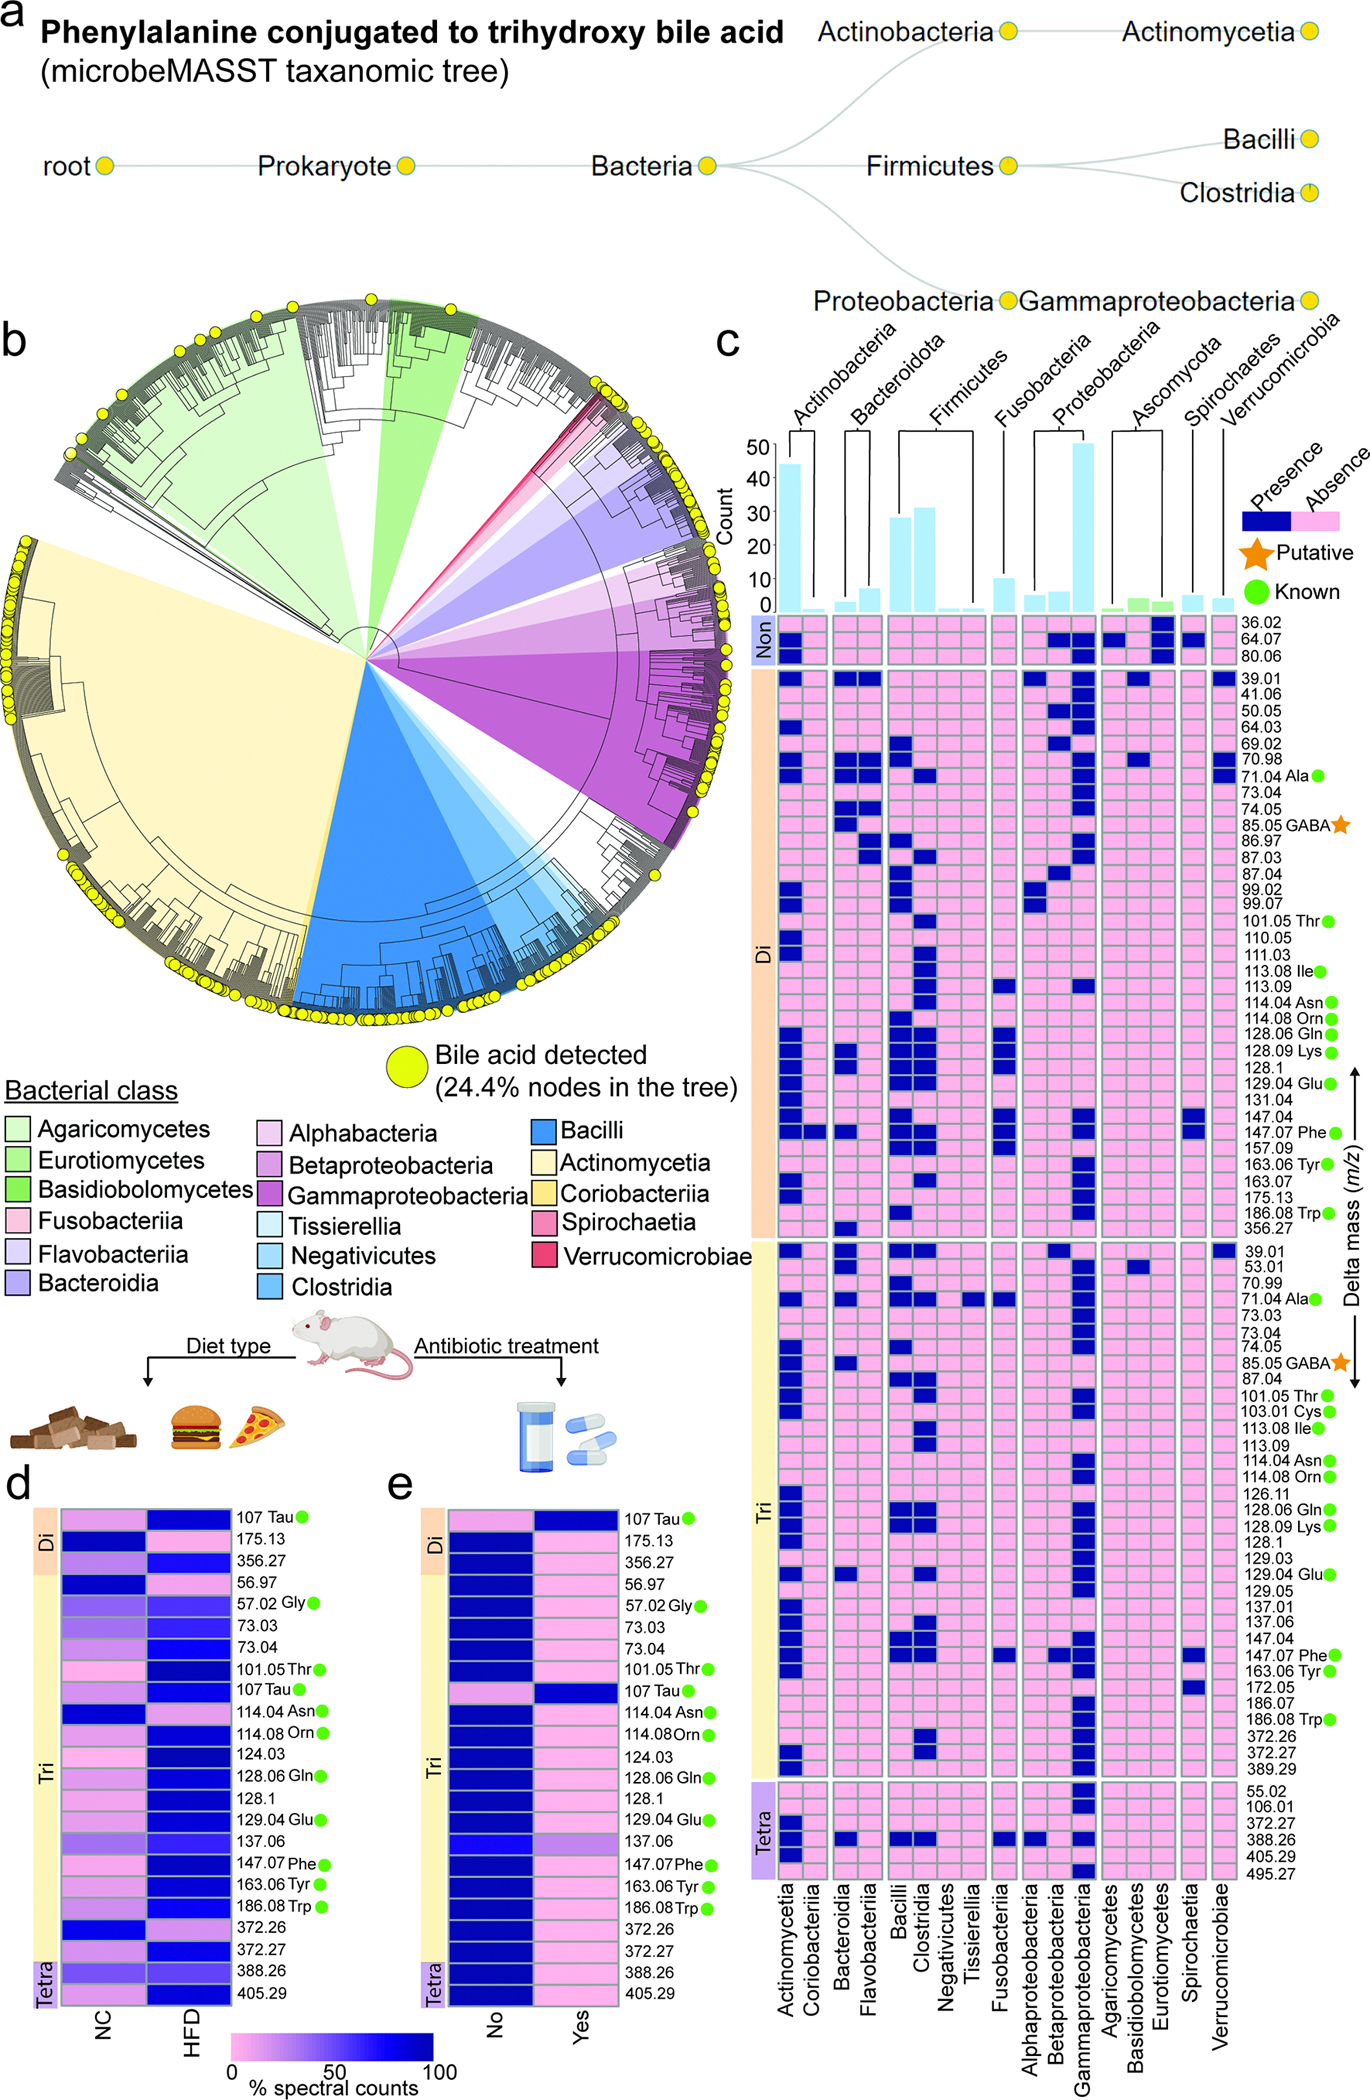
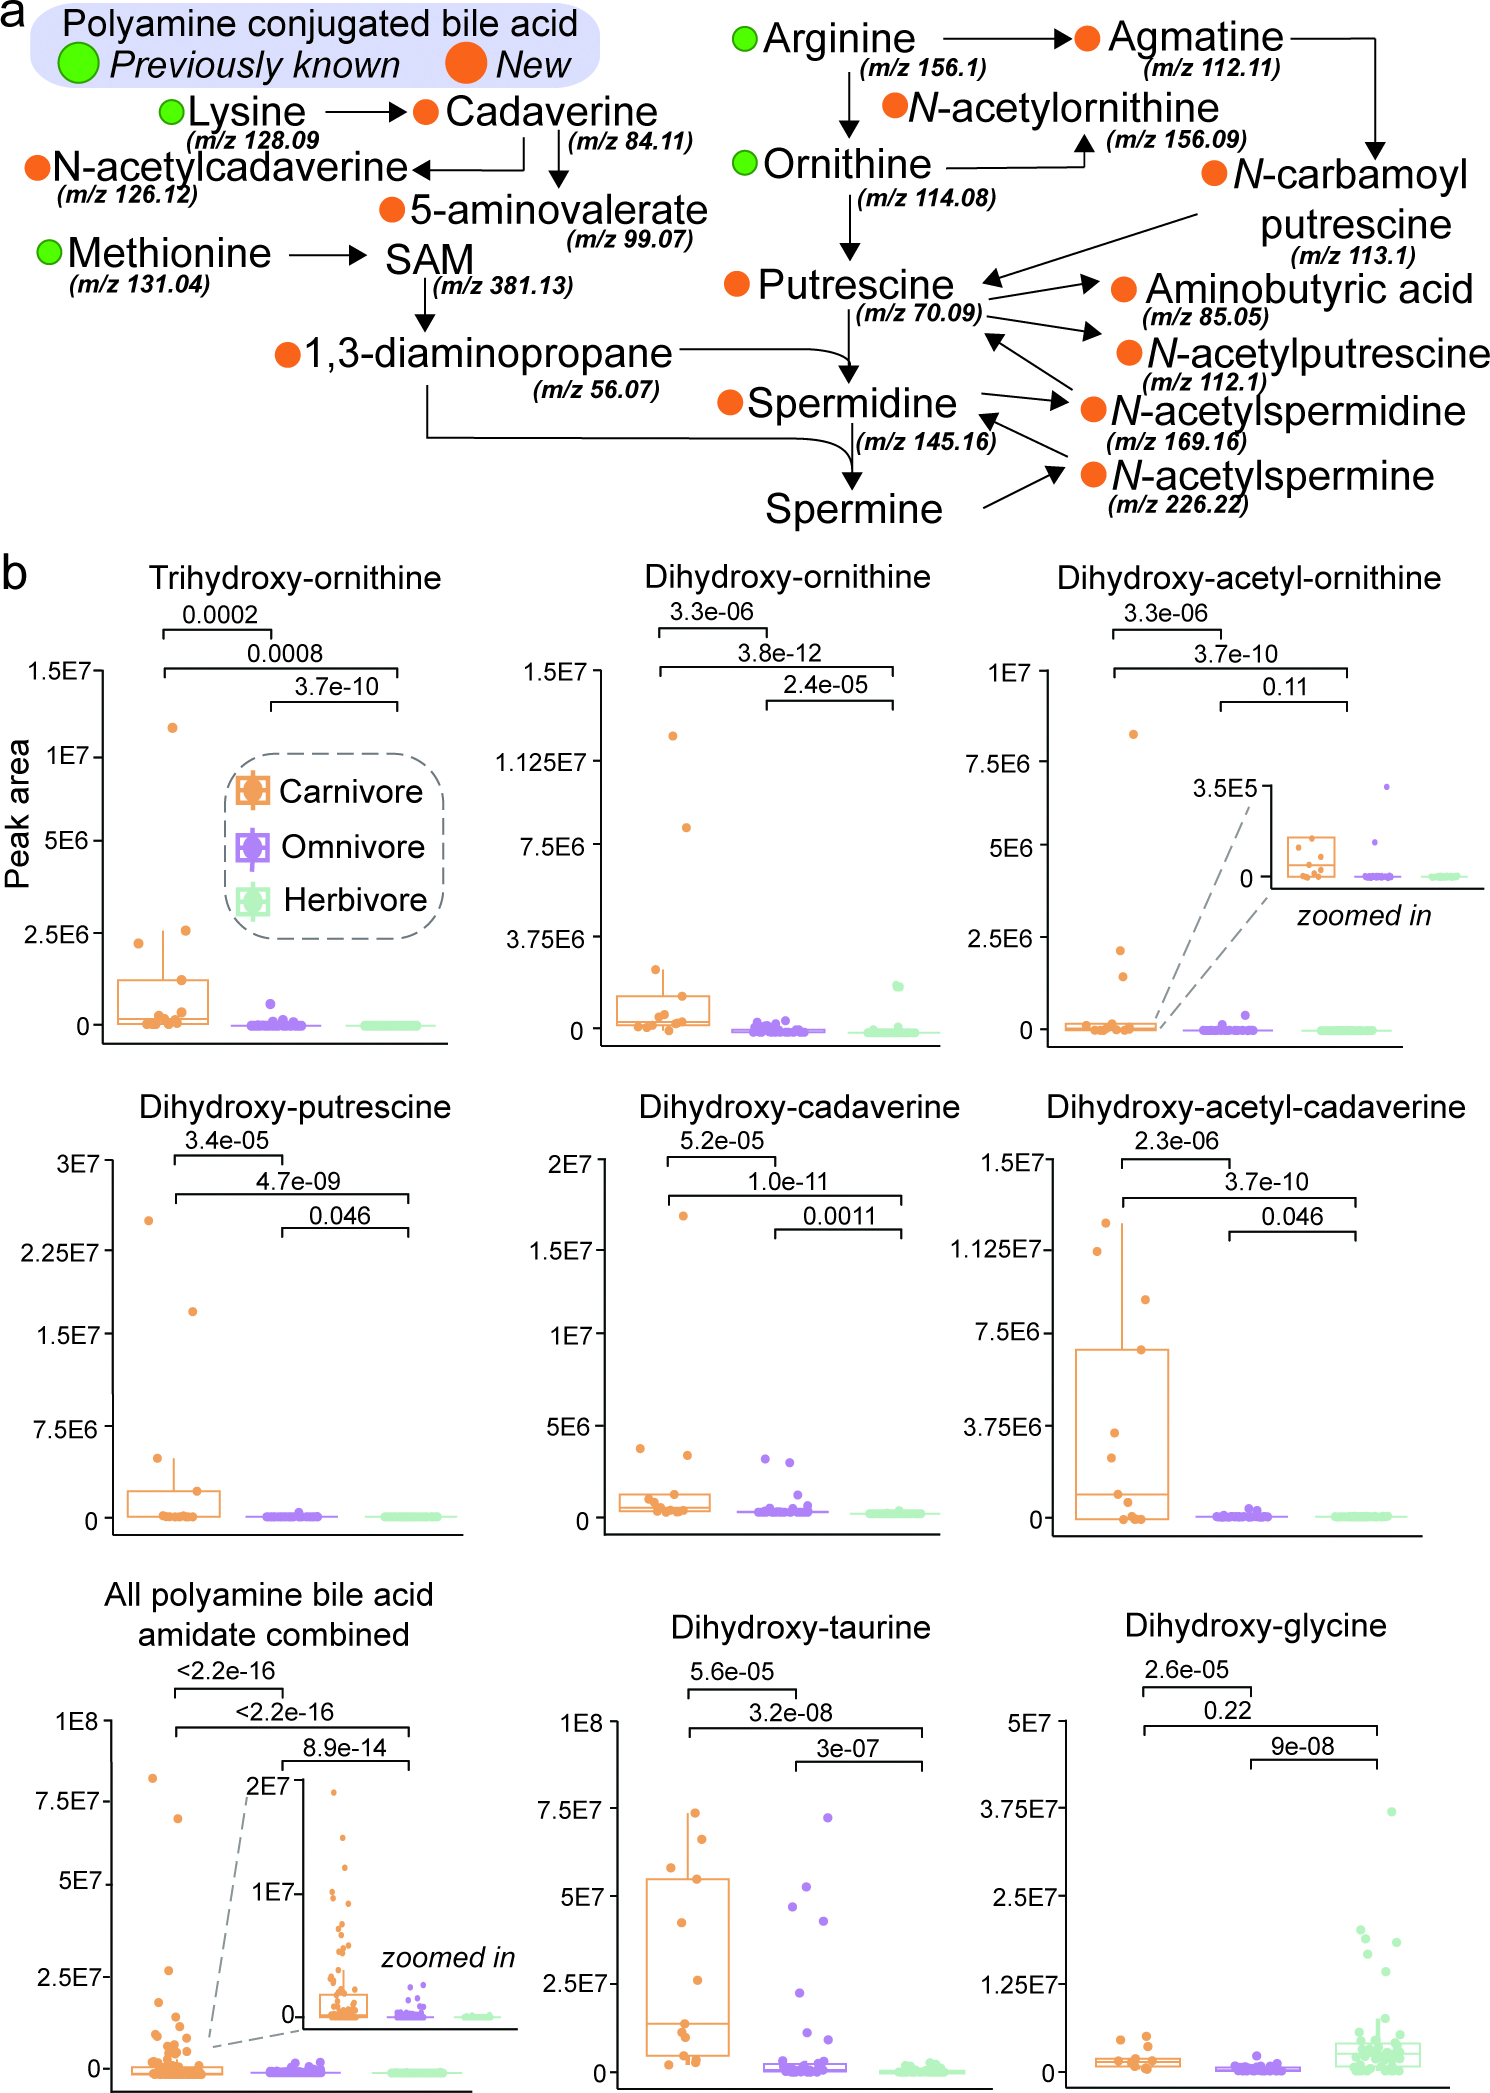
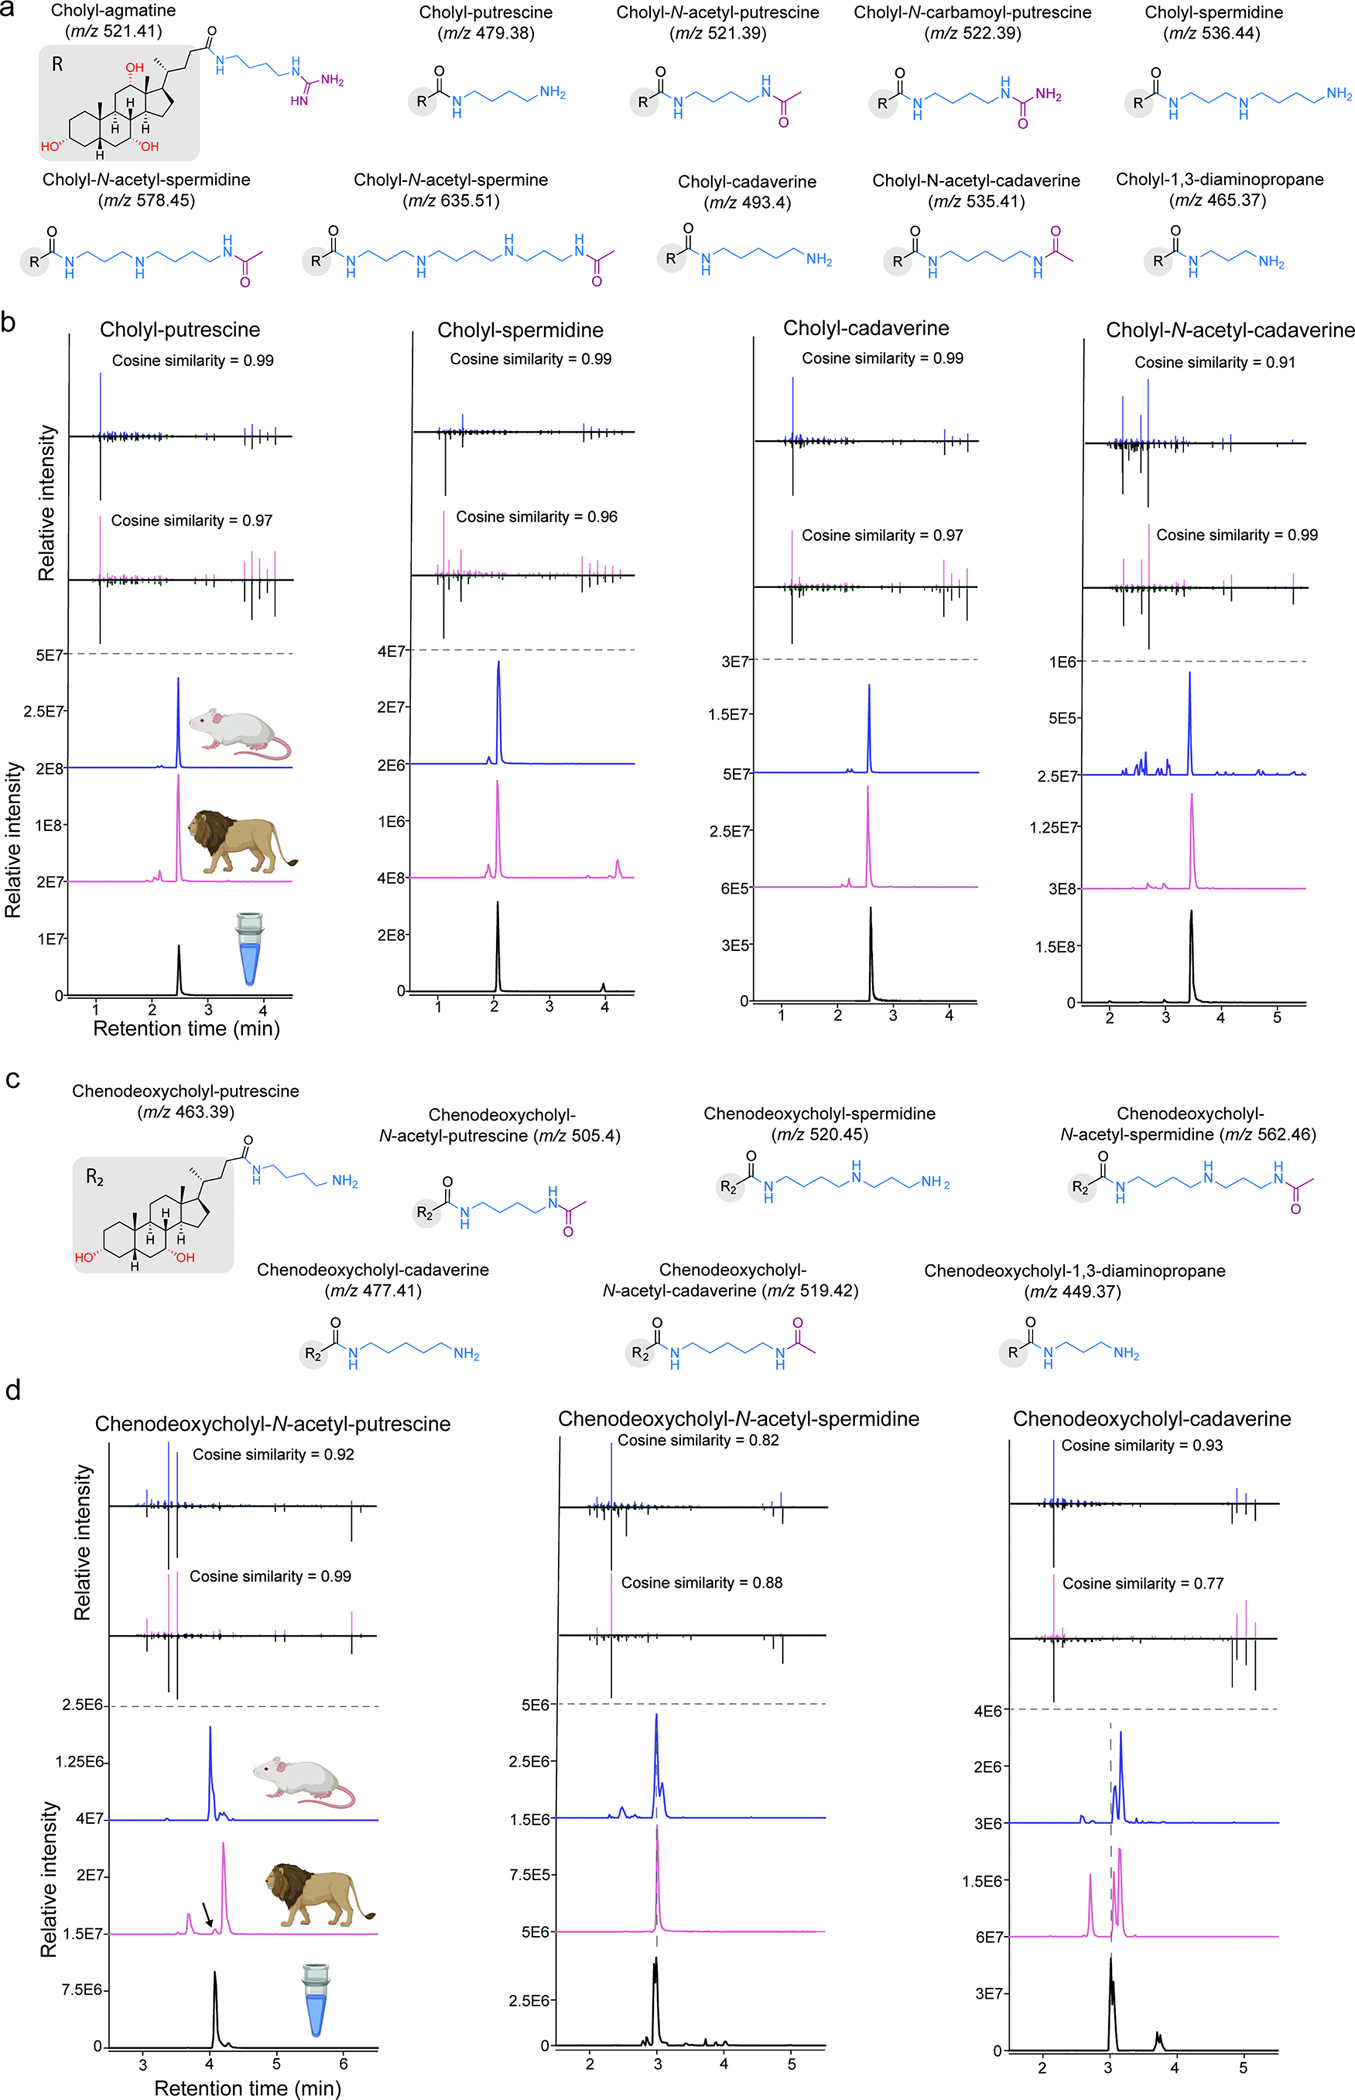
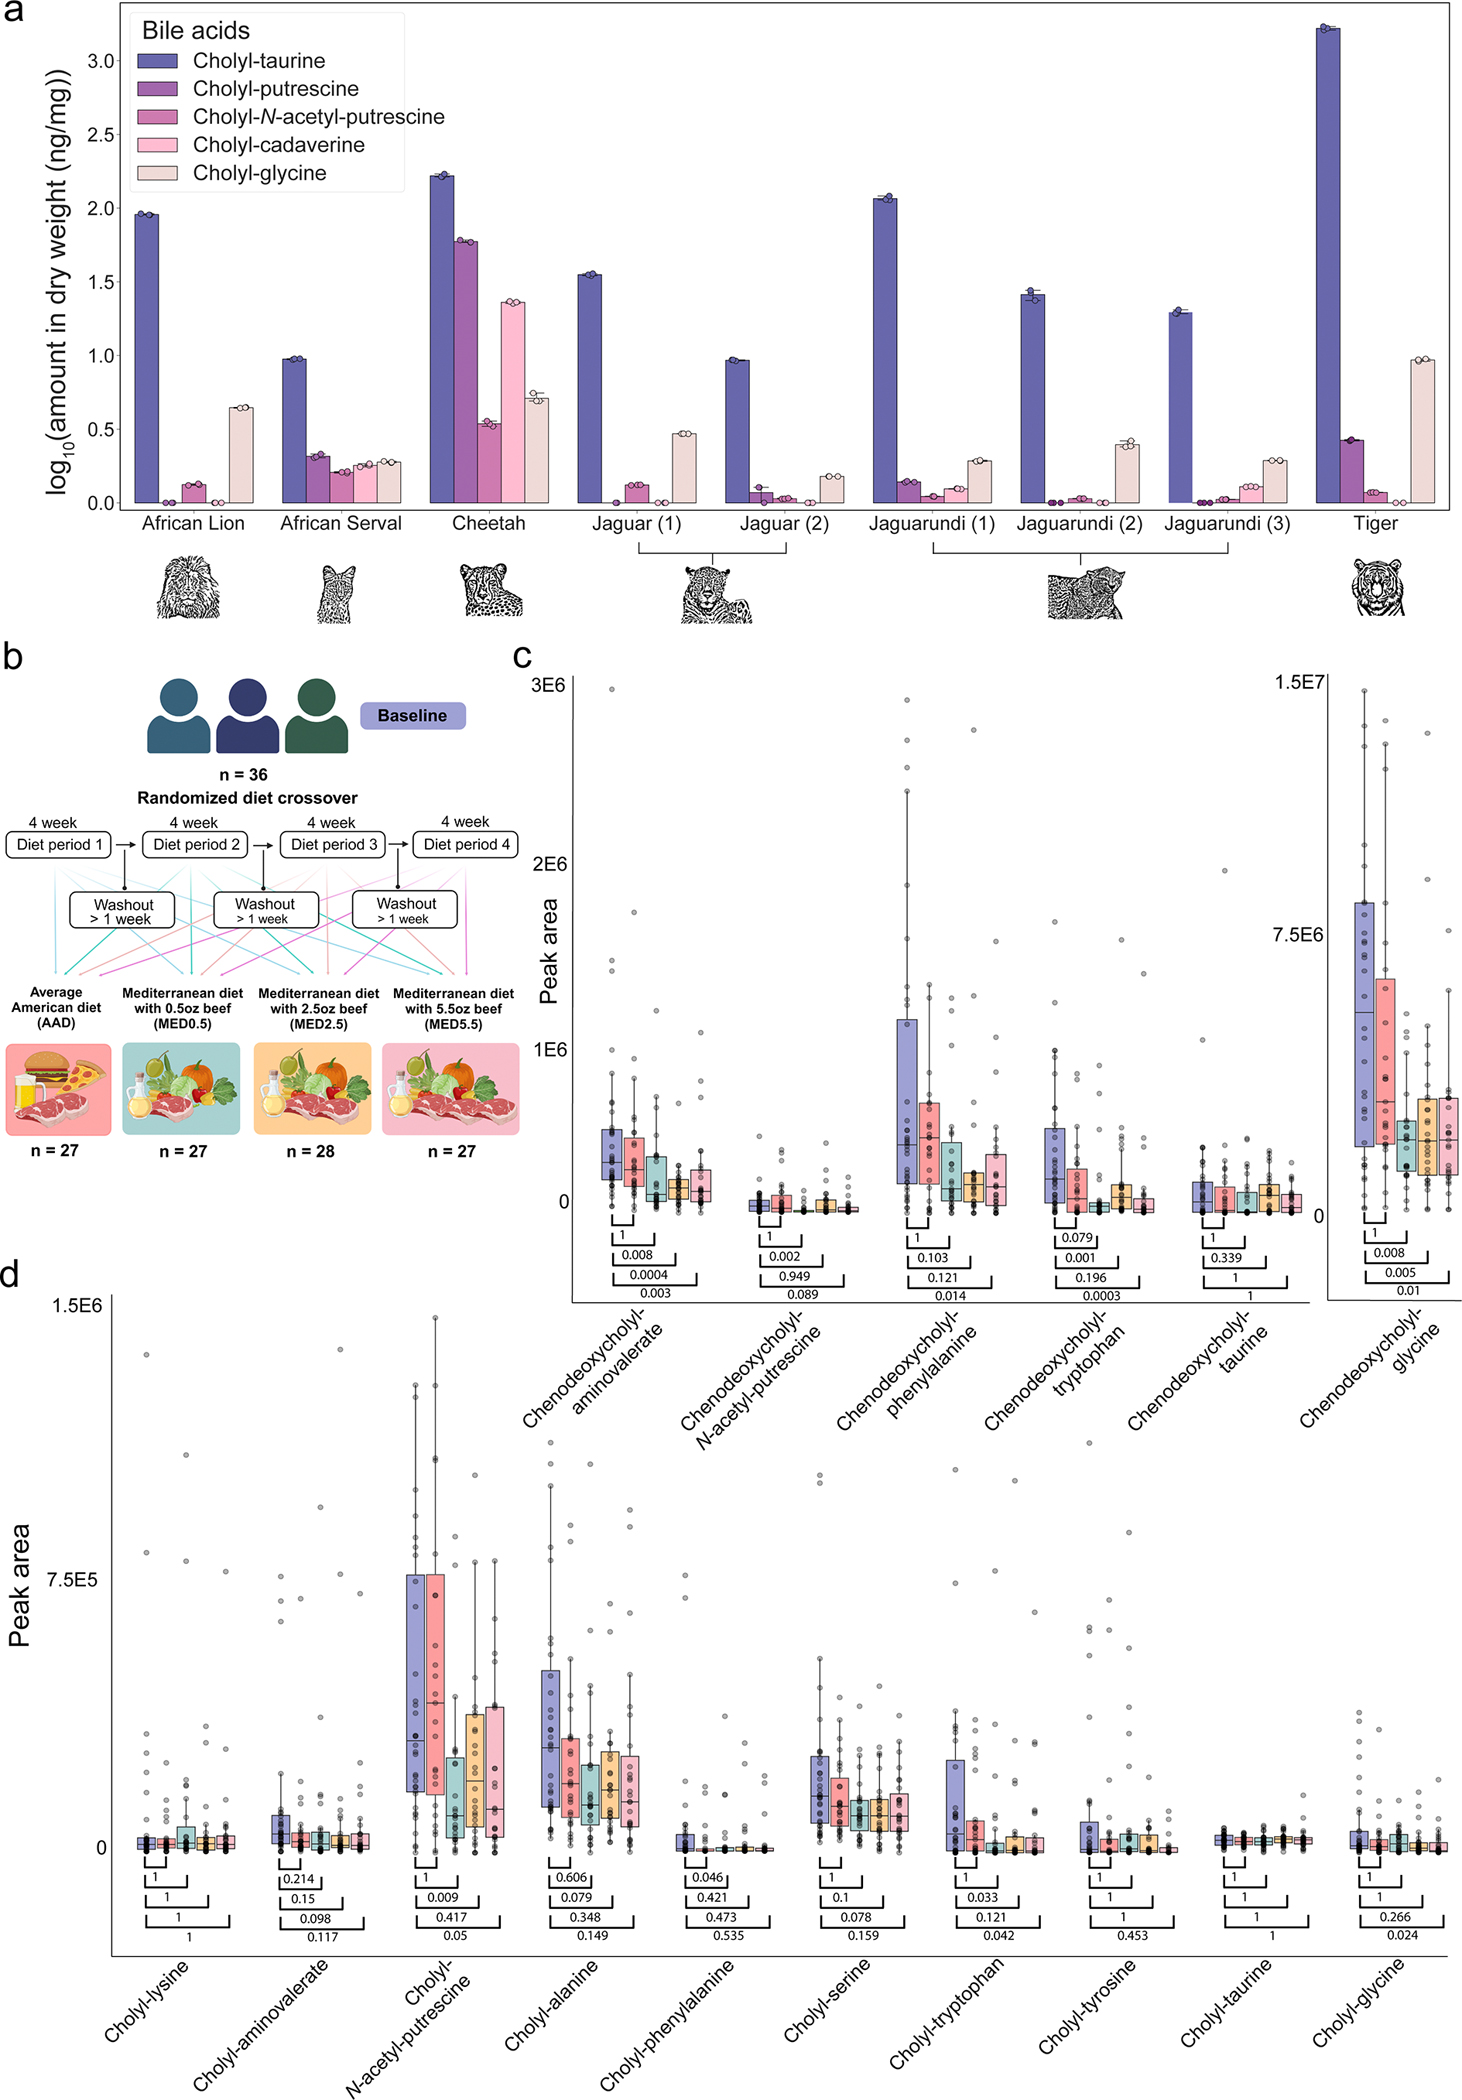
The repertoire of modifications to bile acids and related steroidal lipids by host and microbial metabolism remains incompletely characterized. To address this knowledge gap, we created a reusable resource of tandem mass spectrometry (MS/MS) spectra by filtering 1.2 billion publicly available MS/MS spectra for bile-acid-selective ion patterns. Thousands of modifications are distributed throughout animal and human bodies as well as microbial cultures. We employed this MS/MS library to identify polyamine bile amidates, prevalent in carnivores. They are present in humans, and their levels alter with a diet change from a Mediterranean to a typical American diet. This work highlights the existence of many more bile acid modifications than previously recognized and the value of leveraging public large-scale untargeted metabolomics data to discover metabolites. The availability of a modification-centric bile acid MS/MS library will inform future studies investigating bile acid roles in health and disease.

Keywords: GABA; MassQL; agmatine; bile acids; diet; fastMASST; microbial; polyamines; putrescine; spectral resource.


Conflict of interest statement

Declaration of interests P.C.D. is an advisor and holds equity in Cybele and Sirenas and a scientific co-founder, advisor, and holds equity in Ometa, Enveda, and Arome with prior approval by UC San Diego. P.C.D. also consulted for DSM animal health in 2023. M.W. is a co-founder of Ometa Labs LLC.

Figures

Figure 1.
Figure 1.. MassQL query and results from repository search.
a) Representative MS/MS spectrum of glycocholic acid (tri-hydroxylated bile acid amidate, USI:mzspec:GNPS:BILELIB19:accession:CCMSLIB00005435513) with the diagnostic fragment ions indicated that were used to design the MassQL query. b) Schematic representation of delta mass calculation using glycocholic acid as an example. Glycine can be appended to the bile acid either as an ester or amidate and subtracting the mass of the free bile acid, in this case - cholic acid, yields the delta mass corresponding to a mass of glycine (m/z 57.02). c) Distribution of delta masses across bile acid classes, from non-, mono-, di-, tri-, tetra- and penta-hydroxylated bile acids, visualized as an UpSet plot of delta masses. Each vertical column represents the number of delta masses, called an intersection size, which is connected to the corresponding bile acid classes, represented by the horizontal columns on the left and called set size, where the intersection of delta masses is detected. Overlapping delta masses are connected to multiple set sizes. As an example, the delta mass of glycine, m/z 57.02, is one of 15 delta masses that are observed in bile acids of all classes (the full list is provided in Table S2). d) Heatmap of observed delta masses based on their frequency of occurrence in log scale within different classes of bile acids. A zoomed-in heatmap for delta masses between 50 to 120 m/z is also shown with the delta masses corresponding to MS1 matches to amino acids and amines demonstrated with structures. Arrows in red show amines that are discovered in this study and discussed later in the paper. e) Summary of the atomic compositions of the delta masses recovered from formula prediction tools. See also Figure S1, Table S1, Table S2.
Figure 2.
Figure 2.. Distributions of delta masses obtained from fastMASST62 searches among different biofluids and organs.
Summary of the delta mass occurrences in different body parts (organs, tissues, biofluids) in a) rodents and b) humans. The numbers in each oval indicate the number of different delta masses, and colors represent the different bile acid classes. UpSet plots demonstrate the distribution of the delta masses within multiple body parts in c) rodents and in d) humans. Vertical columns in the UpSet plots represent the number of unique delta masses (intersection size) with their distribution in different body parts (horizontal columns on the left called set size) shown as black dot(s). The intersections highlighted in red correspond to delta masses corresponding to modifications for which we have annotations, including proteinogenic amino acids. For example, in Figure 2c, the citrulline delta mass is 1 out of the 272 delta masses observed and is only observed in rodent feces and no other sample type, while the phenylalanine delta mass is one of 11 delta masses found in seven sample types, including stomach, gallbladder, blood, cecum, ileum, jejunum, and feces. Panels a and b were created using BioRender.com. See Figure S2 and Table S3.
Figure 3.
Figure 3.. Evidence for microbial-derived bile acids.
a) A representative example of microbeMASST results with phenylalanine tri-hydroxylated bile amidate (MS/MS spectra ID: CCMSLIB00006582001). b) Taxonomic distribution, at the class level, of the candidate bile acid amidate MS/MS spectra with matches in microbeMASST represented as a taxonomic tree generated in iTOL. The yellow circles on the nodes of the taxonomic tree highlight bacterial taxa where bile acid spectral matches were detected. c) Presence/absence-based visualization of the bile amidates in axenic microbial/fungal cultures is highlighted for the delta masses from non-, di-, tri- and tetra-hydroxylated bile acids. No matches were recovered from mono- and penta-hydroxylated MS/MS spectra. The count of delta masses is summarized at the phylum level using barplots. Relative levels of delta masses represented by normalized counts of MS/MS spectra obtained from classical molecular networking with respect to d) high-fat diet (HFD) or normal chow diet (NC) and e) antibiotic use in the public dataset MSV000080918. Bile acid MS/MS spectral matches to the GNPS reference library are represented with a green circle next to the delta mass. Icons were obtained from BioRender.com. See Figure S3.
Figure 4.
Figure 4.. Discovery of candidate polyamine bile amidates.
a) Polyamine biosynthetic pathway with an orange circle highlighting candidate polyamine and other intermediates and precursors in the polyamine biosynthetic pathway amidated to bile acids as recovered from matching precursor masses with various databases. Delta masses are shown in parentheses for each of the amidates known previously or recovered from public data. b) Sample-to-sample peak areas of the subset of polyamine bile amidates and two commonly known bile acids, taurine, and glycine amidates, detected in a public dataset (MSV000086131) containing different animals with a carnivorous, omnivorous, and herbivorous diet. A higher abundance of the amidates was observed in carnivores. A non-parametric Kruskal-Wallis test followed by Wilcoxon was performed and all p values were corrected for multiple comparisons using Benjamini-Hochberg correction. Horizontal lines indicate the median value, the first and third quartiles are represented by the box edges and vertical lines indicate the error range. Green circles in the figure represent library matches of the resource to MS/MS spectra in the GNPS reference library. See Figure S4 and Table S4.
Figure 5.
Figure 5.. Matching of polyamine bile amidates using synthetic standards.
a) Structures of all polyamine cholic amidates, b) MS/MS spectra mirror matches and retention time matches to a subset of polyamine cholic acid amidates that were detected in both of the lion and mouse studies MSV000080574 (https://massive.ucsd.edu/) (blue) and MSV000086131 (pink), with authentic synthetic standards. Similarly, for di-hydroxylated bile acids - c) structures of all polyamine chenodeoxycholic amidates, d) MS/MS spectra mirror matches and retention time matches of the subset of polyamine chenodeoxycholic acid amidates detected in both of the two studies MSV000080574 (blue) and MSV000086131 (pink), with synthetic standards. The red cross in the figure represents no detection of those polyamine bile amidates in lion or mice fecal samples. MS/MS mirror plots can be interactively visualized from the raw data in the GNPS dashboard the with the following links for the plots in the order they appear in the figure: cholyl-putrescine (top, bottom), cholyl-spermidine (top, bottom), cholyl-cadaverine (top, bottom), cholyl-N-acetyl-cadaverine (top, bottom), chenodeoxycholyl-N-acetyl-putrescine (top, bottom), chenodeoxycholyl-N-acetyl-spermidine (top, bottom), chenodeoxycholyl-cadaverine (top, bottom). Icons were obtained from BioRender.com. See Figure S5, S6, S7 and Table S4.
Figure 6.
Figure 6.. Quantification of polyamine bile amidates in felines and observation of amidates in a randomized human diet study.
a) Absolute abundance of polyamine bile amidates in ng/mg dry weight of fecal material as quantified in different feline species, b) Study design for randomized diet crossover study in 36 human participants. Color scheme from b for the diet types is carried forward to c and d. Peak area abundances of different polyamine amidated to c) chenodeoxycholic acid and d) cholic acid as observed in humans with four different diet treatments compared with the baseline information. The non-parametric Wilcoxon test was performed, and p-values were Bonferroni corrected. Icons were obtained from BioRender.com. See Table S5.

Similar articles

Cited by

References

    1. Parks DJ, Blanchard SG, Bledsoe RK, Chandra G, Consler TG, Kliewer SA, Stimmel JB, Willson TM, Zavacki AM, Moore DD, et al. (1999). Bile acids: natural ligands for an orphan nuclear receptor. Science 284, 1365–1368. - PubMed
    1. Makishima M, Okamoto AY, Repa JJ, Tu H, Learned RM, Luk A, Hull MV, Lustig KD, Mangelsdorf DJ, and Shan B (1999). Identification of a nuclear receptor for bile acids. Science 284, 1362–1365. - PubMed
    1. Hang S, Paik D, Yao L, Kim E, Trinath J, Lu J, Ha S, Nelson BN, Kelly SP, Wu L, et al. (2019). Bile acid metabolites control TH17 and Treg cell differentiation. Nature 576, 143–148. - PMC - PubMed
    1. Paik D, Yao L, Zhang Y, Bae S, D’Agostino GD, Zhang M, Kim E, Franzosa EA, Avila-Pacheco J, Bisanz JE, et al. (2022). Human gut bacteria produce ΤΗ17-modulating bile acid metabolites. Nature 603, 907–912. - PMC - PubMed
    1. Song X, Sun X, Oh SF, Wu M, Zhang Y, Zheng W, Geva-Zatorsky N, Jupp R, Mathis D, Benoist C, et al. (2020). Microbial bile acid metabolites modulate gut RORγ+ regulatory T cell homeostasis. Nature 577, 410–415. - PMC - PubMed

LinkOut - more resources