. 2024 Mar 19;5(3):101463.
doi: 10.1016/j.xcrm.2024.101463. Epub 2024 Mar 11.

Synthetic PET from CT improves diagnosis and prognosis for lung cancer: Proof of concept

Affiliations

Synthetic PET from CT improves diagnosis and prognosis for lung cancer: Proof of concept

Morteza Salehjahromi et al. Cell Rep Med. .

Abstract

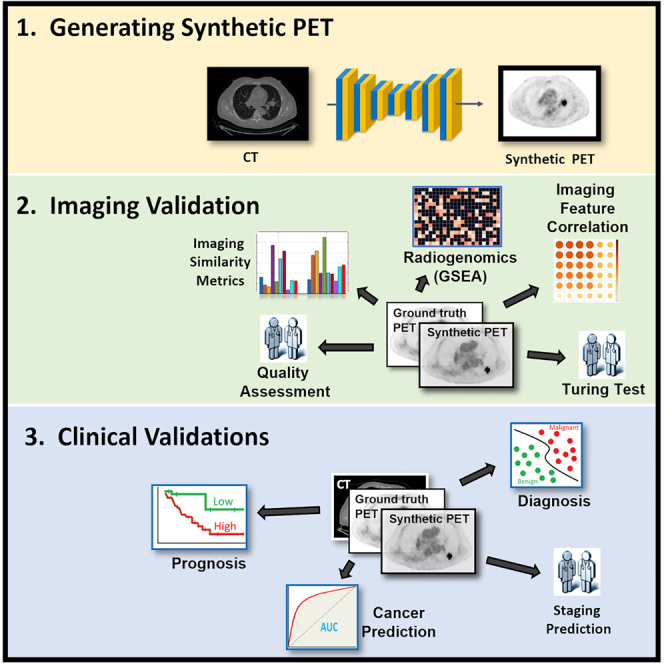
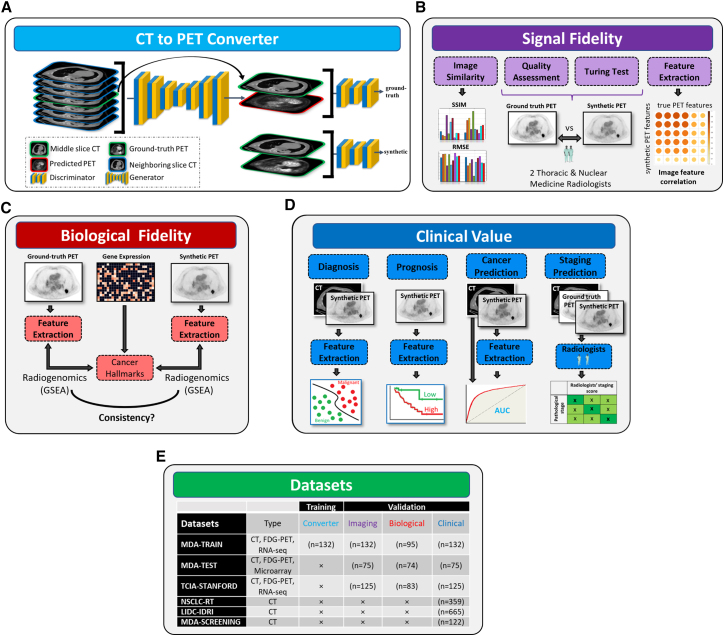
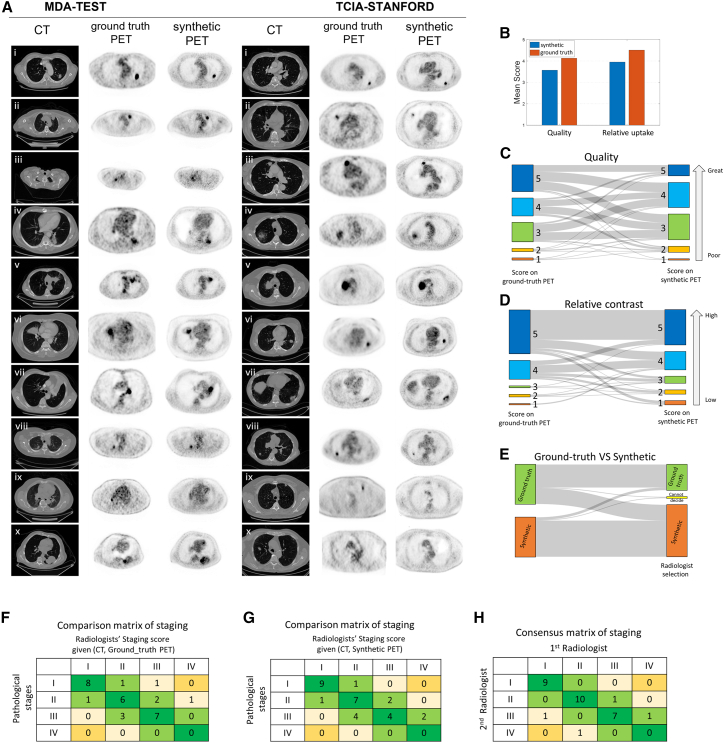
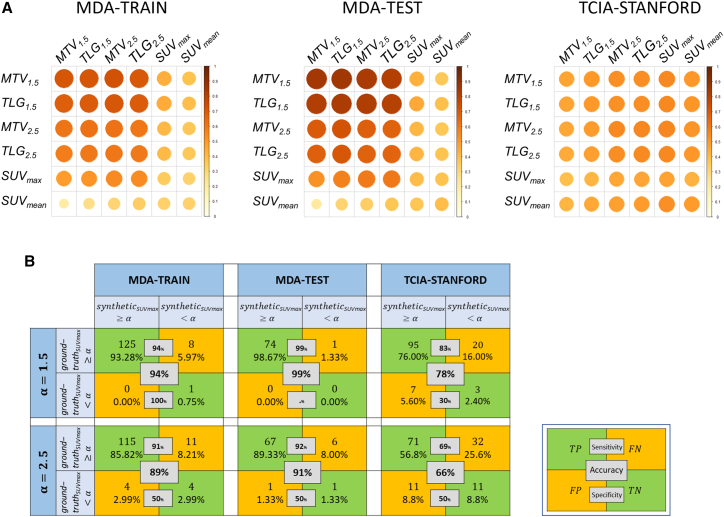
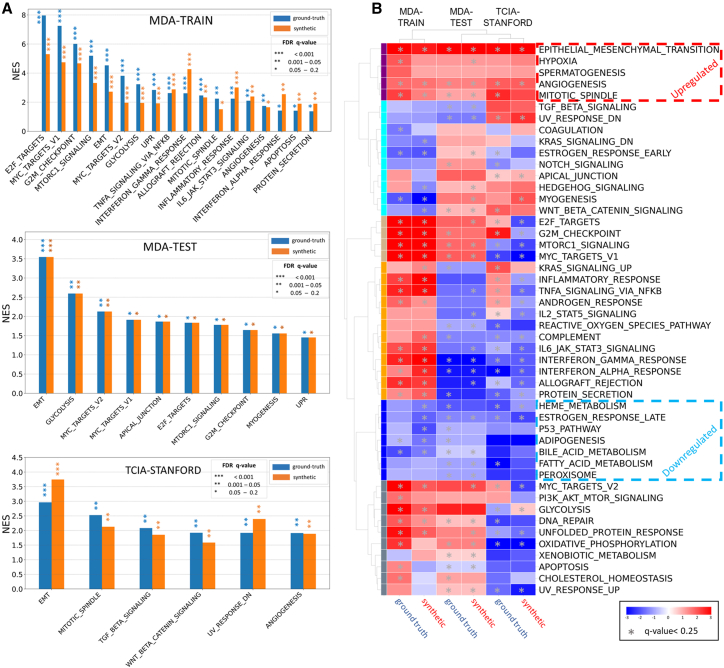
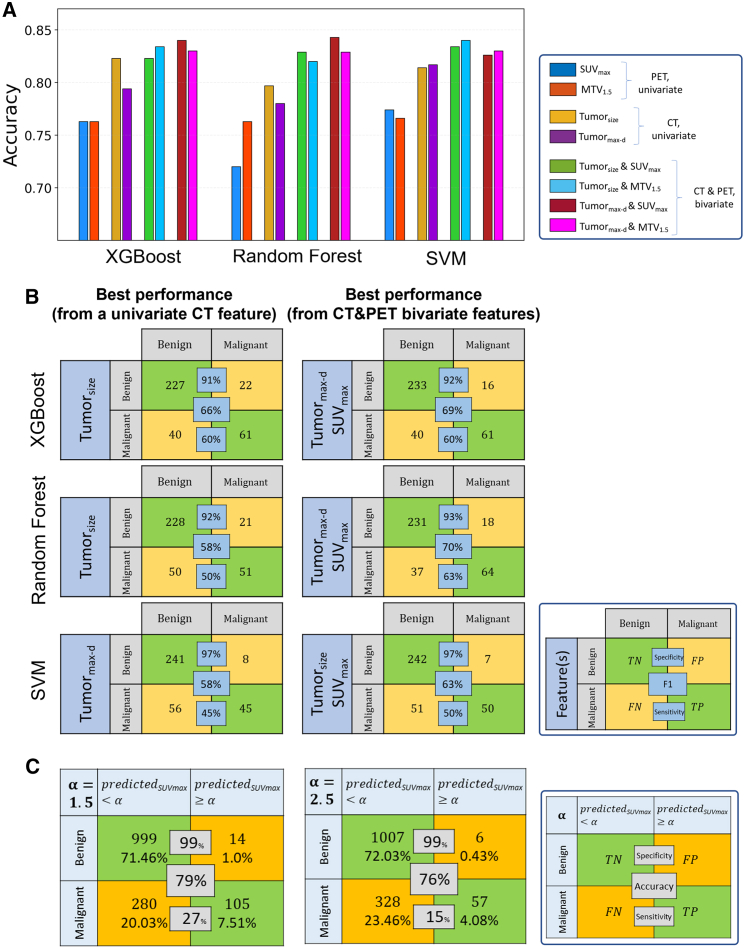
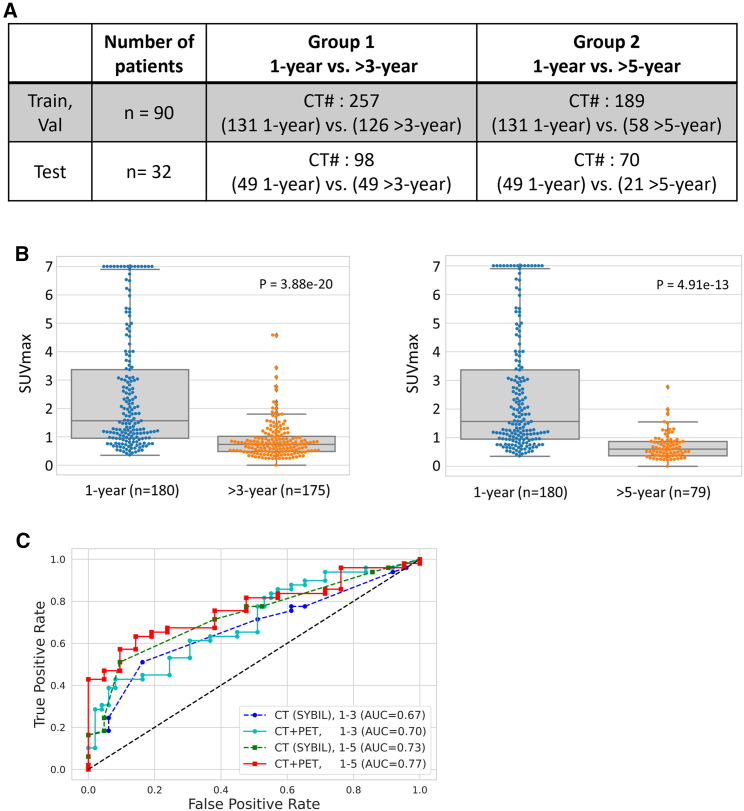
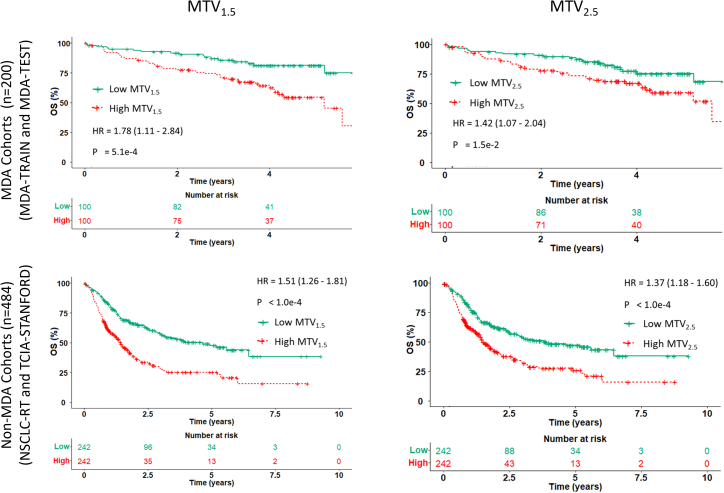
[18F]Fluorodeoxyglucose positron emission tomography (FDG-PET) and computed tomography (CT) are indispensable components in modern medicine. Although PET can provide additional diagnostic value, it is costly and not universally accessible, particularly in low-income countries. To bridge this gap, we have developed a conditional generative adversarial network pipeline that can produce FDG-PET from diagnostic CT scans based on multi-center multi-modal lung cancer datasets (n = 1,478). Synthetic PET images are validated across imaging, biological, and clinical aspects. Radiologists confirm comparable imaging quality and tumor contrast between synthetic and actual PET scans. Radiogenomics analysis further proves that the dysregulated cancer hallmark pathways of synthetic PET are consistent with actual PET. We also demonstrate the clinical values of synthetic PET in improving lung cancer diagnosis, staging, risk prediction, and prognosis. Taken together, this proof-of-concept study testifies to the feasibility of applying deep learning to obtain high-fidelity PET translated from CT.

Keywords: Turing test; generative AI; generative adversarial network; image synthesis; lung cancer; prognostic marker; radiogenomics; radiomics; screening; synthetic PET.


Conflict of interest statement

Declaration of interests T.C. reports speaker fees and honoraria from The Society for Immunotherapy of Cancer, Bristol Myers Squibb, Roche, Medscape, and PeerView; having an advisory role or receiving consulting fees from AstraZeneca, Bristol Myers Squibb, EMD Serono, Merck & Co., Genentech, and Arrowhead Pharmaceuticals; and institutional research funding from AstraZeneca, Bristol Myers Squibb, and EMD Serono. L.Y. has grant support from Lantheus Inc. D.L.G. has served on scientific advisory committees for Menarini Ricerche, 4D Pharma, Onconova, and Eli Lilly and has received research support from Takeda, Astellas, NGM Biopharmaceuticals, Boehringer Ingelheim, and AstraZeneca. N.I.V. receives consulting fees from Sanofi, Regeneron, Oncocyte, and Eli Lilly and research funding from Mirati, outside the submitted work. J.D.H. is on the Scientific Advisory Board of Imagion Biosystems. J.Y.C. reports research funding from BMS-MDACC and Siemens Healthcare, and consultation fees from Legion Healthcare Partners. L.Y. has grant support from Lantheus Inc. M.C.B.G. has received research funding from Siemens Healthcare. I.W. has received honoraria from Genentech/Roche, AstraZeneca, Merck, Guardant Health, Flame, Novartis, Sanofi, Daiichi Sankyo, Dava Oncology, Amgen, GlaxoSmithKline, HTG Molecular, Jansen, Merus, Imagene, G1 Therapeutics, Abbvie, Catalyst Therapeutics, Genzyme, Regeneron, Oncocyte, Medscape, Platform Health, Pfizer, Physicians’ Education Resource, HPM Education, and Aptitute Health; additionally, I.W. has received research support from Genentech, Merck, Bristol-Myers Squibb, Medimmune, Adaptive, Adaptimmune, EMD Serono, Pfizer, Takeda, Amgen, Karus, Johnson & Johnson, Bayer, Iovance, 4D, Novartis, and Akoya. D.L.G. has served on scientific advisory committees for Menarini Ricerche, 4D Pharma, Onconova, and Eli Lilly and has received research support from Takeda, Astellas, NGM Biopharmaceuticals, Boehringer Ingelheim, and AstraZeneca. J.V.H. reports being on scientific advisory boards for AstraZeneca, Boehringer Ingelheim, Genentech, GlaxoSmithKline, Eli Lilly, Novartis, Spectrum, EMD Serono, Sanofi, Takeda, Mirati Therapeutics, BMS, and Janssen Global Services; receiving research support from AstraZeneca, Takeda, Boehringer Ingelheim, and Spectrum; and receiving licensing fees from Spectrum. C.C.W. reports research support from Medical Imaging and Data Resource Center from NIBIB/University of Chicago and royalties from Elsevier. J.Z. reports serving on the consulting/advisory board of Bristol-Myers Squibb, AstraZeneca, Novartis, Johnson & Johnson, GenePlus, Innovent, Varian, and Catalyst, and receiving research grants to institution from Merck, Novartis, and Johnson & Johnson. J.W. reports research funding from Siemens Healthcare.

Figures

None
Graphical abstract
Figure 1
Figure 1
Overview of the study design (A) Training the cGAN to predict PET image from CT. The input of the generator is a CT slice along with its six neighboring slices while its output is the synthetic PET image. The discriminator tries to classify between the synthetic and ground-truth PET/CT pairs. (B) In the imaging validation, similarity metrics including SSIM and RMSE were employed for comparing the synthetic and ground-truth PET images. A group of two thoracic radiologists was enrolled blindly to visually assess the quality of synthetic PET images. Next, they conducted a Turing test on synthetic and ground-truth PET images. Moreover, we analyzed the pairwise similarity between the synthetic and ground-truth PET features. (C) In the biological validation, we applied radiogenomic analysis using the GSEA method to find the association of cancer hallmarks with extracted features from ground-truth and synthetic PET scans. (D) In the subsection “synthetic PET complements CT for early lung cancer diagnosis,” we investigated whether the performance of indeterminate pulmonary nodule classification using only main CT-based features can be further improved by adding the extracted features from the synthetic PET. In cancer prediction, we validated the clinical value of synthetic PET in prediction of the development of lung cancer and in staging prediction. In staging prediction, two radiologists assess the synthetic PET capability for accurately staging the lung cancer patients. In the subsection “synthetic PET predicts prognosis after standard of care,” we showed that the extracted nodule features from the synthetic PET are capable of stratifying patients into good and bad survival groups. (E) The cohorts used in different sections.
Figure 2
Figure 2
Validation of imaging signal fidelity and cancer staging performance by radiologists (A) Presentation of synthetic PET images with ground-truth PET in MDA-TEST and TCIA-STANFORD testing cohorts. The first three columns from left to right for each cohort correspond to CT, ground-truth, and synthetic PET images. The PET images are shown inversely with the normalized window of SUV in [0,3]. Therefore, the completely black color in tumors indicates that the tumor had uptake with maximum SUV value of at least 3. (B) The radiologists’ score on quality and relative uptake of lung region in task 1 of the imaging quality test. (C) Alluvial plot shows the radiologists’ scoring on imaging quality difference using paired PET scans. (D) Alluvial plot shows the radiologists’ scoring on tumor contrast difference using paired PET scans. (E) Alluvial plot shows the radiologists’ reading of ground-truth vs. synthetic using paired PET scans. (F) Comparison matrix of staging between radiologists reading CT and ground-truth PET and pathological stage. (G) Comparison matrix of staging between radiologists reading CT and synthetic PET and pathological stage. (H) Consensus matrix of staging between the two radiologists when one radiologist reads true PET and CT compared to another reading synthetic PET and CT.
Figure 3
Figure 3
Validation of imaging signal fidelity by PET feature correlation (A) Pearson correlation for evaluating the pairwise similarity between the synthetic (rows) and ground-truth (columns) PET features in MDA-TRAIN, MDA-TEST, and TCIA-STANFORD cohorts. (B) Threshold-based confusion matrix for synthetic SUVmax and the ground-truth SUVmax for four different thresholds (α=1.5,2.5) in MDA-TRAIN, MDA-TEST, and TCIA-STANFORD cohorts.
Figure 4
Figure 4
Validation of biological fidelity by radiogenomics analysis (A) Significant hallmark gene sets associated with MTV extracted from ground-truth and synthetic PET for MDA-TRAIN, TCIA-STANFORD, and MDA-TEST cohorts. (B) The first column shows the unsupervised hierarchical clustering heatmap of hallmark pathways normalized enrichment score for correlation of each pathway with MTV feature from ground-truth and synthetic PET across MDA-TRAIN, TCIA-STANFORD, and MDA-TEST cohorts, where the asterisks represent the significant false discovery rate q value >0.25.
Figure 5
Figure 5
Validation of clinical value by diagnosing malignant vs. benign from indeterminate pulmonary nodules (A) Model accuracy in the test cohort (n = 350) obtained from synthetic PET univariate features (MTV, SUVmax), CT univariate features (tumorsize, tumormax-d), and CT and PET bivariate features (tumorsize & MTV, tumorsize & SUVmax, tumormax-d & MTV, tumormax-d & SUVmax) in the LIDC-IDRI cohort. (B) The first column corresponds to the confusion matrix of the best performance obtained using either of single CT features tumorsize or tumormax-d. The second column corresponds to the confusion matrix of the best performance when adding one synthetic PET feature, SUVmax or MTV. (C) Threshold-based confusion matrix for synthetic SUVmax and the nodule malignancy at four different thresholds (α=1.5,2.5) in the LIDC-IDRI cohort.
Figure 6
Figure 6
Validation of clinical value of synthetic PET by predicting the risk of developing lung cancer (A) Distribution of CT scans in training, validation, and test sets in both group 1 and group 2. (B) Two box plots were used to compare the synthetic SUVmax values in group 1 (lung cancer diagnosed within 1 year vs. lung cancer diagnosed at >3 years) and group 2 (lung cancer diagnosed within 1 year vs. lung cancer diagnosed at >5 years). (C) Receiver-operating characteristic curves for CT and CT plus synthetic PET analysis along with their respective AUC values for both group 1 and group 2.
Figure 7
Figure 7
Validation of clinical value of synthetic PET by predicting overall survival Kaplan-Meier curves of patients’ overall survival (OS) stratified by MTV1.5 and MTV2.5 features obtained from the synthetic PET images on MDA cohorts (MDA-TRAIN and MDA-TEST) and non-MDA cohorts (TCIA-STANFORD and NSCLC-RT).

Similar articles

Cited by

References

    1. Fletcher J.W., Djulbegovic B., Soares H.P., Siegel B.A., Lowe V.J., Lyman G.H., Coleman R.E., Wahl R., Paschold J.C., Avril N., et al. Recommendations on the use of 18F-FDG PET in oncology. J. Nucl. Med. 2008;49:480–508. - PubMed
    1. Garcia-Velloso M.J., Bastarrika G., de-Torres J.P., Lozano M.D., Sanchez-Salcedo P., Sancho L., Nuñez-Cordoba J.M., Campo A., Alcaide A.B., Torre W., et al. Assessment of indeterminate pulmonary nodules detected in lung cancer screening: Diagnostic accuracy of FDG PET/CT. Lung Cancer. 2016;97:81–86. - PubMed
    1. Shim S.S., Lee K.S., Kim B.-T., Chung M.J., Lee E.J., Han J., Choi J.Y., Kwon O.J., Shim Y.M., Kim S. Non–small cell lung cancer: prospective comparison of integrated FDG PET/CT and CT alone for preoperative staging. Radiology. 2005;236:1011–1019. - PubMed
    1. Wahl R.L., Jacene H., Kasamon Y., Lodge M.A. From RECIST to PERCIST: evolving considerations for PET response criteria in solid tumors. J. Nucl. Med. 2009;50 122S-50S. - PMC - PubMed
    1. Gallach M., Mikhail Lette M., Abdel-Wahab M., Giammarile F., Pellet O., Paez D. Addressing global inequities in positron emission tomography-computed tomography (PET-CT) for cancer management: a statistical model to guide strategic planning. Med. Sci. Mon. Int. Med. J. Exp. Clin. Res. 2020;26 e926544-e926541. - PMC - PubMed

MeSH terms

Substances